
 ?Mathematical formulae have been encoded as MathML and are displayed in this HTML version using MathJax in order to improve their display. Uncheck the box to turn MathJax off. This feature requires Javascript. Click on a formula to zoom.
Abstract
A SCALE model was developed for the Molten Salt Reactor Experiment (MSRE) benchmark that was recently added to the International Handbook of Evaluated Reactor Physics Benchmark Experiments. This SCALE model served as a basis for criticality calculations and nuclear data sensitivity and uncertainty analyses with the Monte Carlo code Shift and the TSUNAMI computational capabilities in the SCALE code system. The focus of this work is the assessment of the impact of nuclear data on the calculated eigenvalue results in support of the discussion of differences between the calculated and the experimental eigenvalue result.
The differences in the eigenvalues obtained using the ENDF/B-VII.0, ENDF/B-VII.1, and ENDF/B-VIII.0 nuclear data libraries cover a relatively small range of 230 pcm. Since eigenvalue sensitivity of the MSRE is dominated by the neutron multiplicity and neutron capture of 235U and elastic scattering in graphite, relevant changes in the ENDF/B libraries for nuclear reactions (such as carbon capture) that caused large differences in other graphite-moderated systems did not have a significant impact. Propagation of nuclear data uncertainty results in an eigenvalue uncertainty of
pcm with the major contributors being
U neutron multiplicity, graphite elastic scattering, and 7Li neutron capture.
All calculations resulted in large differences of 2000 pcm in eigenvalue compared to the benchmark experimental value. Several potential contributors to this difference—including uncertainties and gaps in the knowledge of the material, geometry, and nuclear data—were identified.
Simplified models of the full MSRE core were developed, and similarity assessments were conduced with the full MSRE core model. It was found that simplified models can serve as adequate surrogates of the full-core model such that they can be used for performing selected nuclear data performance assessments with a lower computational burden.
I. INTRODUCTION
Molten salt reactors (MSRs) are one of several promising advanced reactor types currently pursued by industry and research institutions. To guarantee safe operation under all considered operating conditions and to determine appropriate safety margins, the computational analysis of these systems is of crucial importance. To build confidence in computed results, simulation software must be validated through comparison with experiments. However, available experimental data for MSRs are very limited. One of the few examples is the Molten Salt Reactor Experiment (MSRE), which was built at Oak Ridge National Laboratory and operated between 1965 and 1969 (CitationRef. 1). Its purpose was to demonstrate key features of the molten salt liquid-fuel reactor concept and to prove the practicality of the MSR technology. The MSRE reached criticality for the first time in June 1965; the corresponding zero-power first critical experiment with U was recently evaluated and included as a benchmark in the 2019 edition of the “International Handbook of Evaluated Reactor Physics Benchmark Experiments” (IRPhEP handbook).Citation2 Although the measured data provided in this benchmark are limited to the eigenvalue, the benchmark model specifications offer a basis for further performance assessments of methods and data using realistic geometrical and material specifications for investigations of other key metrics beyond eigenvalue. They also provide the basis for code-to-code comparisons across institutions based on one thoroughly reviewed data set.
All simulations in this study were performed using SCALE, a widely used computational tool set for criticality safety, reactor physics, shielding, and sensitivity and uncertainty analysis.Citation3 While SCALE has been thoroughly tested and validated for the simulation of light water reactor (LWR) criticality,Citation4 testing and validation of SCALE for the simulation of non-LWR systems is ongoing. Recent activities with respect to MSRs include sensitivity and uncertainty analyses of several MSR concepts with respect to nuclear dataCitation5,Citation6 as well as SCALE development efforts for the consideration of changing molten salt fuel compositions and reactivity changes during operation.Citation7,Citation8 Current modeling efforts concern several non-LWR systems for the validation of SCALE and the support of several activities, including severe accident analysis and nuclear data performance assessment.
This paper presents analyses of the MSRE benchmark with SCALE based on the IRPhEP benchmark specifications. The focus of this work is the assessment of the impact of nuclear data on the calculated eigenvalue results. Eigenvalue results obtained with SCALE’s new Monte Carlo code ShiftCitation9 using the three latest ENDF/B nuclear data library evaluations are compared with the benchmark value. Detailed sensitivity analyses of the eigenvalue due to changes in nuclear data are performed with SCALE’s TSUNAMI toolCitation10 to identify potential major drivers of differences between results with the different ENDF/B libraries. The impact of nuclear data uncertainties on the eigenvalue is investigated, and major drivers to the obtained uncertainties are identified in support of the discussion of differences between the calculated and the experimental eigenvalue results. Finally, the degree of similarity for a number of simplified models is investigated in the hope that the simplified models can provide the nuclear data assessment community an easy alternative to the detailed full-core model for future assessments.
While many published reports describe different experiments of the MSRE and many computational analyses have been performed for different areas of interest, at this writing, only the MSRE benchmark authors have published a computational analysis based on the new IRPhEP handbook specifications. Therefore, code-to-code comparisons are limited to comparisons with the eigenvalue and uncertainty analysis results reported by Shen et al.,Citation2,Citation11,Citation13 and Fratoni et al.Citation12
II. MOLTEN SALT REACTOR EXPERIMENT
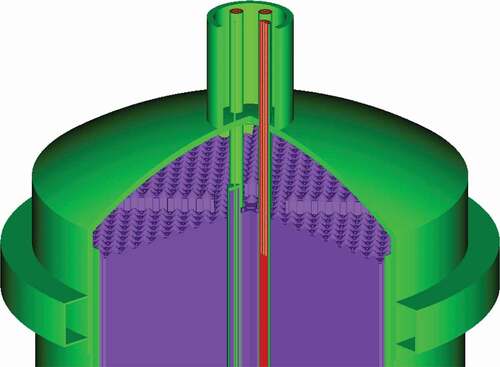
The MSRE was the first large-scale, long-term, high-temperature experiment performed using a fluid fuel salt, graphite moderator, and new nickel-based alloys in a reactor environment. The circulating fuel was a mixture of lithium, beryllium, and zirconium fluoride salts containing uranium fluorides. Reactor heat was transferred from the fuel salt to a coolant salt and was then dissipated to the atmosphere. The MSRE was designed to provide a thermal output of 10 MW(thermal). The reactor reached criticality for the first time in June 1965. Although a detailed description of the corresponding zero-power first critical experiment with U is available in the IRPhEP handbook,Citation2 a brief summary is presented herein to convey the significance of the results obtained in the current study. presents an overview of the MSRE’s key characteristics, and are illustrations of the reactor core.
TABLE I Key Characteristics of the MSRE*
Fig. 1. MSRE layout.Citation15
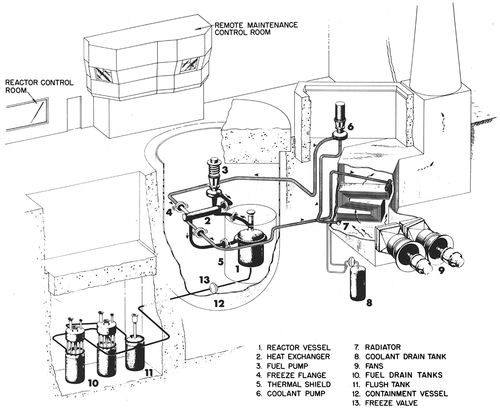
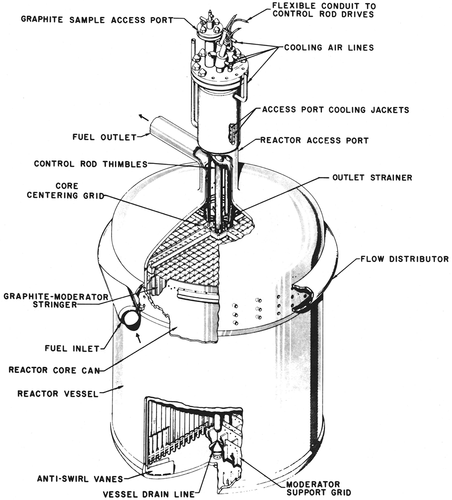
Fig. 2. MSRE reactor vessel.Citation15
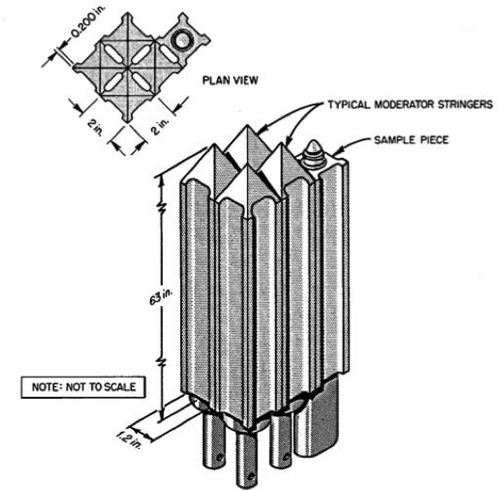
The MSRE core consisted of a lattice of rectangular prism-shaped graphite “stringers” that were vertically oriented within a cylindrical reactor vessel. The fuel salt entered the flow distributor at the top of the vessel through the fuel inlet. The fuel salt was then distributed evenly around the circumference of the vessel, and then, it flowed downward through an 2.54 cm annulus between the vessel wall and the core can. The salt was then pumped upward through the graphite lattice. Each vertical graphite stringer had a side length of 5.08 cm and an axial length of 170.03 cm. The salt flowed through more than 1000 channels. Each channel was
1 cm thick and was formed by grooves in the sides of the stringers (). Each groove consisted of a rounded rectangle that was 4.064 cm wide with a corner radius of 0.508 mm. In the center of the core, three graphite sample baskets were mounted to allow for investigation of the graphite moderator’s behavior in the reactor environment through periodic removals of graphite specimens.
Fig. 3. Dimensions and arrangement of the MSRE graphite stringers.Citation12
The salt served the dual purpose of carrying the fuel and cooling the core. It was composed of (1) the carrier salt containing the beryllium, zirconium, and most of the lithium fluorides; (2) depleted uranium eutectic (73LiF-27UF); and (3) highly enriched uranium eutectic (73LiF-27UF
). The reactor vessel consisted of INOR-8, a nickel-based alloy. The core was surrounded by an insulator, simplified in the benchmark specification as a homogeneous mixture (O, Fe, Al, H, Si, Ca), and a steel thermal shield.
The temperature specified for the thermal shield and insulation is 305 K. The temperature specified for all other materials in the benchmark is 911 K.
The IRPhEP benchmark provides the experimental eigenvalue and the corresponding experimental uncertainty. The benchmark also includes a calculated eigenvalue obtained with the Serpent codeCitation14 and documents a first assessment of the influence of nuclear data uncertainties on the eigenvalue. These results are also published in the open literature.Citation11–13
III. APPLIED CODES AND DATA
III.A. Codes
III.A.1. Neutron Transport
Multiple neutron transport kernels are available in SCALE (CitationRef. 3) for multigroup (MG) and continuous-energy (CE) calculations. In the current release, SCALE 6.2.4, the Monte Carlo code KENO can be used for three-dimensional (3-D) calculations in both MG and CE mode.
With the upcoming SCALE 6.3 release expected in 2021, the new Monte Carlo transport kernel ShiftCitation9 will be available. Shift has additional capabilities compared to KENO, such as the generation of nodal data for use in nodal diffusion codes, and it provides excellent performance when used with massive parallelization.
The calculations presented in this work were performed with Shift in CE mode, invoked by SCALE’s Criticality Safety Analysis Sequences (CSAS). CSAS automatically performs all required nuclear data processing steps, calls the requested neutron kernel, and collects the results. The MSRE benchmark was modeled according to the benchmark specifications, except for the distributor ring for which the half-torus was approximated with a cylindrical ring while preserving the fuel mass within the distributor. Within the context of the comparisons of calculated eigenvalues with the experimental eigenvalue, the influence of this modeling approximation is considered small; a complete removal of the distributor was shown to cause a small eigenvalue difference of less than 100 pcm (CitationRef. 13). Illustrations of the SCALE model are shown in .
Fig. 4. SCALE model of the MSRE (horizontal cut).
Fig. 5. SCALE model of the MSRE (vertical cut).
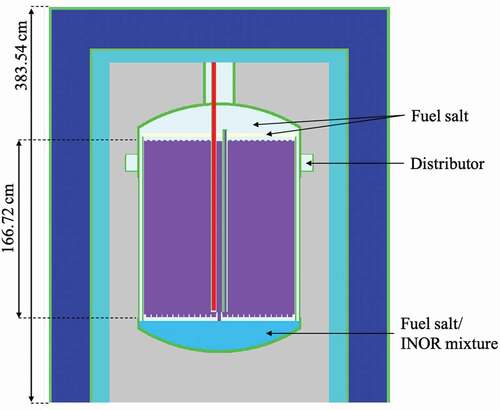
Fig. 6. SCALE model of MSRE’s reactor vessel without the fuel salt. The tapered end sections of the graphite stringers with different heights, the control rod, and the sample basket are visible.
It needs to be mentioned that the neutronic analysis of a fluid-fueled system usually requires the consideration of continuous feed and removal of the fuel, the removal of fission products and actinides from the fuel, and delayed neutron precursor flow. For example, the effect of delayed neutron precursor drift on the eigenvalue can be on the order of several hundred pcm (CitationRef. 8). However, the MSRE benchmark specifications considered here describe a zero-power first critical experiment with fresh fuel, neglecting fuel flow and therefore also precursor flow. Therefore, these types of effects were not considered in this paper.
III.A.2. Sensitivity and Uncertainty Analysis
A common method used to quantify the uncertainty of output quantities due to uncertainties in nuclear data is perturbation theory. In this approach, sensitivities of the quantities of interest, such as the eigenvalue, reaction rates, and reactivity coefficients, to changes in the nuclear data are determined. In linear (or first-order) perturbation theory, the derivatives of the output quantity with respect to the input parameters—in this case, cross sections
—are obtained for all nuclides
of the model of interest with all reactions
in all energy groups
:
are called sensitivity coefficients. These coefficients describe the relative impact of a perturbation of cross section
of nuclide
in energy group
on output quantity
. In other words, a sensitivity coefficient defines how much an output quantity would change due to a change in a particular cross section. For example, the larger the sensitivity is for a particular cross section, the greater the impact of a change of this cross section will be due to an update from one evaluated library release to the next or when considering this cross section’s uncertainty.
The nuclear data uncertainties are given in energy-dependent covariance matrices for each nuclide reaction and for correlations between different nuclide reactions. Using these covariance matrices and the sensitivity coefficients, the application of first-order uncertainty propagation (the so-called sandwich formula) leads to the total output varianceCitation16:
Vector includes the sensitivities of all the input cross sections to the output quantity Y, and the covariance matrix C includes the covariance matrices of all the input cross sections. If EquationEq. (2
(2)
(2) ) is applied to only the covariance matrix of one nuclear reaction, then the individual contribution of only this reaction to the output uncertainty is obtained.
This perturbation-based approach is implemented in SCALE’s TSUNAMI code.Citation10,Citation17 The MG version of TSUNAMI can be used in combination with various MG neutron transport kernels of SCALE, but it always requires forward and adjoint calculations. However, since the release of SCALE 6.2, a CE version of TSUNAMI is available that requires only one forward calculation with KENO in CE mode. While both the iterated fission probability (IFP) methodCitation18 and the Contributon-Linked Eigenvalue Sensitivity/Uncertainty Estimation via Track Length Importance Characterization (CLUTCH) methodCitation19 can be used to determine the sensitivities, only the IFP method was applied in this work. The IFP method computes adjoint solutions by recognizing that the importance of a neutron is proportional to the population of neutrons existing in some future generation resulting from the original neutron. After some initial neutron causes a fission event, the fission chain of this neutron is tracked for a number of generations.Citation18 When applying the IFP method, the user has only to determine an appropriate number of latent generations, that is, the number of neutron generations to track.
The IFP method has recently been implemented for use with the new Monte Carlo code Shift. In contrast to the KENO-IFP implementation, a parallel version is available that allows the user to run a time-efficient TSUNAMI calculation without the need to determine settings beyond the number of latent generations. The excellent performance, including the parallelization of this Shift-IFP implementation, has been demonstrated, showing an almost linear behavior up to the use of several hundred processors.Citation20 The IFP method has a large memory footprint by nature. However, because of the efficiency of Shift-IFP’s parallel implementation, the memory allocation can be reduced to more reasonable levels: The memory requirement per processor decreases with increasing number of processors, allowing an efficient calculation with many neutrons per history across multiple computing nodes. Because of these benefits, Shift-IFP was applied in this study. Direct perturbation (DP) calculations were also performed to confirm the largest obtained sensitivities and thereby the chosen number of latent generations (the only required TSUNAMI parameter for this approach).
III.A.3. Similarity Assessment
The sensitivity coefficients calculated by TSUNAMI can be used in a similarity assessment with other experiments using TSUNAMI-IP. TSUNAMI-IP computes correlation coefficients that determine the similarity between a target application and each benchmark experiment considered in the analysis. While many different coefficients can be computed, the integral indices and
were calculated in this studyCitation17:
E: If the groupwise sensitivity data for all nuclides and reactions for a system is thought of as a vector, then the integral index E is the cosine of the angle between the sensitivity vectors for the two analyzed systems. If the two sensitivity vectors are parallel, or proportional, then the systems are similar. When considering a sensitivity vector Sa for the application and a sensitivity vector Se for the experiment, respectively, then the similarity in terms of E of the application with the experiment is calculated as follows:
(3)
ck: The index ck is the correlation coefficient of the application and the experiment’s eigenvalue, taking covariance data into account. With a sensitivity matrix containing eigenvalue sensitivity coefficients of both the application and the experiment
The matrix has dimension 2
2 and consists of relative variance values,
and
, for the application and the experiment
(the diagonal elements), as well as the relative covariance between them, (the off-diagonal elements). These off-diagonal elements represent the shared or common variance between two systems. The off-diagonal elements are typically divided by the square root of the corresponding diagonal elements (i.e., the respective standard deviations) to determine the correlation coefficient:
which represents the correlation coefficient between uncertainties in application and experiment
.
Both indices are normalized such that a value of 0.0 indicates the two compared systems are totally dissimilar. A value of 1.0 indicates that they respond identically, as nuclear data vary according to the covariance. A negative value indicates that for an identical change in data, one system’s eigenvalue would decrease, and the other would increase.
Both indices were calculated between the MSRE and criticality experiments of the International Criticality Safety Benchmark Evaluation Project (ICSBEP) handbook.Citation21 The SCALE input files for the criticality experiment were taken from the Verified, Archived Library of Inputs and Data (VALID), which contains more than 600 reviewed SCALE input files for ICSBEP experiments and is used for the SCALE library validation for criticality safety analysis.Citation4,Citation22,Citation23 These experiments cover a wide range of characteristics, including different physical fuel forms, fissile materials, and spectral conditions. This analysis is performed to determine whether systems similar to the MSRE are already covered in SCALE’s validation suite or if the MSRE could fill a potential gap.
Furthermore, the indices were calculated between the complete benchmark MSRE model and the following simplified MSRE models:
Unit cell 1 represents one graphite stringer element ().
Unit cell 2 is like unit cell 1 but with additional fuel surrounding the graphite stringer element to correctly represent the full-core moderator-to-fuel ratio ().
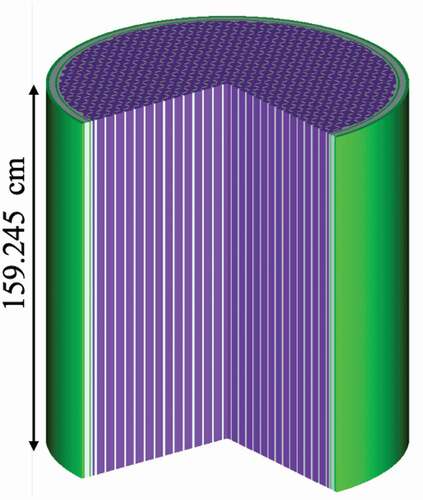
Simplified MSRE core 1 represents only the section with the straight graphite lattice (excluding the tapered top region and the lower lattices), without control rods or the sample basket ().
Simplified MSRE core 2 is like simplified core 1 but without the surrounding insulation, thermal shield, or shells ().
Fig. 7. SCALE model of an MSRE graphite stringer unit cell (unit cell 1).
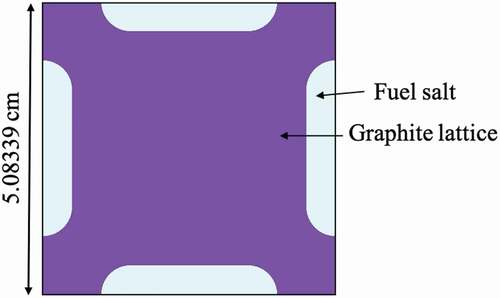
Fig. 8. SCALE model of an MSRE graphite stringer unit cell surrounded by fuel salt, resulting in the same moderator-to-fuel ratio as the full core (unit cell 2).
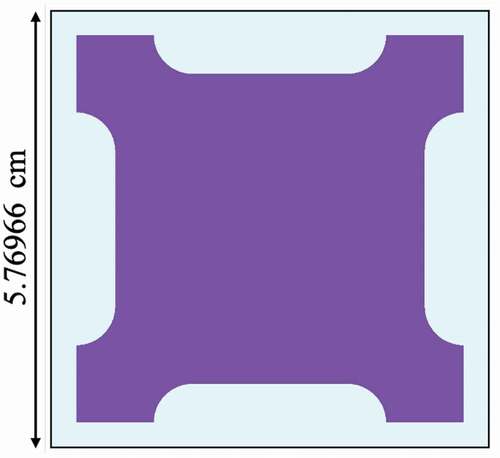
Fig. 9. Simplified SCALE model of the MSRE, showing only the straight section of the graphite lattice without control rods or sample basket (simplified core 1).
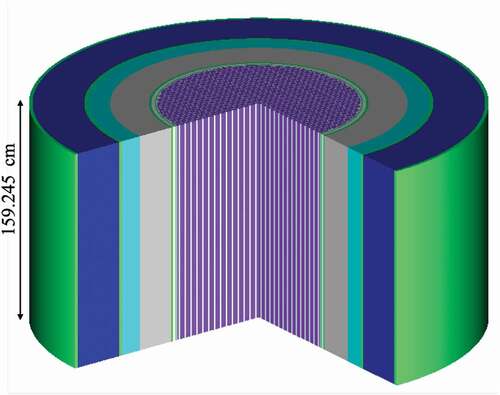
Fig. 10. Simplified SCALE model of the MSRE shown in without insulation, thermal shield, or shells (simplified core 2).
For the unit cells, reflective boundary conditions were applied in all directions. For the simplified core models, the same vacuum boundary conditions used for the original full core were applied on all outer boundaries.
The simplified models were developed to investigate whether any of the simplifications result in models that would be adequate for nuclear data performance assessments. Given that provides a measure of similarity between two systems considering their nuclear data sensitivities, a large value for
indicates that these two systems behave similarly with respect to changes in nominal nuclear data. Since
considers the similarity in terms of related nuclear data uncertainty, large values for
indicate a similar behavior of two systems with respect to changes in nuclear data uncertainties. If large values of
and/or
are obtained between a simplified model and the reference full-core model, it can be concluded that gaps in nuclear data or the impact of nuclear data uncertainties can be studied using this simplified model. The qualitative conclusions of the analysis of the simplified model would also be valid for the full core, thus offering the opportunity to study the impact nuclear data while avoiding large modeling efforts.
III.B. Data
III.B.1. Applied Nuclear Data
The Shift neutron transport calculations were performed using the ENDF/B-VII.0, ENDF/B-VII.1, and ENDF/B-VIII.0 CE cross-section libraries.23 For the uncertainty quantification, TSUNAMI applied the corresponding 44-group ENDF/B-VII.0–based, 56-group ENDF/B-VII.1–based, and 56-group ENDF/B-VIII.0–based covariance libraries. In this paper, the results of the similarity assessment are presented based only on ENDF/B-VII.1 libraries because the conclusions are the same when using different libraries.
SCALE’s covariance libraries contain data mainly from the indicated ENDF/B release, but they also contain (1) additional fission spectrum uncertainties from the JENDL 4.0 library,Citation24 (2) approximate uncertainties from the Low-fidelity Covariance Project,Citation25 and (3) approximate covariance data from the Working Party on International Nuclear Data Evaluation Cooperation Subgroup-26 (CitationRef. 26). More details on these libraries can be found in the SCALE manual.Citation3 The ENDF/B-VII.0 and ENDF/B-VII.1 cross-section and covariance libraries are available with the SCALE 6.2 release, and the ENDF/B-VIII.0 libraries will be available with SCALE 6.3.
III.B.2. Relevant Nuclear Data Updates in ENDF/B Releases
The capture cross section of carbon was significantly changed between the ENDF/B-VII.0 and ENDF/B-VII.1 release, which is important for calculations of any graphite-moderated systems. An impact of more than 1000 pcm on the eigenvalue was observed during the analysis of graphite-moderated, high-temperature gas-cooled reactor systems.Citation27 As shown, the ENDF/B-VII.1 calculations were in good agreement with measurements while the ENDF/B-VII.0 calculations showed a significant overestimation.
Another relevant update between the ENDF/B-VII.0 and ENDF/B-VII.1 release concerns the Li(n,t) cross section: The ENDF/B-VII.0 data provide a cross section almost twice as large as that in ENDF/B-VII.1 in the thermal energy range below 0.01 eV. Because of the significant neutron absorption through the 6Li(n,t) reaction, changing this cross section can significantly impact the eigenvalue. To avoid this known strong neutron absorption, even for small concentrations of
Li, MSRE’s fuel salt contains lithium with a
Li enrichment above 99.995%.
Prior to and including the ENDF/B-VII.1 release, available graphite evaluations considered graphite as a perfect crystal with respect to its thermal scattering cross sections. However, with the release of the ENDF/B-VIII.0 library, data for so-called reactor-grade graphite became available. In addition to an evaluation for graphite as a perfect crystal (i.e., 0% porosity), graphite evaluations assuming 10% and 30% porosity were made available.Citation28 Employing these new graphite evaluations in the analysis of a graphite-moderated, high-temperature gas-cooled reactor system resulted in a reactivity difference of several hundred pcm (CitationRef. 27). For adequate consideration of the porosity, detailed information about the graphite porosity is needed. However, the MSRE benchmark specifications do not provide any information on the porosity. Therefore, this study calculates the system keff with all available graphite evaluations to estimate their effect on the system eigenvalue. It is noted that this study estimates only the impact of porosity in the thermal scattering data. Thus, in these calculations, only the graphite thermal scattering data changed, but the graphite density (i.e., the nuclide density in atoms/b-cm) did not change. The porosity is assumed to indirectly affect the graphite density by decreasing their values, which is already accounted for by the graphite density specifications provided.
It shall be pointed out that thermal scattering data for the FLiBe salt are not available at this time. The impact of these data on reactivity can potentially be in the hundreds of pcm (CitationRef. 29). Also note that uncertainty data are not available for thermal scattering data in this salt, so uncertainty analyses do not include this potential source of uncertainty.
III.C. Performance
The full-core neutron transport calculations were performed with Shift using 700 active neutron generations with 100,000 neutrons/generation. One hundred generations were skipped to assure convergence of the fission source. Ten latent generations were used in the TSUNAMI-IFP calculations. Using two computing nodes with 16 Intel Xeon 2.30-GHz CPUs per node, the average computation time for one TSUNAMI calculation was 6 h and 20 min. The total memory required was approximately 376 GB distributed over both nodes. As mentioned above, the memory footprint per processor could be decreased even further through the use of additional processors.
IV. RESULTS
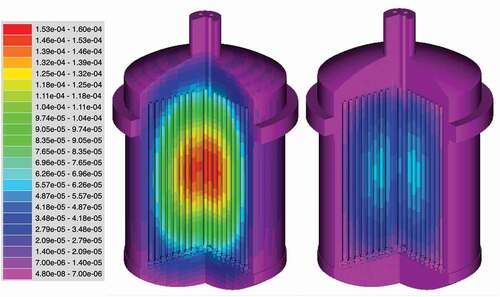
The results of the Shift Monte Carlo calculations and the TSUNAMI sensitivity and uncertainty analyses are presented in this section. To support the discussion of results, presents the energy-dependent flux distribution in different MSRE regions. The flux was obtained by overlaying a 3-D mesh on the MSRE geometry so that each 2.54-cm-high mesh cell contains one graphite stringer element in the x-y direction. The displayed fluxes present the flux per unit lethargy in individual graphite stringer elements at different radial locations at the core axial midline. shows the fast and thermal flux distribution in the core based on the same 3-D mesh. The flux in this plot is the flux per fission neutron divided by the mesh voxel volume.
Fig. 11. Neutron flux in a 252-group representation at the core axial midline, and different radial positions determined with SCALE/Shift.
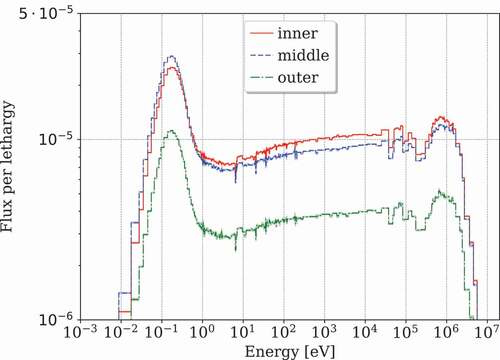
Fig. 12. Fast (left, E > 0.625 eV) and thermal (right, E < 0.625 eV) neutron flux in the fuel salt.
IV.A. Criticality
compares the eigenvalues calculated using different ENDF/B evaluations to the benchmark value and the Serpent benchmark result as determined by the University of California, Berkeley (UCB). Differences are provided in units of pcm, where 1 pcm = 0.00001.
TABLE II SCALE/Shift MSRE keff Results Compared to the Benchmark and the Reported Serpent Results
A difference of 230 pcm is observed between the ENDF/B-VII.1 Shift and Serpent results. This could be the result of small differences in the processing of the respective applied cross-section libraries, the cross-section temperature interpolation method, and/or modeling differences. Shen et al. showed that applying the graphite thermal scattering data at 800 or 1000 K instead of applying interpolated data to MSRE’s uniform temperature of 911 K can cause a difference of several hundred pcm (CitationRef. 13). Therefore, it is assumed that differences in temperature interpolation can cause a difference. Modeling differences can be caused by simplified modeling assumptions; the Serpent model of the benchmark was initially developed to include many details that were later simplified for the final benchmark specifications. Although the benchmark was well described in general, some minor information was missing, such as details on the end pieces of the control rods or other small elements.
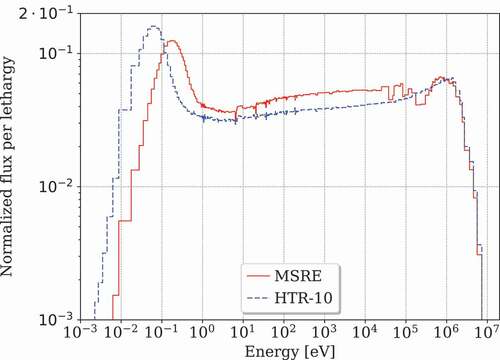
The ENDF/B-VII.0 and ENDF/B-VII.1 eigenvalues calculated with SCALE are consistent despite the discussed differences in the carbon capture cross section and Li(n,t) reaction. Large differences due to the carbon capture cross section update, which were observed for the small pebble-bed high-temperature gas-cooled reactor HTR-10 as reported in CitationRef. 27 were not seen here. The impact of this cross section is reduced in the MSRE case because of the different moderator-to-fuel ratio, the different fuel and moderator arrangement, and different material temperatures. The MSRE has a slightly harder neutron spectrum than the HTR-10 () and therefore a decreased sensitivity to nuclear data changes in the thermal energy range. Consistently, the sensitivity analysis in Sec. IV.B.2 shows that the eigenvalue sensitivity to graphite (n,γ) is -0.017 for MSRE (Sec. IV.B.2) as compared to -0.085 (i.e., five times higher) for HTR-10.
Fig. 13. Neutron flux in a 252-group representation compared between the MSRE and the HTR-10.
A 265 pcm eigenvalue difference was obtained between the ENDF/B-VII.1 and ENDF/B-VIII.0 calculations. Since only fresh fuel is considered here, it is likely that updates in the U and
U cross sections are the major cause of the observed differences based on previous studiesCitation27 and based on the sensitivity analysis in Sec. IV.B.2. For example, the neutron multiplicity and capture cross section of
U are different between these two ENDF/B evaluationsCitation30 and have the largest positive and negative sensitivities, respectively.
shows the impact of using graphite thermal scattering data with different porosities (0%, 10%, 30%) or carbon without thermal scattering data with ENDF/B-VIII.0. While the impact of the different graphite porosities is small [within two statistical standard deviations (2σ)], neglecting thermal scattering data leads to an eigenvalue increase of almost 300 pcm. The impact of the porosity is small compared to that seen in other studiesCitation27 because of the MSRE’s elevated temperature (911 K) and because of geometrical differences in the system with respect to the fuel and moderator.
TABLE III Effects of Graphite Porosity Evaluations on Calculated SCALE/Shift MSRE keff Results Using ENDF/B-VIII.0 Graphite Data
All calculations with SCALE or Serpent show large differences in the 2000 pcm range compared to the experimental benchmark eigenvalue. The (1σ) experimental eigenvalue uncertainty is given as 420 pcm and considers uncertainties in the geometry and material data. The graphite density, fuel salt density, and Li enrichment in the fuel salt are the main contributors to this uncertainty.Citation13 However, these uncertainties alone cannot explain the large difference between the calculations and the measurement. Given that the Serpent and SCALE models were developed independently in two different institutions and given that the Serpent model underwent multiple thorough reviews in the process of the development of the MSRE IRPhEP handbook specifications, it is assumed that the large differences to the experimental benchmark eigenvalue are not the result of modeling errors. Potential causes of the observed differences are listed in the following paragraph.
The authors of the benchmark specifications report several challenges when determining the dimensions and material compositions of this benchmark and when performing the initial Monte Carlo criticality calculations with Serpen:tCitation13
Despite an abundance of blueprints and design documents about the MSRE, it was not clear if any changes were introduced during the actual reactor construction.
Because the documented dimensions are provided for conditions at room temperature, the authors had to account for thermal expansion, using a uniform temperature of 911 K during the experiment.
Discrepancies with respect to the fuel salt compositions were found. In the Serpent test calculations, the authors found that the use of the different available fuel salt compositions could cause an eigenvalue bias of up to 450 pcm.
With respect to nuclear data, the negligence of the salt’s thermal scattering could lead to a bias of a few hundred pcm, as demonstrated by Mei et al.Citation29 The impact of limited knowledge of the available nuclear data is investigated in terms of uncertainty analyses in the following sections.
IV.B. Sensitivity Analysis
IV.B.1. Verification of Integrated Eigenvalue Sensitivities
Independent of the underlying method applied, the results of every TSUNAMI calculation always needs to be confirmed through DP calculations. In the first step, the top energy-integrated eigenvalue sensitivity coefficients (i.e., total reaction of nuclides) are identified from the TSUNAMI results. In the second step, a set of criticality calculations is performed for (1) the nominal case, (2) a perturbed case in which the density of the nuclide of interest is increased by a specific amount, and (3) a perturbed case in which the density of the nuclide of interest is decreased by the same specific amount. The sensitivity coefficient can then be manually calculated from the DP results. The density perturbations can be repeated for different amounts of perturbation to improve the statistics.
presents the comparison between the TSUNAMI and DP calculations. The eigenvalue sensitivities were confirmed for the top six energy-integrated total sensitivity coefficients; the number of latent generations (ten) in the TSUNAMI-IFP calculation was confirmed to be sufficient.
TABLE IV keff Sensitivities Obtained Using Direct Perturbation Compared to Corresponding TSUNAMI Results Using ENDF/B-VII.1 Data
IV.B.2. Top Eigenvalue Sensitivities
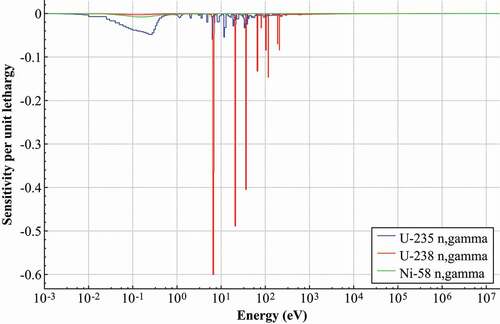
shows the top (energy-, region-, and mixture-) integrated eigenvalue sensitivities by nuclide. Since the differences of the sensitivity results between the different ENDF/B libraries are negligible, only the ENDF/B-VII.1 results are presented. also provides the top (energy-, region-, and mixture-) integrated eigenvalue sensitivities by nuclide reaction.
TABLE V Top Ten Positive and Top Ten Negative keff Sensitivity Coefficients by Nuclide Determined Using TSUNAMI with ENDF/B-VII.1 Data
TABLE VI Top Ten Positive and Top Ten Negative keff Sensitivity Coefficients Determined Using TSUNAMI with ENDF/B-VII.1 Data
The eigenvalue of the MSRE is most sensitive to the graphite, U,
F, and
U cross sections. With respect to graphite and
F, the elastic scattering reaction is the major cause of the large sensitivity. The sensitivity of
U is the result of a positive sensitivity to the fission reaction and the neutron multiplicity
in the thermal region () and the negative contribution of the neutron capture reaction. The negative sensitivity to
U is the result of the neutron capture in the resonance region (). The sensitivity to
Li elastic scattering and capture is also noteworthy as well as the
Li(n,t) reaction despite the very small abundance in the fuel salt.
Fig. 14. Positive top three keff sensitivities.
Fig. 15. Negative top three keff sensitivities.
IV.C. Uncertainty Quantification
presents MSRE’s eigenvalue uncertainty due to nuclear data as calculated using different covariance libraries. The relative uncertainty was found to be between 0.6% and 0.7% (i.e., between 615 and 700 pcm). A small difference of the total uncertainty is observed when using the different ENDF/B libraries. When using different graphite evaluations of ENDF/B-VIII.0, only a negligible effect is observed due to small changes in the graphite elastic scattering contribution.
TABLE VII Relative keff Uncertainties σk,rel due to Nuclear Data Uncertainties Determined with TSUNAMI
compares the top contributing covariance matrices to the determined uncertainties. The most relevant contributors are the neutron multiplicity of U, the elastic scattering of graphite, and the neutron capture of
Li. The uncertainty of
U
changed significantly between the different evaluations (); the increase of this uncertainty in ENDF/B-VIII.0 is clearly visible in the list of individual contributions, leading to an increase to a contribution of ~0.46% from these data alone. The uncertainty of graphite elastic scattering also changed significantly in ENDF/B-VIII.0 (); the increase in the thermal and intermediate-energy region is especially important as it leads to an increase from ~0.26% to ~0.48% of a contribution to the eigenvalue uncertainty. In contrast, the
Li capture reaction had a similar value. The uncertainty of other relevant reactions such as
U neutron capture () decreased in ENDF/B-VIII.0 and thereby compensated the increases for
U
and graphite elastic scattering.
TABLE VIII Top Contributors to the keff Uncertainty Compared Between the TSUNAMI Calculations with Different Libraries
Fig. 16. Uncertainty of 235U ν̅.
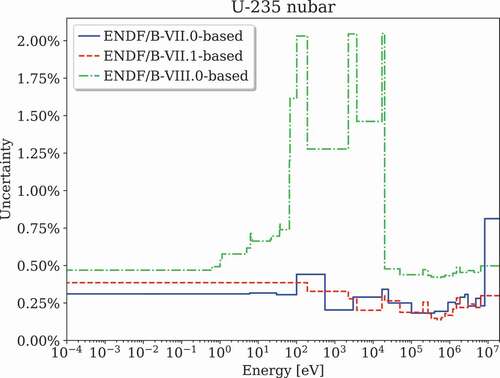
Fig. 17. Uncertainty of graphite elastic scattering. (ENDF/B-VII.0 and ENDF/B-VII.1 contain natural carbon data while ENDF/B-VIII.0 contains isotopic data for 12C and 13C).
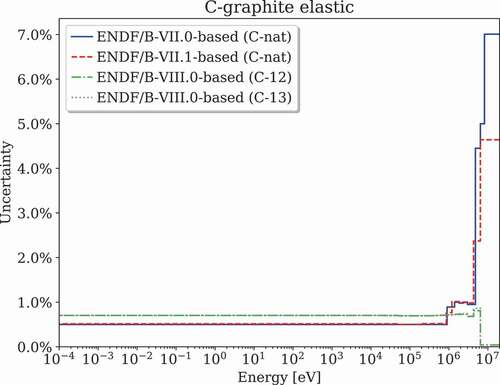
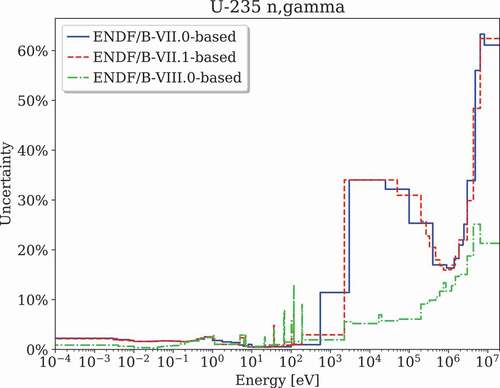
Fig. 18. Uncertainty of 235U n,γ.
The uncertainties and top contributors to the uncertainties observed here agree well with similar analyses performed for molten salt systems.Citation5 The eigenvalue uncertainties are in a similar range, and the same top contributing reactions to this uncertainty were identified. The order of the top contributors can show differences due to differences in the materials, geometries, and neutron spectra of the investigated systems. However, the same reactions were identified to be relevant for this type of reactor system. It is also worth noting that U
and neutron capture reactions in uranium are commonly identified as top contributors in uncertainty analysis of LWR systemsCitation31 and that the relevance of elastic scattering and neutron capture of graphite is identified in studies with graphite-moderated systems.Citation32,Citation33
IV.D. Similarity Assessment with VALID
The calculation of the similarities in terms of and
between the MSRE and all experiments within VALID (CitationRefs. 4 and Citation22) revealed that VALID does not currently include criticality experiments that are similar to the MSRE. With values at around 0.6, the largest
were found for the thermal spectrum experiments with high- and low-enriched uranium, both with fuel in compound and solution form (HEU-SOL-THERM, LEU-COMP-THERM, and LEU-SOL-THERM). The value
is below 0.3 for all other experiments within VALID. This result shows that for a molten salt reactor such as the MSRE, available validation data are very limited. Moreover, this stresses that the addition of the MSRE to the IRPhEP handbook is particularly valuable as the data can be used to expand the validation basis of simulation codes like SCALE. However, it should also be mentioned that for this experiment, only the measured eigenvalue is available. Validation in terms of reactor physics requires a more comprehensive set of measured quantities.
IV.E. Similarity Assessment with Simplified Models
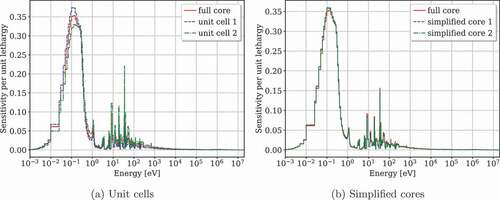
The similarity assessment of the MSRE core and the simplified MSRE models revealed that unit cells show a large similarity with the full-core model in terms of (see ). However, when investigating the similarity with respect to uncertainties, the correlation index
shows values far away from 1.0. Although the simplified unit cells, in particular unit cell 2, represent the main components of the reactor, the small geometry with reflective boundary conditions is not representative of the full core. Missing leakage effects cause differences in the neutron spectrum; in particular, they cause a different ratio of thermal-to-fast flux, which comprises the major cause of these differences (). This conclusion is confirmed by comparing the top eigenvalue sensitivity coefficients () and the top contributors to the eigenvalue uncertainty () between the unit cells and the full-core model. While good agreement is obtained for the top contributor
U, large differences and a different ranking is obtained for many other relevant reactions. Furthermore, show significant differences for relevant sensitivity profiles. It has to be noted that the similarity of the unit cells with the MSRE core might be larger if the leakage effect were taken into account in the neutron transport calculation, for example, through the consideration of a critical spectrum and/or leakage effects during the self-shielding. However, the TSUNAMI implementation in SCALE does not currently permit such modifications.
TABLE IX Similarity Assessment Results Between the MSRE and Simplified MSRE Models for Integral Indices E and ck
TABLE X Top Five keff Sensitivity Coefficients of the Simplified MSRE Models Compared to the Full-Core Reference Determined Using TSUNAMI with ENDF/B-VII.1 Data
TABLE XI Top Five Contributors to the keff Uncertainty of the Simplified MSRE Models Compared to the Full-Core Reference Determined Using TSUNAMI with ENDF/B-VII.1 Data
Fig. 19. Neutron flux in the simplified models compared to the full core (1σ statistical uncertainty indicated as shaded regions only slightly wider than the lines).
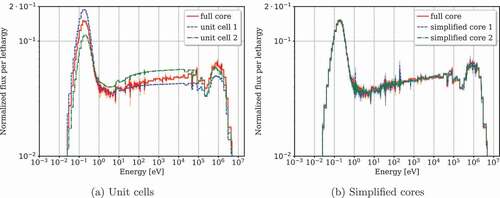
Fig. 20. The keff sensitivity to 235U (n,γ) in the simplified models compared to the full core.
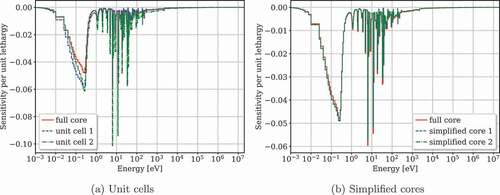
Fig. 21. The keff sensitivity to 235U in the simplified models compared to the full core.
In contrast to the unit cells, the similarity assessment of the simplified core models and the full-core model shows values very close to 1.0 for both and
. This conclusion is confirmed by the good agreement of the eigenvalue sensitivities and the contributions to the eigenvalue uncertainty between the simplified core models and the full MSRE core model. It indicates that it is not necessary to model the full MSRE core with all its details for basic nuclear data assessments. Simplified core models—which disregard some of the details that involve substantial modeling effort and for which a reduced computation time can be achieved (in this case, 9% to 12% of a decrease)—can be used to study and reveal nuclear data aspects such as gaps in nuclear data or relevant nuclear data uncertainties.
V. CONCLUSION
This paper presents the initial calculations of the MSRE using the SCALE code system. These calculations were based on the recent addition of the zero-power first critical experiment with U in the IRPhEP handbook. Criticality calculations were performed using SCALE’s new Monte Carlo code Shift, and nuclear data sensitivity and uncertainty analyses were performed with SCALE’s TSUNAMI code. All simulations were performed with the three most recent ENDF/B nuclear data library releases to discern the impact of updates in the nominal cross sections and the corresponding covariance data on the calculated results.
The eigenvalues obtained with the ENDF/B-VII.0, ENDF/BVII.1, and ENDF/BVIII.0 libraries only spread over approximately 230 pcm. Since the MSRE’s eigenvalue sensitivity is dominated by U neutron multiplicity and neutron capture and graphite elastic scattering, relevant changes in the ENDF/B libraries for nuclear reactions such as carbon capture, which caused large differences in other graphite-moderated systems, did not have a visible influence. Uncertainties in the nuclear data led to eigenvalue uncertainties between 615 and 700 pcm. The major contributors to these uncertainties were
U neutron multiplicity, graphite elastic scattering, and
Li neutron capture.
When using consistent ENDF/B library releases, the eigenvalue obtained with Shift resulted in reasonable agreement with the Serpent calculation for the benchmark. However, all calculations resulted in large differences of 2000 pcm compared to the experimental eigenvalue. Possible causes of these differences include material and geometrical uncertainties; differences in the available fuel salt composition as compared to the actual experimental setup; uncertainties due to nuclear data; gaps in the nuclear data such as missing thermal scattering data for the salt; and potential approximations in the applied methods, including temperature interpolation of the nuclear data. However, it is not clear whether the listed reasons are responsible for the entire difference between the calculations and the measurement or if there are other aspects that have not yet been considered.
In similarity assessments using sensitivity profiles determined with TSUNAMI, large similarities in terms of two correlation coefficients were found between the full MSRE core model and simplified models of the full core that disregard modeling details such as the detailed bottom and top regions of the graphite lattice. Large correlation coefficients indicate that the impacts of changes in nominal nuclear data and nuclear data uncertainties are very similar in the simplified models as compared to the full-core model. Consequently, basic nuclear data performance assessments such as identification of gaps or large uncertainties can be performed using simplified MSRE core models.
The SCALE model developed for the MSRE benchmark provides the basis for future studies to address further nuclear data performance assessments, characterization of key safety and performance metrics, and the determination of in-core material inventories as the basis for analysis of severe accident scenarios.
Acknowledgments
This work was funded by the U.S. Nuclear Regulatory Commission. The continuous technical support received from Don Algama and Tim Drzewiecki is especially appreciated. This paper has been authored by UT-Battelle, LLC, under contract DE-AC05-00OR22725 with the U.S. Department of Energy. This work was supported by the U.S. Nuclear Regulatory Commission [IAA 31310019N0009]; U.S. Nuclear Regulatory Commission [IAA 31310019N0008]; U.S. Nuclear Regulatory Commission [IAA 31310019N0012 M0002].
References
- R. C. ROBERTSON, “MSRE Design and Operations Report Part I: Description of Reactor Design,” ORNL-TM-0728, Oak Ridge National Laboratory (1965).
- D. SHEN et al., “Molten-Salt Reactor Experiment (MSRE) Zero-Power First Critical Experiment with U-235,” MSRE-MSR-EXP-001, Organisation for Economic Co-operation and Development, Nuclear Energy Agency (2019).
- “SCALE Code System, Version 6.2.4,” ORNL/TM-2005/39, W. A. WIESELQUIST, R. A. LEFEBVRE, and M. A. JESSEE, Eds., Oak Ridge National Laboratory (2020); https://www.ornl.gov/file/scale-62-manual/display.
- E. M. SAYLOR et al., “Criticality Safety Validation of SCALE 6.2.2,” ORNL/TM-2018/884, Oak Ridge National Laboratory (2018); https://www.osti.gov/servlets/purl/1479759.
- J. J. POWERS et al., “Sensitivity/Uncertainty Analyses Comparing LR-0 Reactor Experiments Containing FLiBe Salt with Models for Molten-Salt-Cooled and Molten-Salt-Fueled Reactors,” Ann. Nucl. Energy, 120, 319 (2018); https://doi.org/https://doi.org/10.1016/j.anucene.2018.05.052.
- F. BOSTELMANN et al., “Nuclear Data and Benchmarking Program: Nuclear Data Performance Assessment for Advanced Reactors,” ORNL/TM-2018/1033, Oak Ridge National Laboratory (2019); http://www.osti.gov/servlets/purl/1506806/.
- B. R. BETZLER et al., “Fuel Cycle Analysis of Thermal and Fast Molten Salt Reactors,” Proc. GLOBAL Int. Fuel Cycle Conf., Seoul, Korea, September 24–29, 2017.
- B. R. BETZLER et al., “Implementation of Molten Salt Reactor Tools in SCALE,” Proc. Int. Conf. Mathematics and Computational Methods Applied to Nuclear Science & Engineering (M&C 2017), Jeju, Korea, April 16–20, 2017.
- T. M. PANDYA et al., “Implementation, Capabilities, and Benchmarking of Shift, a Massively Parallel Monte Carlo Radiation Transport Code,” J. Comput. Phys., 308, 239 (2016); https://doi.org/https://doi.org/10.1016/j.jcp.2015.12.037.
- B. T. REARDEN et al., “Sensitivity and Uncertainty Analysis Capabilities and Data in SCALE,” Nucl. Technol., 174, 2, 236 (2011); https://doi.org/https://doi.org/10.13182/NT174-236.
- D. SHEN et al., “Zero-Power Criticality Benchmark Evaluation of the Molten Salt Reactor Experiment,” Proc. PHYSOR 2018, Cancun, Mexico, April 22–26, 2018, p. 4012 (2018).
- M. FRATONI et al., “Molten Salt Reactor Experiment Benchmark Evaluation,” DOE-UCB-8542, 16-10240, University of California, Berkeley (2020); https://doi.org/https://doi.org/10.2172/1617123.
- D. SHEN et al., “Reactor Physics Benchmark of the First Criticality in the Molten Salt Reactor Experiment,” Nucl. Sci. Eng., 195, 825 (2021); https://doi.org/https://doi.org/10.1080/00295639.2021.1880850.
- J. LEPPÄNEN, “Development of a New Monte Carlo Reactor Physics Code,” PhD Thesis, Helsinki University of Technology, Finland (2007); http://montecarlo.vtt.fi/download/P640.pdf.
- P. N. HAUBENREICH and J. R. ENGEL, “Experience with the Molten-Salt Reactor Experiment,” Nucl. Appl. Technol., 8, 2, 118 (1970); https://doi.org/https://doi.org/10.13182/nt8-2-118.
- M. L. WILLIAMS, “Perturbation Theory for Nuclear Reactor Analysis,” Handbook of Nuclear Reactors Calculations, Volume III, pp. 63–188, Y. RONEN, Ed., CRC Press.
- B. L. BROADHEAD et al., “Sensitivity- and Uncertainty-Based Criticality Safety Validation Techniques,” Nucl. Sci. Eng., 146, 3, 340 (2004); https://doi.org/https://doi.org/10.13182/NSE03-2.
- B. C. KIEDROWSKI, F. B. BROWN, and P. P. H. WILSON, “Adjoint-Weighted Tallies for k-Eigenvalue Calculations with Continuous-Energy Monte Carlo,” Nucl. Sci. Eng., 168, 3, 226 (2011); https://doi.org/https://doi.org/10.13182/NSE10-22.
- C. M. PERFETTI, B. T. REARDEN, and W. R. MARTIN, “SCALE Continuous-Energy Eigenvalue Sensitivity Coefficient Calculations,” Nucl. Sci. Eng., 182, 3, 332 (2016); https://doi.org/https://doi.org/10.13182/NSE15-12.
- K. B. BEKAR et al., “Iterated Fission Probability Sensitivity Capability in SCALE via Shift,” ORNL/TM-2020/4, Oak Ridge National Laboratory (2019); https://www.ornl.gov/file/iterated-fission-probability-sensitivity-capability-scale-shift/display.
- “International Handbook of Evaluated Criticality Safety Benchmark Experiments,” NEA-1486/18, Organisation for Economic Co-operation and Development, Nuclear Energy Agency (2020).
- W. J. MARSHALL and B. T. REARDEN, “The SCALE Verified, Archived Library of Inputs and Data – VALID,” Proc. Topl. Mtg. NCSD 2013, Wilmington, North Carolina, September 29–October 3, 2013, p. 319, American Nuclear Society (2013).
- M. B. CHADWICK et al., “ENDF/B-VII.1 Nuclear Data for Science and Technology: Cross Sections, Covariances, Fission Product Yields and Decay Data,” Nucl. Data Sheets, 112, 12, 2887 (2011); https://doi.org/https://doi.org/10.1016/j.nds.2011.11.002.
- K. SHIBATA et al., “JENDL-4.0: A New Library for Nuclear Science and Engineering,” J. Nucl. Sci. Technol., 48, 1, 1 (2012); https://doi.org/https://doi.org/10.1080/18811248.2011.9711675.
- R. C. LITTLE et al., “Low-Fidelity Covariance Project,” Nucl. Data Sheets, 109, 12, 2828 (2008); https://doi.org/https://doi.org/10.1016/j.nds.2008.11.018.
- M. SALVATORES and R. JACQMIN, “International Evaluation Co-Operation, Volume 26, Uncertainty and Target Accuracy Assessment for Innovative Systems Using Recent Covariance Data Evaluations,” NEA/WPEC-26, Organisation for Economic Co-operation and Development, Nuclear Energy Agency (2008); https://oecd-nea.org/download/wpec/volume26/volume26.pdf.
- F. BOSTELMANN et al., “SCALE Capabilities for High Temperature Gas-Cooled Reactor Analysis,” Ann. Nucl. Energy, 147, 107673 (2020); https://doi.org/https://doi.org/10.1016/j.anucene.2020.107673.
- A. I. HAWARI and V. H. GILLETE, “Inelastic Thermal Neutron Scattering Cross Sections for Reactor-Grade Graphite,” Nucl. Data Sheets, 118, 1, 176 (2014); https://doi.org/https://doi.org/10.1016/j.nds.2014.04.030.
- L. MEI et al., “The Investigation of Thermal Neutron Scattering Data for Molten Salt Flibe,” J. Nucl. Sci. Technol., 50, 7, 682 (2013); https://doi.org/https://doi.org/10.1080/00223131.2013.785283.
- F. BOSTELMANN, G. ILAS, and W. A. WIESELQUIST, “Key Nuclear Data Impacting Reactivity in Advanced Reactors,” ORNL/TM-2020/1557, Oak Ridge National Laboratory (2020); https://info.ornl.gov/sites/publications/Files/Pub140896.pdf.
- D. ROCHMAN et al., “Nuclear Data Uncertainties for Typical LWR Fuel Assemblies and a Simple Reactor Core,” Nucl. Data Sheets, 139, 1, 1 (2017); https://doi.org/https://doi.org/10.1016/j.nds.2017.01.001.
- F. BOSTELMANN and G. STRYDOM, “Nuclear Data Uncertainty and Sensitivity Analysis of the VHTRC Benchmark Using SCALE,” Ann. Nucl. Energy, 110, 317 (2017); https://doi.org/https://doi.org/10.1016/j.anucene.2017.06.052.
- G. STRYDOM, “Consistent Multi-Scale Uncertainty Quantification Methodology for Multiphysics Modeling of Prismatic HTGRs,” PhD Thesis, North-West University (2020); http://repository.nwu.ac.za/handle/10394/36533.