
 ?Mathematical formulae have been encoded as MathML and are displayed in this HTML version using MathJax in order to improve their display. Uncheck the box to turn MathJax off. This feature requires Javascript. Click on a formula to zoom.
Abstract
Kilowatt Reactor Using Stirling TechnologY (KRUSTY) was a prototype for the U.S. National Aeronautics and Space Administration’s Kilopower Program. KRUSTY has a highly enriched uranium–molybdenum alloy (with 7.65 wt% molybdenum) annular core reflected by beryllium oxide with an outer stainless steel shield. Five configurations from the experimental campaign were chosen to be evaluated as benchmark cases. Uncertainties were evaluated in five categories: (1) criticality measurement, (2) mass and density, (3) dimensions, (4) material compositions, and (5) positioning. The largest contribution to the overall uncertainty in each case was from the radial alignment of the movable platen. A simplified model was created to increase computational efficiency, and an average bias of –16 pcm was calculated due to the simplifications. Sample calculations were completed for each case using MCNP6.2, COG, and MC21, all with ENDF/B-VIII.0 nuclear data. For MCNP6.2, the average difference (absolute value) between the calculated and experimental keff for the five configurations was 14 pcm for both the detailed and the simplified models. The keff results from all three codes are within 1σ of the benchmark values. KRUSTY’s value as a benchmark is due to its sensitivity to beryllium and molybdenum. For beryllium, KRUSTY adds an 18th benchmark with a total cross-section sensitivity greater than 0.05%/%/(unit lethargy). For molybdenum, KRUSTY adds a 9th benchmark with a total cross-section sensitivity greater than 0.004%/%/(unit lethargy).
I. INTRODUCTION
Recent advances in nuclear reactor technology have been focused on making smaller and smaller reactors. The majority of these advances have been directed toward the development of small modular reactors (SMRs), which typically produce power in the range of 100 to 300 MW(electric). The general purpose for these reactors is to provide power to smaller markets. SMRs are projected to be more economical, safer, and easier to build than full-scale light water reactors.Citation1
More recently, researchers have been looking at the possibility of making even smaller reactors, in the range of 1 to 20 MW(thermal). These microreactors have been designed to be fully contained and, ideally, built in a factory-type setting for ease of deployment and transport.Citation2–4 Many diverse applications have been proposed for microreactors, including powering remote locations in Alaska and Canada, powering islands and coastal areas affected by natural disasters, and powering a colony on the surface of the moon or Mars.Citation5–9
With this last goal in mind, the U.S. National Aeronautics and Space Administration (NASA) teamed with the U.S. National Nuclear Security Administration (NNSA) to design a microreactor for space applications. This resulted in the prototype and proof-of-concept assembly named Kilowatt Reactor Using Stirling TechnologY (KRUSTY).Citation10 Component manufacturing and dry fitting of KRUSTY began in the summer of 2017. Finally, KRUSTY was fully assembled, and experiments were conducted from November 2017 to March 2018.
The KRUSTY experiments were conducted across four phases: component critical, cold critical, warm critical, and high temperature.Citation11–14 The component critical phase was used to determine the reactivity worth of various components using a simplified version of KRUSTY. Upon completion of the first phase, the cold critical phase was conducted to confirm the reactivity worth of the same components when the full version of KRUSTY was assembled. The warm critical phase consisted of three free runs at 15 ¢, 30 ¢, and 60 ¢ of reactivity. These free runs were used to validate the results of the reactor physics codes, which had to be confirmed before the project could move forward into phase four. The high-temperature demonstration conducted during phase four was a full-powered test that ran for an uninterrupted 28 h, with temperatures reaching 800°C.
The KRUSTY benchmark summarized in this paper includes 5 configurations selected from the 60 total configurations completed during the component critical experiments phaseCitation15 (of those 60, 59 were at or above criticalCitation11). This phase was performed at the National Criticality Experiments Research Center (NCERC) between November 2017 and February 2018. Preliminary results from the benchmark have been reported previously.Citation16–18 This paper summarizes the experimental configurations, experimental uncertainties, benchmark model simplifications and bias, and sample calculations from the approved International Criticality Safety Benchmark Evaluation Project (ICSBEP) benchmark evaluation of the KRUSTY component critical experiments.Citation15,Footnotea The benchmark evaluation of KRUSTY is important to the microreactor design community as it provides detailed results on novel materials and designs that are being considered for commercial use.
This paper is organized as follows. Section II presents an overview of the KRUSTY assembly. Section III discusses the experimental configurations used in the benchmark. Section IV provides a discussion on the uncertainty evaluation procedure. Section V discusses the simplified model. The experimental keff and benchmark keff are presented in Sec. VI. The results of sample calculations are provided in Sec. VII. Section VIII presents the cross-section sensitivities and discusses why KRUSTY is a much-needed benchmark. Last, Sec. IX provides the summary and conclusions.
II. KRUSTY ASSEMBLY OVERVIEW
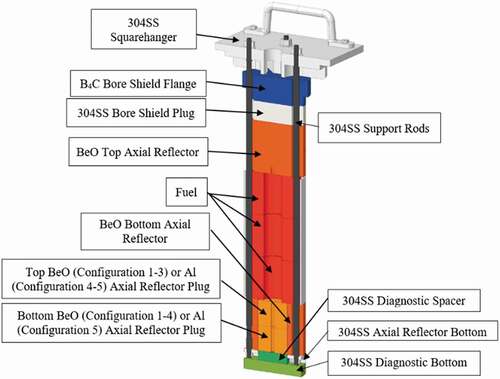
A rendering of the KRUSTY component critical assembly is shown in , and an axial cross section of the central core column is provided in . KRUSTY’s core is created from three annular pieces of highly enriched uranium alloyed with an average of 7.65 wt% molybdenum (U-7.65Mo). The U-7.65Mo core, which was enriched to 93.1 wt% 235U, had a total mass of 32.200 kg and an average density of 17.34 g/cm3. The total core height was 25.00122 cm (9.843 in.) with an outer diameter of 10.99820 cm (4.330 in.) and inner diameter of 3.98780 cm (1.570 in.). The core pieces also had eight slots on the outer edge at 45-deg angles that would contain heat pipes in the later phases of the KRUSTY experimental campaign. In the component critical phase discussed here, four of the slots contained stainless steel support rods. The entire central core column was suspended from the upper shields via the support rods, as shown in .
Fig. 1. Axial cross section of KRUSTY assembly.
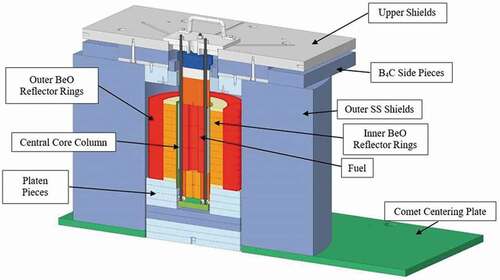
Fig. 2. Axial cross section of KRUSTY’s central core column.
Surrounding the core was an annular beryllium oxide (BeO) reflector assembly with an inner diameter of 14.48562 cm (5.703 in.) and a radial thickness of 11.80719 cm (4.6485 in.). As shown in , this assembly actually comprised two rings with the outer ring composed of four interlocking pieces. The height of the BeO reflector rings was varied by adding or removing pieces from the top. The individual rings came in thicknesses of 2.54 cm (1.000 in.), 0.635 cm (0.250 in.), and 0.3175 cm (0.125 in.). In the configurations evaluated, the height varied from 28.62834 to 29.26334 cm (11.271 to 11.521 in.). The individual masses and dimensions of each ring can be found in Sec. I of the KRUSTY benchmark evaluation.Citation15
Outside the BeO reflector rings was a cylindrical stainless steel ring shield called the outer stainless steel shield, which was composed of four large stainless steel pieces. This ring had an inner radius of 20.48002 cm (8.063 in.), a radial thickness of 30.48000 cm (12.000 in.), and a height of 63.10630 cm (24.845 in.). This ring acted not only as the largest radiation shield in the assembly but also as the last layer of reflection.
In addition to the aforementioned major components, other smaller components located above and below the fuel were included in the KRUSTY central core assembly. These components included axial reflectors and shields made of aluminum, BeO, boron carbide (B4C), and stainless steel. The components were part of the central core column and were suspended along with the fuel ().
The lower shielding assembly was placed beneath the BeO reflector rings and was composed of nine circular plates placed on the movable platen (). The two center shields were composed of B4C, and the other seven shields were manufactured from stainless steel. All of these shields had an outer diameter of 39.6875 cm (15.625 in.), and the top four shields had an inner diameter of 14.2875 cm (5.625 in.) to allow the shielding assembly to wrap around the bottom of the central core column. All of the shielding plates in the lower shielding assembly had a thickness of 2.54 cm (1.000 in.).
The remainder of the shielding assembly was stacked on top of the outer stainless steel shields. These shields were B4C plates sandwiched between stainless steel plates. The lower stainless steel shield plate was a rectangular plate with dimensions of 76.2 63.5
1.27 cm (30.00
25.00
0.50 in.) with a central hole of diameter 20.955 cm (8.250 in.). The upper stainless steel shield plate was a rectangular plate with dimensions of 93.98
76.2
3.81 cm (37.00
30.00
1.50 in.) with the same size hole. The B4C shielding in the center was composed of three pieces: a main shield and two side pieces. The main shield was a rectangular plate with dimensions of 76.2
63.5
5.08 cm (30.00
25.00
2.00 in.)with the same size hole as the steel plates, and the side pieces were 76.2
15.24
5.08 cm (30.00
6.00
2.00 in.). The hole in the center of the upper assembly was added to allow the central core column to be dropped into the KRUSTY assembly and anchored to the top of the upper shielding assembly.
KRUSTY was installed on the Comet vertical-lift machine. Criticality was achieved by lifting the platen and BeO reflector rings into position around the suspended central core column. A more thorough and detailed description of KRUSTY is available in the benchmark evaluation.Citation15
III. EXPERIMENTAL CONFIGURATIONS
The five configurations evaluated in the benchmark differed in the reflecting material at the bottom of the central core column and the height of the BeO reflector ring. Two configurations also had an AmBe neutron source in the middle of the fuel. The full breakdown of the experimental configurations as well as the date they were performed and the measured reactor period are presented in . The reported reactor period measurements are the average of three compensated ion chambers (referred to as linears since they display data on a linear scale), each located at least 3 m from the assembly, and the reactivity was calculated based on the Inhour equation, the delayed neutron data for 235U fast fission as given by Keepin,Citation19 and the measured prompt neutron decay constant.Citation20 A lengthy discussion regarding the applicability and associated uncertainty analysis of using Keepin’s delayed neutron data can be found in Sec. 2.1 of the KRUSTY benchmark evaluation.Citation15
TABLE I Parameters of Evaluated Benchmark Configurations
IV. EVALUATION OF UNCERTAINTIES
The sensitivity effects for the five configurations were evaluated using the Monte Carlo N-ParticleFootnoteb ® (MCNP®) code version 6.2.0 and ENDF/B-VIII.0 neutron cross-section libraries, including thermal scattering [S(α,β)] data for Be in BeO and for O in BeO (CitationRefs. 21 through 24). Calculations used 1 000 000 histories per cycle with 1200 active cycles and 50 inactive cycles, which resulted in a 1σ statistical uncertainty of ±0.00002.
For some parameters, the standard uncertainty in keff, uk,i, due to uncertainty in parameter i with reference value xi,0, was calculated as the difference between the perturbed values of keff divided by the number of standard deviations:
where ui is the standard uncertainty in the parameter being perturbed and δxi is the value of the perturbation. The scaling factor 2δxi/ui is the range of the positive and negative perturbations in units of standard deviations of the parameter xi (in other words, the number of standard deviations by which xi,0 was perturbed). The difference in EquationEq. (1)(1)
(1) is given as ∆keff in the uncertainty tables in the benchmark evaluation.Citation15 Sensitivity effects are judged to be negligible when the calculated value of ∆keff is within the Monte Carlo uncertainty (usually ±0.00003). In addition, if uk,i is less than 0.000005, the effect is also judged to be negligible (regardless if |∆keff| > 0.00002).
EquationEquation (1)(1)
(1) is an uncertainty multiplied by a central-difference approximation of a derivative, which can be written
EquationEquations (1)(1)
(1) and (Equation2
(2)
(2) ) can also be written
where [in the notation of EquationEq. (1
(1)
(1) )] and
is the relative sensitivity of keff with respect to xi, defined by
For some parameters, the relative sensitivity of EquationEq. (4)
(4)
(4) can be computed using adjoint methods. Whenever adjoint-based derivatives were available, EquationEq. (3)
(3)
(3) was used for the uncertainties. If uk,i is less than 0.000005, the uncertainty is judged to be negligible.
Uncertainties were evaluated in five categories: (1) criticality measurement, (2) mass and density, (3) dimensions, (4) material compositions, and (5) positioning. Uncertainties in category 1 were evaluated using the reproducibility of the experiments and the uncertainties in the nuclear data used to infer keff from the measurements. Uncertainties in categories 2 and 4 were evaluated using first-order adjoint-based sensitivity analysis using EquationEqs. (3)(3)
(3) and (Equation4
(4)
(4) ) (CitationRef. 25). Uncertainties in categories 3 and 5 were evaluated using first-order finite difference–based sensitivity analysis, otherwise known as direct perturbations or brute force, using EquationEq. (1)
(1)
(1) .
The largest and total uncertainties (not necessarily in each category) for Cases 1 through 5 are listed in through VI, respectively. Uncertainty contributions greater than 0.00008 in magnitude are listed. The relative uncertainties given for the standard keff uncertainties were propagated from Monte Carlo statistical uncertainties. The total asymmetric uncertainty was approximated by adding the symmetric uncertainties in quadrature with the positive and negative contributions, as appropriate. Interesting conclusions from the uncertainty analysis are summarized in Secs. IV.A and IV.B.
TABLE II Largest Uncertainties for Case 1
TABLE III Largest Uncertainties for Case 2
TABLE IV Largest Uncertainties for Case 3
TABLE V Largest Uncertainties for Case 4
TABLE VI Largest Uncertainties for Case 5
IV.A. Positioning Uncertainty Dominates and Leads to Asymmetric Uncertainty Bounds
Four of the top eight contributions to the total uncertainty are due to positioning uncertainty, including gaps. The largest uncertainty in each case was due to the platen radial alignment. The platen is designed to be centered radially, i.e., aligned on the assembly axis. Misalignment in any radial direction causes an increase in keff. Thus, uncertainty in the platen location leads to a one-sided uncertainty in keff. The distance that the platen could travel in the radial direction before contacting another part is 0.25 in. This was taken as a bounding uncertainty for the platen radial misalignment. It is a large value, and the assembly is sensitive to the location of the platen. The gap was needed to ensure that the experiment could be assembled without friction between the stationary and moving components.
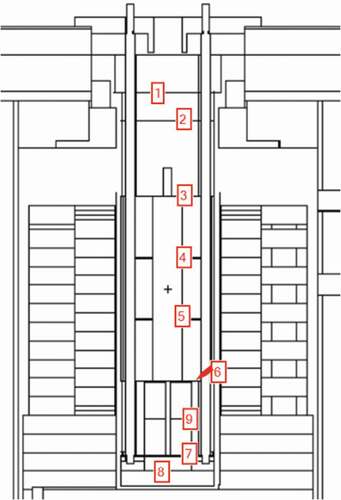
Another source of asymmetric uncertainty bounds is the possible presence of gaps. It is assumed there are no gaps, so introducing gaps in a certain location causes keff to move in only one direction. The nine potential gap locations, shown , in the central core column () were evaluated independently. Some caused keff to increase, but some caused it to decrease, as summarized in . A detailed discussion on determining the size of the different gaps is provided in Sec. 2.5 of the KRUSTY benchmark evaluation.Citation15
TABLE VII Uncertainty uk and Uncertainty of Central Core Column Axial Gaps
Fig. 3. Gap number used for axial central core column gap uncertainty.
Gaps in the BeO reflector rings also had a nonnegligible contribution to the overall uncertainty. The maximum size of the axial gaps in the BeO reflector rings was estimated by comparing measurements of the stack height with measurements of the individual part heights. (In contrast, the maximum size of the axial gaps in the central core column was estimated using measurements of the flatness and parallelism of adjacent parts.) The bounding uncertainty in the size of the gaps between each layer in the inner and outer BeO rings was +0.0018 in. and +0.005 in., respectively. For Case 1, inserting a gap of +0.0018/√3 in. between each layer in the BeO inner rings resulted in a Δkeff = +0.00008 ± 0.00003. Inserting a gap of +0.005/√3 in. between each layer in the BeO outer rings resulted in a Δkeff = –0.00011 ± 0.00003. These values (and analogous values for the other cases) were used separately as one-sided uncertainties in the total uncertainties of through VI.
IV.B. Outer Stainless Steel Shields Are Important
The outer stainless steel shields are enormous when compared to the size of the core. As these components were too large for the scales available, the masses were not measured. A density of 8.00 g/cm3 was assumed,Citation26,Citation27 and an uncertainty of ±1.5% was applied. Another reason the outer stainless steel shields are important in the uncertainty quantification is that the compositions were measured but uncertainties were not given, so the following uncertainties were applied: ±1% on the iron content, ±5% on chromium and nickel, and ±20% on all other impurities. The outer stainless steel shields contributed about as much to the total uncertainty as the fuel did. Gaps in the outer stainless steel shields had a very small contribution to the total uncertainty.
V. SIMPLIFIED MODEL
The detailed model takes about 2 h 10 min to run on 288 processors on the high-performance Grizzly machine at Los Alamos National Laboratory (LANL). A simplified model was developed to reduce this computational time. Simplifications were made in seven broad categories:
Fuel annuli: Use average fuel material definition with most impurities removed and one solid piece.
BeO reflector rings (geometry and density): Use average density and one single piece for inner BeO reflector rings, preserving total mass. Use average density and one single piece for outer BeO reflector rings, removing grooves on outer surface while preserving total mass. The overall outer dimensions of the inner and outer rings were preserved. There remains a radial gap between the rings.
BeO reflector rings (material): Remove most impurities.
Structure (geometry): Simplify the geometry, introducing cylindrical symmetry where possible.
Type 304 stainless steel (SS304), Type 4140 stainless steel (SS4140), and Type 316 stainless steel (SS316) (material): Remove some impurities.
Aluminum (material): Remove some impurities.
Air (material): Replace air with void.
When impurities were removed, the atom density of the material was reduced by the atom density of the removed nuclides.
Simplifying the fuel geometry and materials had the largest effect on keff; simplifying the BeO reflector rings had the second-largest effect. This is shown in , which lists the keff of the model with the simplification minus the keff of the model with all of the preceding simplifications. The bias was calculated as the keff of the model with the simplification minus the keff of the base case, which is the detailed model without any simplifications, also shown in . The base keff for each detailed model was the average of ten independent calculations, and the keff of each simplified case was the average of four independent calculations. For the final total simplification bias, the keff of each simplified case was the average of ten independent calculations. The final simplification bias is shown in italic print in .
TABLE VIII Cumulative Simplification Bias for Detailed to Simplified Model*
The simplified model takes about 50 min to run on the same computing configuration, a 62% savings. Most of the savings come from geometric simplifications. The slots for accommodating heat pipes and the support rods prevent the simplified KRUSTY model from being cylindrically symmetric.
VI. EXPERIMENTAL AND BENCHMARK keff
The benchmark experiment keff and its uncertainty were determined based on the measured asymptotic reactor period reported in . The experiment uncertainty is calculated as discussed in Sec. IV and is provided again in and X. The listed simplification bias for the detailed model, , is based on the temperature difference between the experiment and the nuclear data set used. The simplification bias for the simplified model, , includes the temperature difference and the bias introduced from the simplification of geometry and materials, as described in Sec. V. The bias is applied to the experimental keff to obtain the benchmark keff for both models.
TABLE IX Summary of Experimental and Benchmark keff, Uncertainty, and Bias for the Detailed Model
TABLE X Summary of Experimental and Benchmark keff, Uncertainty, and Bias for the Simplified Model
VII. SAMPLE CALCULATIONS
The results of sample calculations using MCNP6.2 for the five cases are shown in for the detailed benchmark model and for the simplified benchmark model. The calculations used continuous-energy ENDF/B-VIII.0 nuclear data with thermal scattering [i.e., S(α,β)]. Each calculated result (of both the detailed and the simplified models) is the average of ten independent calculations with 1 000 000 neutron histories per generation with 1200 active generations and 50 skipped generations. One standard deviation is given; for the reported benchmark values, the standard deviation is based on the results of the uncertainty evaluation, and for the stated sample calculations, the standard deviation reported is the Monte Carlo error.
TABLE XI Sample Calculation Results for the Detailed Model Using MCNP6.2
TABLE XII Sample Calculation Results for the Simplified Model Using MCNP6.2
The results of sample calculations using the Monte Carlo codeCitation28 COG 11.3 for the five cases are shown in for the detailed benchmark model and for the simplified benchmark model. The calculations used continuous-energy ENDF/B-VIII.0 nuclear data with thermal scattering. The calculations used 15 000 neutron histories per generation with 699 900 active generations and 100 skipped generations.
TABLE XIII Sample Calculation Results for the Detailed Model Using COG 11.3
TABLE XIV Sample Calculation Results for the Simplified Model Using COG 11.3
The results of sample calculations using the Monte Carlo codeCitation29 MC21 9.00.02 for the five cases are shown in for the simplified benchmark model. The calculations used continuous-energy ENDF/B-VIII.0 nuclear data with thermal scattering. The calculations used 500 000 neutron histories per generation with 1000 active generations and 50 skipped generations.
TABLE XV Sample Calculation Results for the Simplified Model Using MC21 9.00.02
The MCNP6.2, COG, and MC21 results are all within 1σ of the benchmark model keff.
The reactor kinetics parameters (computed using the iterated fission probability method, invoked with the KOPTS option in MCNP6.2) are given in for the detailed model and in for the simplified model.
TABLE XVI Sample Reactor Kinetics Calculation Results for the Detailed Model
TABLE XVII Sample Reactor Kinetics Calculation Results for the Simplified Model
Prompt neutron decay constant measurements were performed on the KRUSTY experiment using four Citation3He tubes placed in the heat pipe channels of the core not occupied by the support rods. Although there was a central cavity in the fuel, there was no way to instrument detectors in this location. Because of this positioning, the system had many reflected neutrons incident upon it, which led to saturation of the detectors from what are in essence uncorrelated source neutrons near critical, so no direct measurement was attempted.
The measured value of Rossi-α for the KRUSTY experiment is –1136.5 ± 16.1 s−1. The calculated Rossi-α results agree well with the experimental measurements reported in CitationRef. 20, as shown in . As demonstrated in CitationRef. 20, there typically exists a 10% to 20% negative bias in the measured versus simulated values of Rossi-α, which matches well with the results of the KRUSTY experiment.
TABLE XVIII Comparison of Experimental and Calculated Values of Rossi-α
VIII. NUCLEAR DATA AND SENSITIVITIES
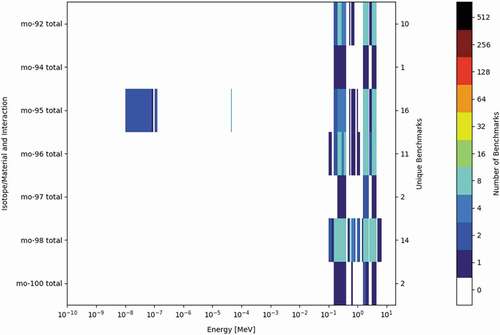
KRUSTY’s value as a benchmark is due to its sensitivity to beryllium and molybdenum. show heat maps of the number of benchmarks in the 2016 edition of the ICSBEP Handbook that are sensitive to various reactions involving beryllium and molybdenum.Citation30 It can be seen in that there are 30 total benchmarks that are sensitive to 9Be elastic scattering and 28 benchmarks sensitive to elastic scattering of beryllium in BeO. shows a maximum of 16 total benchmarks that are sensitive to any molybdenum isotope.
Fig. 4. Heat map showing number of benchmarks sensitive to beryllium.
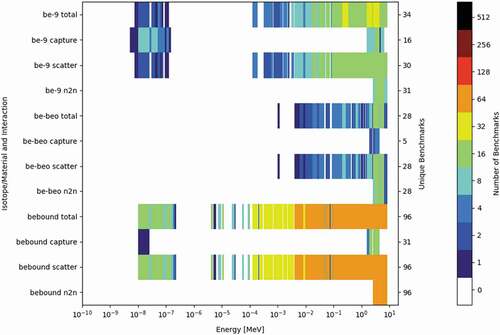
Fig. 5. Heat map showing number of benchmarks sensitive to molybdenum.
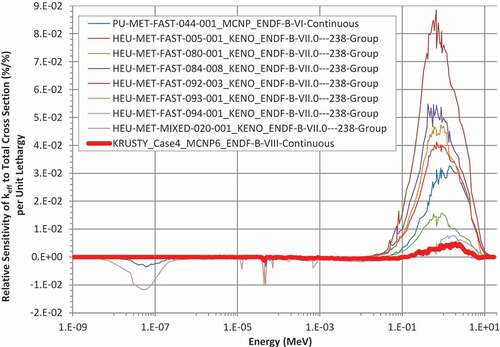
The relative sensitivity of keff in these benchmarks to the total cross section of 9Be or elemental molybdenum is compared with KRUSTY in , respectively, to show the importance of KRUSTY to the community. are intended to show where the KRUSTY sensitivities fall among the previous benchmarks; the details of the previous benchmarks are unimportant for this purpose. For beryllium, there are 17 benchmarks that have a sensitivity greater than 0.05%/%/(unit lethargy) between 0.5 and 0.82 MeV. KRUSTY adds an 18th benchmark. The sensitivity spectra for the current benchmarks and KRUSTY are plotted in . For molybdenum, there are eight benchmarks with a sensitivity greater than 0.004%/%/(unit lethargy) between 1.85 and 2.354 MeV with KRUSTY adding a ninth benchmark with a sensitivity of 0.0054%/%/(unit lethargy) at 1.94 MeV. These sensitivity spectra are provided in . ( include only the benchmark with the largest sensitivity in a series, and the examined benchmarks are from the 2016 edition of the ICSBEP Handbook.)
Fig. 6. Comparison of the relative sensitivity of keff to the 9Be total cross section with previous benchmarks.
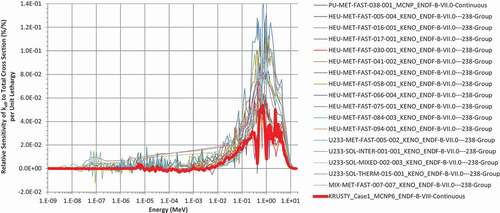
Fig. 7. Comparison of the relative sensitivity of keff to the elemental molybdenum total cross section with previous benchmarks.
As shown in the ENDF/B-VIII.0 criticality testing, of the benchmarks sensitive to elastic scattering in BeO, the simulated keff values generally decreased when ENDF/B-VII.1 data were replaced with ENDF/B-VIII.0 data.Citation22 As there are so few experiments sensitive to elastic scattering in BeO, it is not clear if these changes are actually matching experiments better or not. A detailed analysis of the KRUSTY sensitivities (more detailed than is provided in this paper) should help resolve these questions. No changes to the molybdenum cross sections are mentioned in the ENDF/B-VIII.0 paper.Citation22
IX. SUMMARY AND CONCLUSIONS
As the only successful test of a microreactor, KRUSTY represents the future of nuclear technology both on Earth and other planets. This joint NASA/NNSA experimental campaign was executed at NCERC from November 2017 to March 2018 in four distinct phases. Five configurations from the first phase, component critical experiments, were chosen to be evaluated as a benchmark for inclusion in the ICSBEP Handbook.
These configurations were evaluated across five distinct categories [listed in Sec. IV as (1) criticality measurement, (2) mass and density, (3) dimensions, (4) material compositions, and (5) positioning] to determine the overall experiment uncertainty. Additionally, biases associated with the benchmark model simplifications were determined. Once the uncertainty and simplification biases were applied to the experimental keff, the benchmark keff was calculated. MCNP6.2 was used for all of the neutron transport simulations. The largest difference between the computational and experimental keff was –22 pcm for both the detailed and simplified models. Results from the COG 11.3 and MC21 9.00.02 Monte Carlo codes using ENDF/B-VIII.0 cross sections are also provided. The calculated keff results from MCNP6.2, COG 11.3, and MC21 9.00.02 are all within 1σ of the benchmark model keff.
The KRUSTY assembly will be a valuable addition to the ICSBEP Handbook because of its sensitivity to beryllium and molybdenum, to which relatively few current benchmarks are sensitive.
Acknowledgments
The authors are grateful to Soon Kim, Lawrence Livermore National Laboratory, for providing COG results. The authors are also grateful to Szelim Kong, Naval Nuclear Laboratory, for providing MC21 results.
This material is based upon work supported in part by the U.S. Department of Energy (DOE) Nuclear Criticality Safety Program, funded and managed by the NNSA for the DOE. This work was also supported by the NASA Space Technology Mission Directorate and an Integrated University Program Graduate Fellowship. We would like to acknowledge the work of the KRUSTY evaluation’s external reviewers, John Bess (Idaho National Laboratory) and Dave Heinrichs (Lawrence Livermore National Laboratory), and we would like to acknowledge the work of Gary Harms (Sandia National Laboratories), who also reviewed the evaluation.
Notes
a As all benchmark evaluations are subject to revision, consult the latest edition of the ICSBEP Handbook for the most recent values.
b MCNP® and Monte Carlo N-Particle® are registered trademarks owned by Triad National Security, LLC, manager and operator of LANL. Any third-party use of such registered marks should be properly attributed to Triad National Security, LLC, including the use of the designation as appropriate. For the purposes of visual clarity, the registered trademark symbol is assumed for all references to MCNP within the remainder of this paper.
References
- J. VUJIC et al., “Small Modular Reactors: Simpler, Safer, Cheaper?” Energy, 45, 1, 288 (2012); https://doi.org/https://doi.org/10.1016/j.energy.2012.01.078.
- A. LEVINSKY et al., “Westinghouse eVinci Reactor for Off-Grid Markets,” Trans. Am. Nucl. Soc., 119, 931 (2018).
- OKLO POWER, “Part II: Final Safety Analysis Report,” U.S. Nuclear Regulatory Commission (2020); https://www.nrc.gov/docs/ML2007/ML20075A000.html ( current as of Oct. 22, 2020).
- H. BOWERS, “Xe-Mobile,” X-Energy; https://x-energy.com/reactors/xe-mobile (current as of Aug. 20, 2020).
- M. WALD, “Micro-Reactors Will Provide Cost-Competitve, Carbon-Free Energy in Remote Places,” Nuclear Energy Institute; https://www.nei.org/news/2019/micro-reactors-cost-competitive-clean-remote (current as of Aug. 20, 2020).
- B. WANG, “Canada Reviewing Ten Small Nuclear Reactor Designs Including eVinci Solid State Microreactor,” Next Big Future website; https://www.nextbigfuture.com/2018/02/canada-reviewing-ten-small-nuclear-reactor-designs-including-evinci-solid-state-microreactor.html (current as of Aug. 20, 2020).
- “More SMR Vendor Design Reviews for CNSC,” World Nuclear News; https://www.world-nuclear-news.org/NN-More-SMR-vendor-design-reviews-for-CNSC-2002187.html (current as of Aug. 20, 2020).
- K. SMITH et al., “Floating Micro-Modular-Reactor Concept for Localized Power Outages,” Trans. Am. Nucl. Soc., 120, 680 (2019).
- P. McCLURE et al., “Kilopower Project: The KRUSTY Fission Power Experiment and Potential Missions,” Nucl. Technol., 206, Suppl. 1, S1 (2020); https://doi.org/https://doi.org/10.1080/00295450.2020.1722554.
- R. SANCHEZ et al., “Kilopower Reactor Using Stirling TechnologY (KRUSTY) Update: Cold Critical Experiments,” Trans. Am. Nucl. Soc., 119, 709 (2018).
- R. SANCHEZ et al., “Kilowatt Reactor Using Stirling TechnologY (KRUSTY) Component-Critical Experiments,” Nucl. Technol., 206, Suppl. 1, S56 (2020); https://doi.org/https://doi.org/10.1080/00295450.2020.1722553.
- T. GROVE et al., “Kilowatt Reactor Using Stirling TechnologY (KRUSTY) Cold Critical Measurements,” Nucl. Technol., 206, Suppl. 1, S68 (2020); https://doi.org/https://doi.org/10.1080/00295450.2020.1712950.
- D. POSTON et al., “Results of the KRUSTY Warm Critical Experiments,” Nucl. Technol., 206, Suppl. 1, S78 (2020); https://doi.org/https://doi.org/10.1080/00295450.2020.1727287.
- D. POSTON et al., “Results of the KRUSTY Nuclear System Test,” Nucl. Technol., 206, Suppl. 1, S89 (2020); https://doi.org/https://doi.org/10.1080/00295450.2020.1730673.
- K. SMITH et al., “KRUSTY: Beryllium-Oxide and Stainless-Steel Reflected Cylinder of HEU Metal,” HEU-MET-FAST-101, International Handbook of Evaluated Criticality Safety Benchmark Experiments (Database), Organisation for Economic Co-operation and Development, Nuclear Energy Agency (2021).
- K. SMITH et al., “Preliminary Benchmark Analysis of Component Critical Configuration of Kilowatt Reactor Using Stirling TechnologY (KRUSTY),” Trans. Am. Nucl. Soc., 119, 819 (2018).
- K. SMITH et al., “Update on Benchmark Analysis of Component Critical Configuration of KRUSTY,” Trans. Am. Nucl. Soc., 121, 925 (2019); https://doi.org/https://doi.org/10.13182/T31038.
- J. A. FAVORITE et al., “Status of the KRUSTY Benchmark Modeling and Uncertainty Analysis,” Trans. Am. Nucl. Soc., 123, 813 (2020); https://doi.org/https://doi.org/10.13182/T123-32876.
- G. R. KEEPIN, Physics of Nuclear Kinetics, Addison-Wesley Publishing Company, Boston, Massachusetts (1965).
- G. McKENZIE, “Validation of MCNP Rossi-Alpha Calculations Using Recent Measurements,” Proc. 11th Int. Conf. Nuclear Criticality Safety (ICNC 2019), Paris, France, September 15–20, 2019.
- “MCNP User’s Manual – Code Version 6.2,” LA-UR-17-29981, C. J. WERNER, Ed., Los Alamos National Laboratory (2017).
- D. BROWN et al., “ENDF/B-VIII.0: The 8th Major Release of the Nuclear Reaction Data Library with CIELO-Project Cross Sections, New Standards and Thermal Scattering Data,” Nucl. Data Sheets, 148, 1, 1 (2018); https://doi.org/https://doi.org/10.1016/j.nds.2018.02.001.
- J. CONLIN et al., “Release of ENDF/B-VIII.0-Based ACE Data Files,” LA-UR-18-24034, Los Alamos National Laboratory (2018).
- D. K. PARSONS and C. TOCCOLI, “Re-Release of the ENDF/B VIII.0 S(α,β) Data Processed by NJOY2016,” LA-UR-20-24456, Los Alamos National Laboratory (2020); https://permalink.lanl.gov/object/tr?what=info:lanl-repo/lareport/LA-UR-20-24456 ( current as of Oct. 22, 2020).
- J. A. FAVORITE et al., “Adjoint-Based Sensitivity and Uncertainty Analysis for Density and Composition: A User’s Guide,” Nucl. Sci. Eng., 185, 3, 384 (2017); https://doi.org/https://doi.org/10.1080/00295639.2016.1272990.
- R. J. McCONN JR et al., “Compendium of Material Composition Data for Radiation Transport Modeling,” PNNL-15870, Rev. 1, Pacific Northwest National Laboratory (2011).
- S. D. WASHKO and G. AGGEN, Wrought Stainless Steels, Vol. 1, Table 21, ASM International, Materials Park, Ohio (1990); https://doi.org/https://doi.org/10.31399/asm.hb.v01.a0001046.
- “COG: A Multiparticle Monte Carlo Code Transport Code, Version 11.1,” CCC-829, Radiation Safety Information Computational Center (2015).
- D. P. GRIESHEIMER et al., “MC21 V.6.0 – A Continuous-Energy Monte Carlo Particle Transport Code with Integrated Reactor Feedback Capabilities,” Ann. Nucl. Energy, 82, 29 (2015); https://doi.org/https://doi.org/10.1016/j.anucene.2014.08.020.
- N. THOMPSON, R. BAHRAN, and J. HUTCHINSON, “Identifying Gaps in Critical Benchmarks,” Trans. Am. Nucl. Soc., 119, 829 (2018).