
 ?Mathematical formulae have been encoded as MathML and are displayed in this HTML version using MathJax in order to improve their display. Uncheck the box to turn MathJax off. This feature requires Javascript. Click on a formula to zoom.
Abstract
The Hypatia measurement campaign with YHx moderators and highly enriched uranium (HEU) was completed in January 2021 at the U.S. Department of Energy’s National Criticality Experiments Research Center at the Nevada National Security Site. This measurement campaign provided unique integral measurements based on two experimental configurations and investigated the temperature effects of yttrium hydride (YHX = 1.8 and 1.9) in a critical reactor system, which is of potential interest for microreactor designs. The Hypatia experiment consisted of a fuel column composed of HEU, 93 wt% 235U discs, encapsulated YHX, aluminum oxide heater plates, and other moderator and reflector materials (beryllium, depleted uranium, and graphite) inserted into a thick beryllium reflector. During the Hypatia experiment, baseline measurements were taken at room temperature. The aluminum oxide heater plates were specially designed and used for this project to increase the central core temperature to a range of temperatures, after which additional reactivity measurements were taken. Thermal and neutronic calculations predicted that YHX is a unique material that can exhibit a positive temperature coefficient of reactivity (i.e., reactivity can increase as the temperature in the YHX increases). Reactors using YHX should account for this unique feature during design, and the results of the Hypatia experiment significantly aid that process. For configuration 1, six different temperature reactivity measurements were taken with four YHX cans in the fuel column. For configuration 2, six different temperature reactivity measurements were taken with two YHX cans in the fuel column. The use of these two configurations provide a comparison of neutronic effects from the YHX cans versus other components. Preliminary conclusions show the positive temperature coefficient is similar but slightly less than predicted by simulations. These two sets of data will be used to separate the reactivity coefficients of the fuel and other materials in the fuel column.
I. INTRODUCTION
I.A. History of Critical Experiments in the United States
Critical experiments have been performed since the beginning of the Manhattan Project in the early 1940s. These experiments provide data for fissile systems and allow for the absolute determination of criticality. They can be used to validate nuclear cross sections, which are based on theory and differential data (such as that taken at accelerators). Beyond just testing cross sections, information from critical experiments provides the means to adjust these experiments, which is necessary for making accurate predictions. With the increased use of significantly increased computational power over the decades since the Manhattan Project, the need for and essential value of critical experiments has decreased because of the belief that all parts of a reactor and reactor design could be simulated with computer codes, thus making experiments unnecessary. However, in recent years, significant attention has been brought back to the need for critical experiments because of the increased interest in systems where little experimental data exist and because of interest in new materials that do not have validated cross-section information. The National Criticality Experiments Research Center (NCERC), operated by Los Alamos National Laboratory (LANL) in Nevada, is the last remaining general-purpose critical experiment facility in the United States.
The NCERC moved from New Mexico to Nevada in 2011 and since then has continuously increased the number and type of critical experiments performed, highlighting the need for continued experimental research and the capability to support computer codes and nuclear cross-section data sets. Recently, the Hypatia experiment was performed at the NCERC to test the performance of yttrium hydride (YHx) at elevated temperatures. Yttrium hydride is a promising material for use in microreactors that can decrease required fuel masses through thermalization of the neutron energy spectrum.
I.B. Microreactor Experiment Needs
Microreactors have become an important topic and aspect of the future of electric power for a variety of reasons. Microreactors can be used in remote locations and for disaster relief and mobile needs. These microreactors need to be quite small and compact. To achieve this, advanced moderator materials, beyond water or graphite, are needed. Most concepts considered for microreactors do not have critical experiments to compare to, and thus the simulations cannot be validated. The potential designs also include a beryllium reflector, which is an excellent neutron reflector and is lightweight. Additionally, the advanced moderators have few critical experiments available for use or comparison. One such material being considered for use in microreactors is YHx.
Extensive work related to material properties and differential measurements of YHx has been done, but no full-scale critical experiments have been performed. Yttrium hydride can be especially important for small reactors, as it retains hydrogen at temperatures far greater than water and other hydrides and has superior moderating performance to moderators such as graphite to reduce the required fuel mass.Citation1 Designs such as the Transformation Challenge Reactor and others rely on yttrium hydride to operate at high temperatures with a compact core.Citation2 One unique aspect of YHx that needs to be better understood is the predicted positive temperature reactivity coefficient, i.e., as the temperature of just the YHx moderator in a system increases, reactivity will increase. In particular, as the temperature rises, the neutron energy spectrum changes slightly, and fissions within the resonance region of 235U become more prevalent and relative capture in YHx decreases.Citation3 Other materials in the system with negative reactivity features must offset this increase for an overall inherent negative reactivity coefficient in the reactor. The Hypatia experiment measured the magnitude of the reactivity changes for YHx by focusing on validating YHx reactivity behavior at elevated temperatures with minimal coupling to other materials.
II. HYPATIA EXPERIMENT DESIGN
The Hypatia experiment was designed to test YHx through a critical experiment where YHx was a primary component rather than an add-on, thus providing a proof-of-concept set of multiphysics experiments for future code validation and specifically evaluating the positive temperature coefficient in YHx. The experiment was designed for execution at the NCERC, as the inventory of special nuclear material is extensive and the experimental platform and safety basis are already in place. The experiment was specifically designed for the Planet vertical lift assembly machine.Citation4 Many components came from existing inventory, including the fuel and the radial and axial reflectors. New parts manufactured included electric heaters, canned YHx, graphite resistance temperature detector (RTD) plates, and an aluminum guide tube. The configurations varied the amount of YHx, thus evaluating the effect of the YHx temperature coefficient versus the highly enriched uranium (HEU) temperature coefficient. Performance of the experiment was predicted and validated using the Monte Carlo N-Particle (MCNP) transport code MCNP6.1® (CitationRef. 5).Footnotea
II.A. Overall Experiment Design
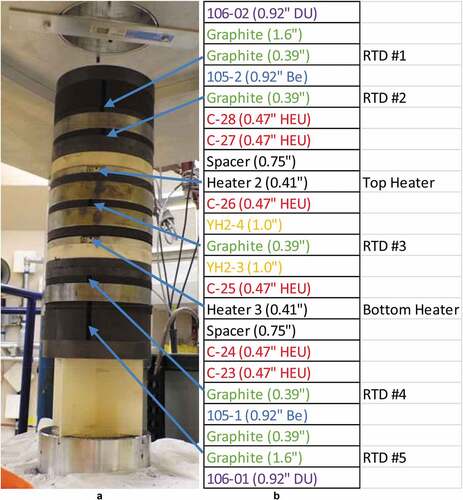
The experiment used a series of nominally 6-in. (15.24-cm)-diameter discs that were stacked in a column and reflected radially by beryllium. shows an MCNP rendering of configuration 1. Pictures and the stacking order are shown for configuration 1 and configuration 2 in and , respectively. All parts of the assembly are labeled. Arrows are also added from and with RTD locations to their physical location in and . As shown, the fuel column is inserted into the radial reflector, as would be the case for criticality. The fuel column is maintained and controlled via an aluminum guide tube that was specifically designed for this experiment. The aluminum guide tube ensures a smooth insertion of the core into the assembly. It also ensures that the internal components of the column remain in place when the platen is raised and lowered, thereby providing a layer of safety. The fuel column is mated to the beryllium reflector via graphite corner pieces. The temperature was measured in several places via resistive temperature devices.
Fig. 1. MCNP rendering of the Hypatia experiment configuration 1: (a) cutaway in the vertical plane and (b) cutaway in the horizontal plane (Be is teal, YHx is orange/white for the inner discs, HEU is pink, graphite is green, and DU is brown).
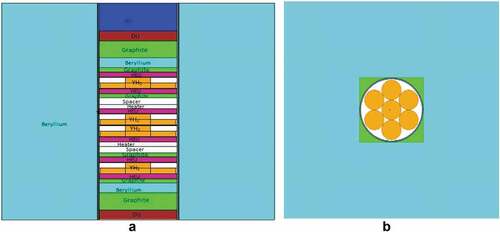
Fig. 2. Configuration 1 (a) core column picture before heater controller and RTDs were installed; (b) diagram defining each piece and labels where the RTDs were installed; and (c) core column with RTDs, heater controller, heat tape, and guide tube installed.
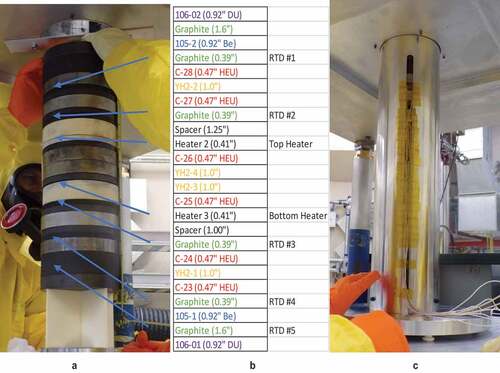
Fig. 3. Configuration 2 (a) core column picture before heater controller and RTDs were installed, and (b) diagram defining each piece and labels where the RTDs were installed.
II.B. Fuel Parts
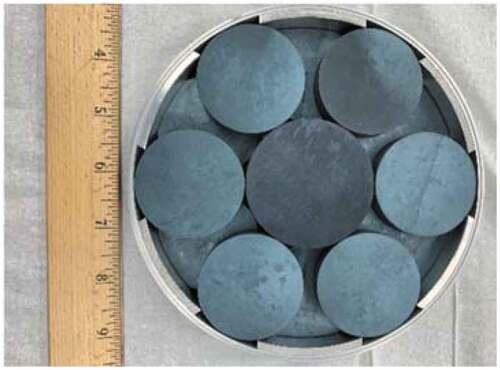
The fuel is composed of six HEU metal discs known as C-discs. These discs are unalloyed and unclad and were used previously in a critical experiment.Citation6 Each disc has an approximate outer diameter of 5.94 in., an average height of 0.466 in., and an average mass of 3923 g. lists the dimensions, masses, and computed densities of each C-disc with high precision to allow others to repeat the models in their transport code of interest. The isotopics are all 93.1 wt% 235U and 6.9 wt% 238U. A picture of one of these discs is shown in . The C-discs were used in ascending order by component number in the stack.
TABLE I C-disc HEU Component Physical Characteristics
Fig. 4. HEU C-disc used in the Hypatia experiment.
II.C. Yttrium Hydride Moderator Parts
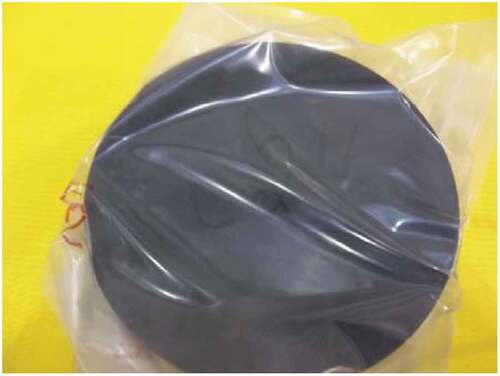
The YHx discs were manufactured in the LANL Sigma Facility. The method and design were both based on work completed in 2016 (CitationRef. 7). The method used existing yttrium metal, and the metal was fabricated to components with a ~1.9-in. (4.826-cm) diameter and a 0.48-in (1.219-cm) height. This size was determined to be the largest feasible at the initial fabrication time. The discs were converted to YHx via direct hydriding at a very slow rate.Citation8 After 14 of these discs were fabricated, they were assembled into a molybdenum container that was 0.02 in. thick and was welded shut. The discs were arranged in two layers thick of seven YHx discs in each layer. The first two full molybdenum cans full of YHx were made in 2016, and the latter two were made in 2020. The discs made in 2016 were made to specification (2.4511 cm diameter). The discs made in 2020 were mostly undersized (with a radius of 2.2733 cm each). As a result, four YHx discs with larger diameters (2.8067 cm) were made, which were placed in the center of each set of seven discs in each layer to provide a tight fit. This size variation within the can was possible with advancements in the hydriding process techniques in 2020 (CitationRef. 8). The newer discs, which had hydride ratios of 1.8 and 1.9, were placed in the center of the column for the experiment because their stoichiometry was better characterized than that of the discs fabricated in 2016. The discs were arranged in the cans such that no streaming paths occurred. shows one of the newer molybdenum cans of YHx before the lid was welded. Aluminum spacers were also used in the newer cans to ensure that there was no movement of the parts. Note that YHx inner disc 3 contained YHx with a stoichiometry of 1.8 (YH1.8) and YHx inner disc 4 was composed of YH1.9. It was assumed that discs 1 and 2 had a stoichiometry of approximately 1.9, although this was not confirmed during the fabrication process. The density of these discs was calculated to be 3.7 g/cm3, which is approximately 90% of the theoretical density of 4.1 g/cm3.
Fig. 5. Yttrium hydride inner discs within a molybdenum can before the lid was welded on.
II.D. Heater Parts
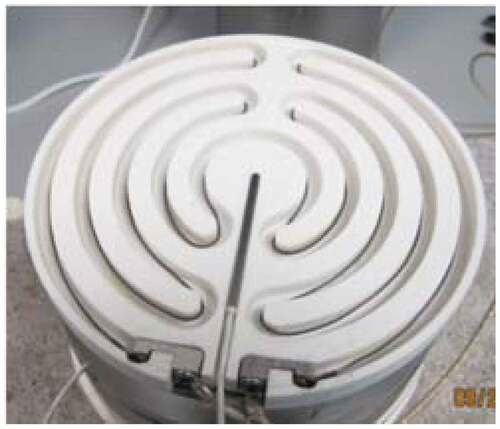
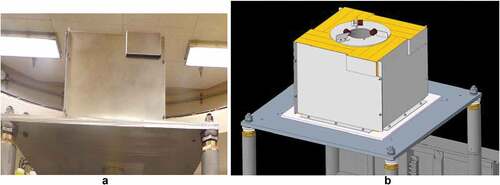
The heaters were initially designed by the National Aeronautics and Space Administration (NASA) under a previous project.Citation7 They are electrically connected and have ports for an RTD to interface with a temperature controller, which allowed for the heaters to be operated remotely. The main component of the heaters was aluminum oxide with a slot for a heating element. Nichrome wire was chosen for the heating element because it allowed the temperature to reach 330°C, worked with the power supply, and fit within the designed slots. Covers made of aluminum oxide were also used, which allowed for easy access to the heating elements and RTD and provided insulation from other surfaces such as the HEU. These heaters, including the lid, were 5.85 in. in diameter and 0.41 in. in height. shows a picture of one of the heaters, without the lid, during testing. The heaters are mainly aluminum oxide with a density of 3.8 g/cm3.
Fig. 6. Aluminum oxide heater. Also shown are the RTD connected to the temperature controller and the nichrome wire heating element.
II.E. Graphite RTD Plates
The core column included several graphite discs with slots for RTDs. These were used to moderate the neutron energy, help achieve a critical configuration, and provide locations within the assembly to measure the temperature. The graphite used was grade 2114 “nuclear grade graphite” with a density of 1.81 g/cm3. Two different heights were used: 0.394 in. (thin) and 1.575 in. (thick). All of the graphite discs were 6.00 in. in diameter, with a 0.20-in.-diameter hole running radially along the center for an RTD. Thicker discs were used toward the axial edges of the assembly, and thinner discs were used throughout the assembly, closer toward the center. For the second configuration, a thin graphite RTD plate was used in the absolute center of the assembly so that temperature measurements could be obtained.
II.F. Additional Axial Reflectors
Beryllium and depleted uranium (DU) discs were also used as axial reflectors, with the DU placed on the absolute ends. This was done to ensure that there was enough reactivity in the assembly for a critical configuration. The beryllium discs were placed axially inside the DU and separated by a thick graphite RTD plate. Both the DU and the beryllium discs had a diameter of 5.93 in. and a height of 0.92 in. They were pure, unclad, and unalloyed, and they came from the existing NCERC inventory. They had been used in the past in the same International Criticality Safety Benchmark Evaluation Project benchmark that used the C-discs. The density of the beryllium axial plates was assumed to be 1.85 g/cm3, and the density of the DU was 17 g/cm3.
II.G. Aluminum Guide Tube
As previously mentioned, the fuel column components were held in place by an aluminum guide tube. This tube not only ensured that the components stayed steady and that nothing caught on the reflector, but also that the wires associated with the RTDs and temperature controller had a place to sit without interfering with the assembly. The guide tube was made from aluminum 6061 and was 50 in. in height with a slot that extended up 23.75 in. from the bottom. The inner and outer diameters of the guide tube were 6.0 and 6.1 in., respectively. The slot width was 0.6 in., and the density of the aluminum was 2.7 g/cm3.
II.H. Graphite Corner Pieces
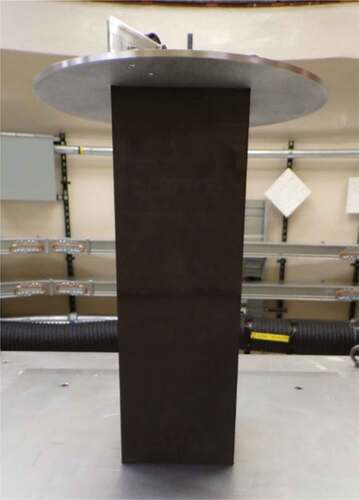
The fuel column was cylindrical, whereas the radial reflectors were rectangular blocks. As such, graphite pieces were fabricated to mate the fuel column to the radial reflectors. These graphite pieces had an inner diameter of 6.353 in. and an outer side length of 6.695 in. Two were used on top of each other, with a combined height of 20.300 in. These parts were made from the same graphite as the graphite RTD plates. shows these parts on the assembly before the reflector was added. The roller plate is shown on top of it, which ensured that the guide tube was exactly centered and moved smoothly within the stack.
Fig. 7. Graphite corner pieces on the assembly.
II.I. Beryllium Reflector
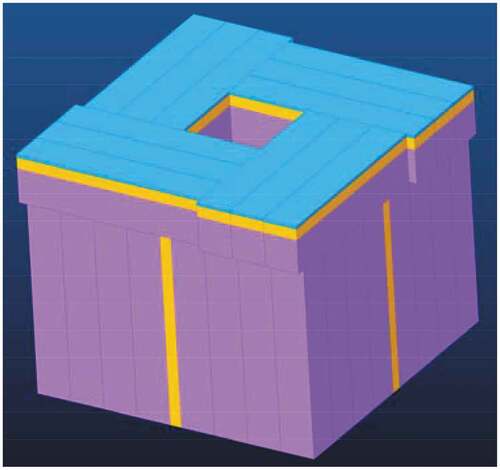
The beryllium reflector was made from existing blocks in the NCERC inventory. These blocks were originally made for the Honeycomb experiment.Citation9 This beryllium was high-purity metal with a near theoretical density. It had no cladding or paint protectant. The pieces used included three sizes. The heights were 0.25, 0.995, and 3.0 in., and all pieces were 16.0 in. in length and 3.0 in. in width. shows a computer-aided design (CAD) model of the stacking of the beryllium reflector with each part type in a different color.
Fig. 8. CAD model of the beryllium reflector. Each part type is shown in a different color. These pieces fit snugly together. The beryllium reflector was assumed to have a density of 1.85 g/cm3, as it was tightly packed with individual material densities of 1.85 g/cm3 each.
II.J. Aluminum Shroud
The beryllium reflector was maintained in a tight fit by an aluminum shroud. The shroud was made of aluminum 6061 with an assumed density of 2.7 g/cm3. It consisted of four pieces, one on each side, that were bolted together. The aluminum shroud was used to minimize gaps between the beryllium reflector parts and to ensure that there was no movement of the beryllium reflector parts during operations. shows the aluminum shroud on the assembly.
Fig. 9. Aluminum shroud on the Planet assembly: (a) picture and (b) CAD model.
III. HYPATIA EXPERIMENT METHODS
The Hypatia experiment was designed to produce two different sensitivities to YHx temperature coefficients through different amounts of YHx in the critical assembly. The sensitivities differed in the amount of YHx versus HEU fuel, which are the two dominant components affecting the reactivity change with temperature. MCNP was used to find the approximate critical configurations at room temperature by using different spacer thicknesses, which changed the value of keff. By varying the spacer thickness, a 1/M approach was used to find a critical spacer thickness, with the initial spacer thicknesses providing far subcritical configurations. The 1/M approach used an external 252Cf source on the opposite side of the assembly from the detectors. The target excess reactivity goal for the 1/M process was between 10 and 20 ¢ of excess reactivity, which would allow for precise measurements of the system reactivity and enough reactivity to determine changes in reactivity as the column was heated to higher temperatures. In these experiments, excess reactivity is defined as the reactivity when the core column is fully inserted into the reflector. It also ensured that keff was less than 0.70 with the core column removed from the radial reflector. A 1/M approach to critical was performed based on spacer thickness and core insertion on each spacer thickness.
When a spacer thickness with a critical configuration in the excess reactivity range of interest was achieved, the RTDs, heater controller, power cables, and heat tape were installed. The excess reactivity was measured again at room temperature with all the new items installed. The core was then removed from the reflector, and the heaters started at a rate of 2°C/min until a desired temperature was reached (roughly 50°C above the current temperature). The temperature of the heaters was then held at this temperature for approximately 30 min to stabilize the temperature profile within the column. The heaters were at the desired set point temperature during the full 30-min wait period. All other temperatures within the core increased during the wait period at a progressively slower rate; none equaled the heater temperatures, as insulation was not provided for this to occur. The temperature of all RTDs was continuously recorded. It was noted that heat continued to flow through the system away from the heaters, meaning that all other temperatures continued to increase. This 30-min wait period was used to slow the rate of increase of the temperature throughout the assembly while allowing for sufficient time to complete additional measurements within the day. It is known that an exact steady-state temperature profile was not achieved in the assembly during the 30-min period. The core was then reinserted into the reflector, with a total travel time of approximately 2 min. The heaters continued to be held at the target temperature during this process. The system was maintained as a critical configuration until a sufficient power level for measurement of the period was achieved. An approximate reactor period was fit to the data. The data used came from two sets of detectors: two systems—a set of three compensated-ion chambers, referred to as linear channels (LCs) at the NCERC, which function best at medium/high power; and the sum of four 3He tubes, individually wrapped in approximately 0.5 in. of polyethylene, known as startup (SU) detectors, which operate in pulse-counting mode and thus function best at low power. The LCs are referred to as such because they show a single scale of the exponential they are recording in a linear diagram. Both sets of detectors are external to the system. The LCs range from 10 to 20 ft from the outside edge of the radial reflector, as they are in fixed positions on the walls of the room. The SU detectors are at ~12-in. from the outside edge of the radial reflector. The core was removed from the reflector and the process repeated to the next temperature, approximately 50°C above the current temperature.
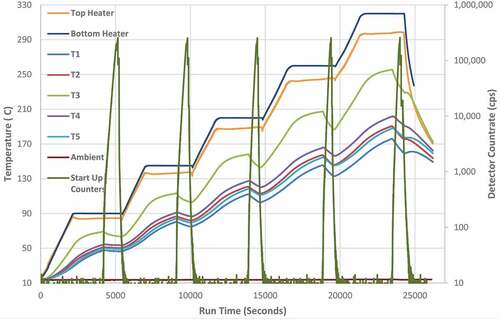
and 11 show the full profile of the temperatures and neutron power level in the assembly for configurations 1 and 2. Unfortunately, the temperatures of the YHx could not be directly measured.
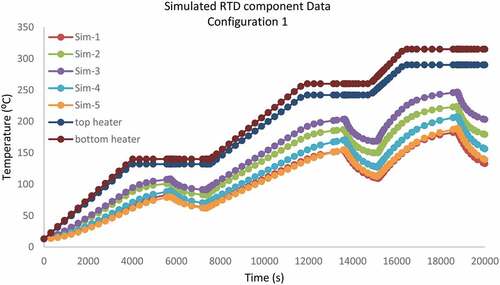
Fig. 10. Full temperature profile and neutron detector count rate profile for configuration 1. The neutron power level is shown on the right axis for the SU neutron counters, as recorded and reported by the detector count rate. All temperature data are shown on the left axis.
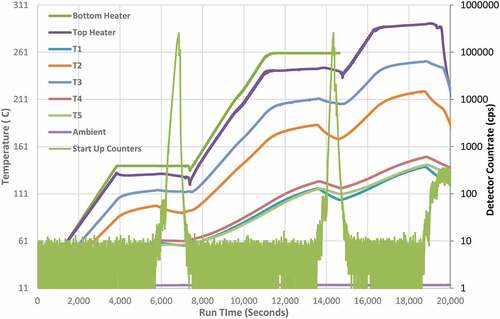
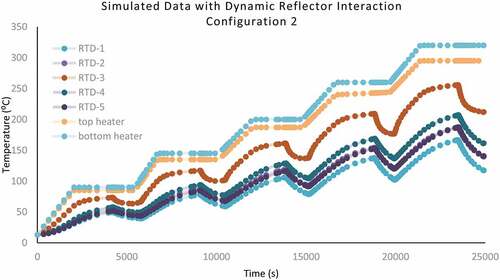
Fig. 11. Full temperature profile and neutron count rate profile for configuration 2. The neutron power level is shown on the right axis for the SU neutron counters, as recorded and reported by the detector count rate. All temperature data are shown on the left axis.
IV. HYPATIA SIMULATIONS
As this experiment was dynamic in nature, both neutronic and thermal effects were important in understanding performance and reactivity changes with temperature. Thus, a detailed MCNP input deck was created to calculate reactivity changes, and a detailed Abaqus model was created to calculate the thermal-mechanical changes in the experiment.Citation10 These simulations are described in Secs. IV.A and IV.B.
IV.A. MCNP Model Description
The system was modeled using the material dimensions and densities given in Sec. III. The resulting simulations predicted excess reactivity with varying stoichiometry, temperatures, spacer thicknesses, and separation distances while validating cross sections with experimental data. Predicted excess reactivity as a function of temperature with cross sections every 50 K was calculated using both ENDF/B-VIII.0 cross sections for yttrium and hydrogen and newly calculated S(α,β) data every 50 K for substoichiometric YH (CitationRefs. 1 and Citation11).
Results from the newly generated cross sections for YHx in MCNP were compared to results for the standard ENDF/B-VIII.0 library for YH2 at temperatures of 300 and 600 K in . Results were comparable, so the substoichiometric cross sections for YH1.8 and YH1.9 were used for the calculations reported in this paper to most closely represent the materials in the experiment.Citation11 The spacers are modeled as Al2O3 with a density of 0.2632 g/cm3, the thickness of which varied in each configuration.
TABLE II Comparison of keff with Two Different Cross-Section Libraries at 300 and 600 K for Configuration 2*
IV.B. Abaqus Thermal Model Description
As correlating YHx temperatures to reactivity is essential to Hypatia success and because there was no temperature measurement device within the YHx canisters, thermal simulations of the experiment were produced to estimate these temperatures at any given time in the procedure. A three-dimensional (3D) model of Hypatia was rendered in unstructured mesh using Abaqus finite element analysis.Citation12,Citation14 The geometry, visualized in , is composed of eight-node, temperature-displacement coupled brick elements. The mesh resolution exceeded thermal convergence, with the highest mesh resolution on the moderator components. The primarily cylindrical stack components had surface irregularities in the real system. These irregularities were not geometrically modeled; components were modeled as perfect cylinders. However, the gaps provided by surface irregularities were accounted for thermally by approximating a degraded surface contact conductivity.
Fig. 12. (a) Abaqus unstructured mesh and (b) simulated thermal gradient output with a close-up resolution of YHx disc components. Geometry, mesh structure, and thermal contour resolution are demonstrated here, hence temperature legend and time are not provided.
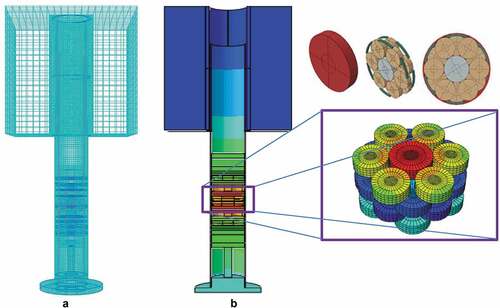
provides an example of correlated thermal contour outputs for the system with high resolution on the YHx discs of interest. The temperatures for each disk were extracted as the volume-averaged temperature to account for component gradients. The analysis has been performed for both column configurations in a coupled thermal displacement transient model. The displacement aspect of the analysis was implemented to account for the motion of the system in and out the reflector, which had significant effects on heat transfer mechanisms. The transient aspect of the model accounted for the reflector insertion and removal as well as the distinct times the heater temperature was incrementally increased. Configurations 1 and 2 were each run to be identical with the induced changes of the individual experiments’ procedures in real time.
Accuracy for predicted YHx temperatures, which has no corresponding physical measurements for benchmarking, is inferred from determining the simulations’ agreement with components which do have physical measurements for benchmarking. Temperature values for the five RTD components positioned throughout the stack were used to assess the accuracy of the simulation. Transient results for volume-averaged RTD plate temperatures are compared directly to the experimental RTD time-dependent data. The deduced error on an RTD component can be projected as an uncertainty range for its nearest YHx component. Hence, the results for both configuration simulations are divided into two sections. First, a comparative analysis with simulated verses measured RTD values is discussed, and second, the estimated YHx temperatures with uncertainty ranges based on the comparative analysis are described for both configurations 1 and 2.
IV.B.1. Comparative Analysis
IV.B.1.a. Configuration 2
Initially, it was assumed that a simple heat transfer transient analysis, shown in for configuration 2, would provide a simulation in sufficient similarity with the experiment data for the purpose of estimating temperatures alone. However, the movement of the column in and out of the neutron reflector resulted in changes in both neutron reactions and temperatures as a function of time, which significantly altered thermal behavior. This is observable in the experiment data (see ), where incremental thermal contact with the reflector is evident by inflection points followed by periods of rapid decrease in component temperatures. To achieve the closest resemblance to the experiment, the time-dependent interaction between the reflector and column needed to be accounted for. The model included a step function velocity on the system in and out of the reflector. Results are provided in and will be described in more detail in a report in the near future.
Fig. 13. Configuration 2 simulated time-dependent RTD temperature results.
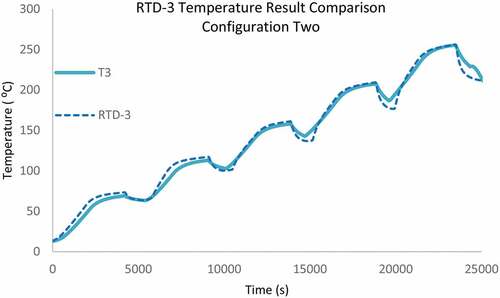
The thermal-displacement model demonstrated thermal behavior nearly identical to the measured effects as shown in for RTD-3. For configuration 2, RTD-3 was strategically positioned directly in between the two YHx canisters for indirect measurement. Hence, RTD-3 is the optimal reference for quantifying uncertainty in the YHx temperature estimates. compares the simulated results with physical measurements for RTD-3. The largest temperature difference between data sets is 5%. Based on observations of error per component position within the column, a conservative uncertainty range of 5% is applied uniformly for all YHx temperature estimates in configuration 2.
Fig. 14. Comparative analysis between RTD simulated (RTD-3) and measured (T3) temperature values for configuration 2.
IV.B.1.b. Configuration 1
Configuration 1 has four YHx canisters in the column. Because of the alternating stacking of YHx discs and RTDs, there does not exist a sole analyte for characterizing uncertainty with the nearest RTD, as was convenient in configuration 2. The RTDs have an uncertainty of 2°C. Instead, all RTDs were analyzed for error deduction and representative YHx temperatures were obtained through the simulations. The maximum temperature deviation in the configuration 1 simulation was 20% and was hence assigned as the conservative uncertainty range for all YHx estimates. As the contact resistance error in the simulation is propagated linearly with increased distance from the heat source, we can assume the described association of error is conservative, particularly for the YHx discs in the center of the stack.
IV.B.2. Results and Conclusions
The estimation of YHx temperatures has been produced by simulation of a 3D thermal-displacement transient model. The model accounted for real-time-induced changes in the system: heater ramping and reflector insertion. The simulations were performed for both configuration tests. The results provided substantial similarity to the measured temperature values on the RTDs, including thermal interaction effects of reflector insertion. Configuration 2 provided the most precise results within 5% error. Configuration 1 had a larger error of 20%. Improvements to the model are ongoing and further details of the analysis and results will be provided in a future report.Citation7
V. HYPATIA EXPERIMENTAL RESULTS
The experimental results are given in reactivity ρ with units of cents ¢. These values are obtained from the Inhour equation,Citation13 which makes use of the reactor period (a value that is measured by fitting an exponential curve to the plot of the power or neutron population of the supercritical system as a function of time). The reactor period is the e-folding time of the power or neutron population. The neutron population, also known as the power of the assembly, is measured with two systems: a set of three compensated-ion chambers and gross count rate 3He detectors. The Inhour equation is given as
Because this is a fast neutron energy system, the parameters used for it, specifically related to beta-effective, are the fast uranium parameters, known at the NCERC as the Godiva parameters. Fast neutron parameters were chosen because the HEU is fairly thick and thus does not mimic solution. These parameters are given in . The β/l value for this parameter set is 1.1 × 10⁶ s−1. The βeff value used is 0.0065, which is the delayed neutron fraction for 235U. Τ is the stable reactor period.
TABLE III Godiva Inhour Parameters, Decay Constants, and Yields
V.A. Configuration 1 Results
The critical configuration was found using a 1/M approach to critical. This method uses the fact that as a system approaches critical, multiplication approaches infinity. Thus, inverse multiplication, 1/M, approaches zero, which can be plotted and extrapolated too. This process is performed using relative multiplication, where the first point is assumed to have a multiplication of 1 and all other count rates are compared to that initial multiplication. Detector efficiency, starter neutron rate, and solid angle are assumed to not change, which is valid for this experimental setup. The approach was performed initially on combined spacer thickness, starting with two 1.50-in. spacers (a combined 3.00 in.), and finally as a function of distance from full insertion of the core column. The final spacer thickness used for configuration 1 was a 1.25-in.-thick spacer in the lower portion of the column and a 1.00-in.-thick spacer in the upper portion of the column (a combined 2.25 in.).
shows the final approach on distance from full insertion of the core column. The final configuration is described in Sec. II.A.
TABLE IV Final Approach to Critical by Distance from Full Core Insertion Using 2.25-in. Combined Spacer Thickness for Configuration 1
After a critical configuration was found, the heater cables, RTDs, and heat tape were installed in the core column and the excess reactivity was remeasured. This set the initial reactor period and inferred reactivity that would be used for all follow-on measurements for configuration 1. It was obtained at room temperature, ~14°C. The measured reactor period was 238 s, which equates to a reactivity of ~5 ¢ measured on the SU neutron detectors with a count rate of approximately 1 × 10⁴ cps. All delta reactivities for configuration 1 at higher temperatures were in reference to this point. shows the measured reactor periods, inferred reactivities, inferred delta reactivities, the power level (which is related to neutron population) at which the measurement was taken on the SU detectors, and all of the temperatures measured at the time of period measurement. The measured reactor periods and reactivities for the three LC detectors are also included.
TABLE V Measured Parameters at Each Critical Measurement for Configuration 1
V.B. Configuration 2 Results
The critical configuration for configuration 2 was found using the same methods as with configuration 1. An approach was performed on spacer thickness, initially using two 1.50-in. spacers. The final configuration had a 0.75-in. spacer in the lower portion of the column and a 0.75-in. spacer in the upper portion of the column (a combined 1.50 in.). shows the final approach on distance from full insertion of the core column. The final configuration is described in Sec. II.A.
TABLE VI Final Approach to Critical by Distance from Full Core Insertion Using 1.50-in. Combined Spacer Thickness for Configuration 2
After a critical configuration was found, the heater cables, RTDs, and heat tape were installed in the core column and the excess reactivity was remeasured. This was done following the same process as for configuration 1. This set the initial reactor period and inferred reactivity that would be used for all follow-on measurements for configuration 2. It was obtained at room temperature, ~14°C. The measured reactor period was 171 s, which equates to a reactivity of ~6 ¢ at a neutron power level of 7 × 10⁴ cps. All delta reactivities for configuration 2 were in reference to this point. shows the measured reactor periods, inferred reactivities, inferred delta reactivities, the power level at which the measurement was taken on the SU detectors, and all of the temperatures measured at the time of period measurement. The measured reactor periods and reactivities for the three LC detectors are also included.
TABLE VII Measured Parameters at Each Critical Measurement for Configuration 2
VI. COMPARISON OF HYPATIA EXPERIMENTAL AND SIMULATION RESULTS
VI.A. Configuration 1
From the initial calculations in the previous sections, the temperatures in were assumed to understand the initial impact of temperature changes in the system. Note that simulations are still underway to calculate more accurate YHx temperatures and material expansion effects; those listed here are simply the first predictions from assumed changes in YHx temperatures. reports initial predictions using MCNP and variations in cross sections as previously discussed in Sec. IV.A. The predicted excess reactivities were similar to the values measured, but more detailed temperature predictions and the effects of expansion still need to be included. Additional detailed temperature predictions will decrease simulated reactivity and thus closer to experimental results. Measured results are presented for SU detectors only.
TABLE VIII Initially Predicted Reactivity Compared to SU Measured Results for Configuration 1
Fig. 15. Simulated temperatures for configuration 1.
VI.B. Configuration 2
Results from simulations for configuration 2 compared to measured data are given in . provides the average YHx temperatures derived from . Predictions from simulations are similar to those measured for this configuration too. Analysis of other effects, such as expansion of the moderator, fuel, and/or other materials, is underway to understand the differences, but preliminary analyses show expansion effects decrease reactivity and make it closer to measured values. This includes evaluating detailed expansion and temperature gradients within components. This occurs because more neutrons leak out of the expanded assembly.
TABLE IX Initially Predicted Reactivity Compared to SU Measured Results for Configuration 2
VII. CONCLUSION
A critical experiment was performed with HEU and YHx at the NCERC, which is operated by LANL. The purpose of the experiment was to determine the change in reactivity with increases in temperature. The experiments used electric heaters to reduce competing effects from nuclear heating. Measurements of reactivity changes with temperature for two different configurations of material were obtained, and initial results show that the positive temperature coefficient is on average less than the predicted values with simulated cross sections. This result could be beneficial for reactor designers, who will need less negative offsets to make the overall temperature coefficient of potential microreactors using YHx negative, but still needs to be assessed in higher-fidelity multiphysics models to include expansion of the materials in the system and other effects.
Acknowledgments
This work was supported by the DOE Nuclear Energy Microreactor Program under Advanced Reactor Technologies. The critical experiment was performed at the NCERC, which is supported by the DOE Nuclear Criticality Safety Program, funded and managed by the National Nuclear Security Administration for the DOE. The experiment was planned, and the YHX were discs manufactured under the LANL Laboratory-Directed Research and Development direct research project 20150058DR, “Multi-Scale Kinetics of Self-Regulating Nuclear Reactors.” The authors thank Thomas Godfrey for the heaters that were modified for this experiment.
Disclosure Statement
No potential conflict of interest was reported by the authors.
Additional information
Funding
Notes
a MCNP® and Monte® Carlo N-Particle are registered trademarks owned by Triad National Security, LLC, manager and operator of LANL. Any third party use of such registered marks should be properly attributed to Triad National Security, LLC, including the use of the designation as appropriate. For the purposes of visual clarity, the registered trademark symbol is assumed for all references to MCNP within the remainder of this paper.
References
- V. K. MEHTA et al., “Evaluation of Yttrium Hydride Thermal Neutron Scattering Laws and Thermophysical Properties,” LA-UR-20-26691, Los Alamos National Laboratory (2020).
- H. TRELLUE et al., “Simulation of Microreactor Design with Graphite Core Block, TRISO Fuel, Heat Pipes, and Yttrium Hydride Moderator, U.S. Provisional Patent Application 1620.0121P, DOE Reference S-133,840.000, LA-CP-20-20306, Los Alamos National Laboratory (2020).
- D. BUDEN, Tenth Anniversary Book for Symposium on Space Nuclear Power and Propulsion, Idaho National Engineering Laboratory (1993).
- R. SANCHEZ et al., “A New Era of Nuclear Criticality Experiments: The First 10 Years of Planet Operations at NCERC,” Nucl. Sci. Eng., 195, 1S, 1 (2021); https://doi.org/10.1080/00295639.2021.1951077.
- T. GOORLEY et al., “Initial MCNP6 Release Overview: MCNP6 Version 1.0,” Nucl. Technol., 180, 298 (2012); https://doi.org/10.13182/NT11-135.
- R. W. BREWER, “Critical Experiments Performed Using Plates of Plutonium-242, HEU, and Plutonium-239,” International Criticality Safety Benchmark Evaluation Project, SPEC-MET-FAST-004, Nuclear Energy Agency (1998).
- D. V. RAO, A. J. FALLGREN, and T. E. CUTLER, “Multi-scale Kinetics of Small Compact Reactors Measurement of Neutron Kinetics of Hydride Moderated Very High Temperature Reactors,” LA-UR-17-22047, Los Alamos National Laboratory (2017).
- H. R. TRELLUE et al., “Advancements in Yttrium Hydride Moderator Development,” LA-UR-21-24354, Los Alamos National Laboratory (2021).
- G. E. HANSEN et al., “Beryllium Reflected, Graphite-Moderated Critical Assemblies,” LA-2141, Los Alamos National Laboratory (1957).
- I. CIESIELSKA-WROBEL, Finite Element Modeling of Textiles in Abaqus™ CAE, Chap. 1, pp. 1–11, CRC Press, Boca Raton, Florida (2020).
- R. B. WILKERSON, “ENDF850xs: ACE-Formatted ENDF/B-VIII.0 Neutron Cross Sections at 50 Temperature Evaluations,” LA-UR-19-20407, Los Alamos National Laboratory (Jan. 2019).
- “Abaqus 6.14,” BS Simulia; http://130.149.89.49:2080/v6.14/ (current as of Aug. 23, 2021).
- J. R. LAMARSH and A. BARATTA, Introduction to Nuclear Engineering, 4th ed., Pearson (2018).
- V. K. MEHTA et al., “Capturing Multiphysics Effects in Hydride Moderated Microreactors Using MCNP and ABAQUS,” LA-UR-21-20451, Los Alamos National Laboratory (2021).