
Abstract
Postirradiation examination of nuclear fuel is routinely performed to characterize the important properties of current and future fuel. Gamma emission tomography is a proven noninvasive technique for this purpose. Among various measurement elements of the technique, a gamma-ray detector is an important element whose spectroscopic abilities and detection efficiency affect the overall results. Finding a combination of high detection efficiency and excellent energy resolution in a single detector is often a challenge. We have designed a novel planar segmented high-purity germanium detector that offers simultaneous measurement in six lines of sight with excellent energy resolution. The simultaneous detection ability enables faster data acquisition in a tomographic measurement, which may facilitate achieving higher spatial resolution. In this work, we have demonstrated the first use of the detector by performing a full tomographic measurement of mockup fuel rods. Two methods of detector data analysis were used to make spectra, and the images (tomograms) were reconstructed using the filtered back projection algorithm. The reconstructed images validate the successful use of the detector for tomographic measurement. The use of the detector for real fuel measurement is being planned and will be performed in the near future.
I. INTRODUCTION
Gamma emission tomography (GET) is a noninvasive technique to characterize nuclear fuel properties[Citation1–6] postirradiation in a nuclear reactor. It is also used at some test reactor sites to study the performance of existing and new fuel under different operating scenarios. Furthermore, the technique is also used for nuclear safeguards[Citation7–13] purposes. With the help of a collimator and gamma-ray detector(s), gamma-ray intensities emitted by an irradiated fuel test rig or fuel assembly are measured at various rotational and lateral positions, and using image reconstruction methods, a two-dimensional (2D) cross-sectional image is constructed.
In this work, the first use of a novel planar segmented high-purity germanium (HPGe) detector for GET is reported. Two methods were employed for the analysis of the detector data. However, the primary objective is to showcase the application of the detector for GET measurements rather than to compare the analysis methods. A full scan of three mockup fuel rods was performed using a multi-slit collimator and the planar segmented HPGe detector, and the 2D image was reconstructed using the filtered back projection (FBP) method.
Various fuel performance parameters[Citation1] such as burnup distribution, power distribution, fission product migration, etc., can be obtained by performing a GET measurement. The reconstructed image represents a spatial distribution of the activity of a chosen nuclide[Citation1] (137Cs, 140Ba/140La, 85Kr, 135Xe, etc.) within fuel that correlates with the irradiated fuel property(ies). However, some nuclides have a rather short half-life, e.g., 140Ba/140La (half-life 140Ba = 13 days/half-life 140La = 40 h). Therefore, to be able to use the peaks of such short-lived nuclides for tomography purposes, a measurement needs to be performed within a few weeks after the end of irradiation. Since a gamma spectrum of freshly irradiated fuel contains many closely lying peaks from different nuclides, a detector with good energy resolution (for accurate spectroscopic analysis of the peaks) is required for such measurements.
The level of detail or the spatial resolution of the reconstructed image depends on various elements of the measurement process (collimator, detector, number of projections, etc.), which are decided as per the user requirements. In some cases, a higher spatial resolution is desired to achieve better fuel characterization capabilities.
Obtaining a larger number of projections using a collimator with a narrower slit (slit width of 0.1 mm or less) can help in achieving the desired spatial resolution. However, a narrower slit significantly reduces the input count rate in the detector, which in turn can lead to impractically long measurement times.[Citation14,Citation15] Therefore, there is a need to make the measurement process more efficient and faster to achieve the desired spatial resolution. Utilizing a gamma-ray detector with high detection efficiency can speed up the data collection to an extent. A further increase in the data collection speed requires the use of a multi-slit collimator to acquire data at multiple positions simultaneously. Also, it should be remembered that depending on the measurement scenario, a detector with good energy resolution may still be required as described above.
There are two types of detectors used for gamma-ray spectroscopy: scintillators (BGO, NaI, CsI, etc.) and semiconductors (CdZnTe, Ge, etc.). Scintillators provide high detection efficiency due to their high density and atomic number, even when using relatively small crystals. This characteristic becomes particularly advantageous for achieving faster data acquisition when multiple scintillator detectors are employed in conjunction with a multi-slit collimator. On the other hand, while scintillators with good energy resolution (less than 3% at 662 keV[Citation16]) are now available, they cannot match the energy resolution capabilities of semiconductors. Hence, when considering applications with high energy resolution requirements, semiconductors are better suited compared to scintillators. Especially HPGe detectors, which have the best energy resolution among all commercially viable semiconductors. However, to achieve a reasonable detection efficiency using an HPGe detector, a large-volume crystal is required, which may result in a big and bulky detector. Therefore, these detectors are not suited for combining with a multi-slit collimator to a detector array.
Therefore, to satisfy the need for faster data acquisition using a multi-slit collimator and excellent energy resolution, segmented HPGe detectors can be an ideal choice. One segmented HPGe detector can substitute multiple physically separated detectors, enabling simultaneous examination of a fuel object using a multi-slit collimator.
Segmented HPGe detectors are commonplace in gamma-ray tracking[Citation17–20] applications. These detectors are made by electrical segmentation of one or both charge-collecting electrodes of a monolithic HPGe crystal. The segmentation pattern allows for tagging the subvolume of the detector for any gamma-ray interaction that takes place in it. We have proposed and studied[Citation15] the feasibility of using such a segmented HPGe detector for a GET measurement. For the experimental demonstration, a scaled-down prototype planar segmented HPGe detector was proposed[Citation14] and experimentally evaluated.[Citation21]
The first demonstration of the prototype detector for a GET measurement was performed at BETTAN.[Citation22] BETTAN is a tomographic test bench at Uppsala University made for the testing of detectors and methods used in nuclear fuel GET inspections. Gamma-ray intensities from three mockup fuel rods (containing 137Cs) were measured at various positions (lateral and rotational), and the detector data were analyzed using the method described in Refs. [Citation15] and [Citation21]. The reconstructed image successfully demonstrates that the detector can be used for a GET measurement.
II. DETECTOR AND DATA ANALYSIS METHODS
The full details of the detector are described in Ref. [Citation21]. It is a planar segmented HPGe detector with the front electrode segmented in a total of seven segments as shown in . The back electrode is unsegmented and can provide full volume information of the detector. Output from each segment and the back electrode was read individually using a CAEN V1782 eight-channel digital multichannel analyzer, which provides data in list mode with energy and timestamp of each event, in separate files for each segment.
Fig. 1. Schematic diagram of the detector crystal.[Citation21] The detector is segmented into a total of seven segments, and the full volume information is obtained from the back unsegmented electrode.
![Fig. 1. Schematic diagram of the detector crystal.[Citation21] The detector is segmented into a total of seven segments, and the full volume information is obtained from the back unsegmented electrode.](/cms/asset/98b15473-888d-4fb2-8163-8ad69d2639b6/unct_a_2236882_f0001_oc.jpg)
In the tomographic measurement, the detector was used with a multi-slit collimator whose slits were aligned with and centered on the respective segments (1 to 6). Two methods[Citation15] were used to analyze the detector data in the off-line mode, and spectra for each slit position were obtained.
In the first method, Method-A, two types of events were used to make spectra at each slit position: 1-fold events in each small segment (1 to 6) and 2-fold coincident events in each pair of a small segment (1 to 6) and segment 7. All the higher-fold (fold refers to segment multiplicity) events were thus discarded.
Using the second method, Method-B, all the events were utilized to make spectra at each slit position. Therefore, all the events from segment multiplicity 1 to 7 were included in the spectra, except the events depositing energy only in segment 7. An event is localized to the segment (1 to 6) where the most energy was deposited. The total energy of an event is obtained by summing the energy deposited in all hit segments. A trigger threshold of 10 keV (per segment) was used to filter noise and false multifold events in the off-line data analysis mode. The net counts under the peak were determined using peak area determination using extended background regions as described in Ref. [Citation23] using the spectra corresponding to each segment 1 to 6.
III. EXPERIMENTAL SETUP
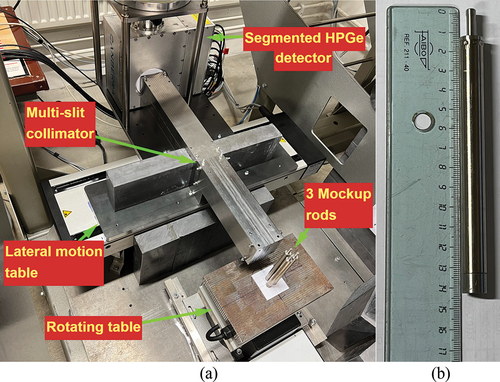
The experiment was performed at BETTAN[Citation22] (tomography test bench of Uppsala University). A picture of the test bench is shown in . The test bench consists of a rotating magnetic table on which the three mockup fuel rods were placed and a lateral motion table on which the collimator-detector system was mounted to collect projection data at every rotation angle. The magnetic function kept the rods upright and stable during the rotations. The lateral motion of the collimator-detector system and the rotational motion of the magnetic table were controlled by custom-made software using LabVIEW.
Fig. 2. (a) BETTAN tomography test bench at Uppsala University. The planar segmented HPGe detector and a two-part multi-slit collimator were mounted on the lateral motion table. Three mockup fuel rods are also seen in the picture, placed on the rotating magnetic table. (b) Picture of an empty mockup fuel rod.
III.A. Mockup Fuel Rods
The mockup fuel rods were manufactured from sealed tubes made of titanium, filled with bronze granulate that contains 137Cs.[Citation22] A picture of an empty mockup fuel rod is shown in . Originally, the mockup rods were manufactured approximately 20 years ago for the purpose of conducting tomographic measurements on nuclear fuel assemblies. The goal was to verify core simulators on a fuel rod level,[Citation22] specifically by validating the calculated power distribution. An effective indicator for this validation is the distribution of 140Ba/140La within the rod, as it strongly correlates with the power.[Citation22] To determine this distribution, the intensity of 1596-keV photons emitted from the decay of 140La is utilized.
However, it was challenging to manufacture model fuel rods consisting of actual fuel materials. As a result, it was decided to use rods containing 137Cs. The gamma decay energy from 137Cs is 662 keV, which is significantly lower than that of 140Ba/140La. To accommodate this difference, a rod filling material was selected to mimic the attenuation coefficient of 1596-keV gamma radiation in the authentic materials. The attenuation coefficients[Citation22] for 1596-keV photons in UOX fuel material and Zircaloy cladding are 0.560 and 0.298 cm−1, respectively. On the other hand, the attenuation coefficients for 662-keV photons in bronze granulate and titanium are 0.381 and 0.342 cm−1, respectively.
In total, 70 rods were manufactured, with activity levels ranging from 54% to 126% of the average activity. As of June 2006, the combined activity of all 70 rods was measured to be 1 Ci. For the demonstration, three rods were randomly selected. However, it was observed that one rod had an activity of approximately half that of the other two rods. The dimensions and material details of the mockup fuel rods are given in .
TABLE I Material Details and Dimensions of the Mockup Fuel Rods
III.B. Collimator
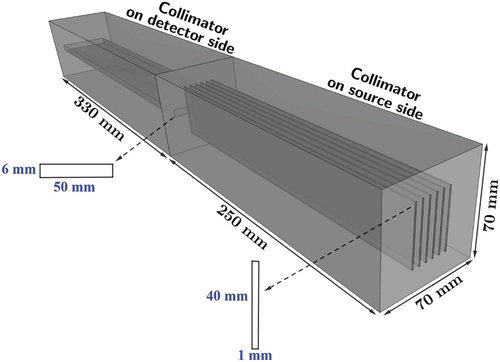
The collimator was manufactured in two adjacent parts. The front part on the source/mockup fuel rods side has six rectangular slits (1 mm wide and 40 mm high), and the back part facing the detector has a single wider slit (50 mm wide and 6 mm high). A schematic diagram of the two-part collimator is shown in . The choices of collimator material and dimensions were based on the experimental constraints. It was not possible to place the detector closer to the mockup fuel rods due to some dimensional mismatch between the detector dewar and the test bench structure; therefore, a longer collimator than had been originally planned was used. The structural steel (S355) material is less attenuating than, e.g., tungsten but offers sufficient attenuation (of the order of 10−15) of unwanted gamma rays due to the considerable length. The dimensions of the collimator are given in .
TABLE II Collimator (Two-Part) Dimensions
Fig. 3. Schematic diagram of the two-part multi-slit collimator. The collimator was made of S355.
III.C. Mockup Fuel Rod Arrangement, Projections, and Reconstruction
The three mockup fuel rods were arranged in a manner as shown in . The rods were placed such that a gap of 2 mm was maintained between their surfaces, and the center of each rod was at an equal distance (8.1 mm) from the center of rotation of the magnetic table. The front face of the front collimator was at a distance of 43 mm from the center of rotation. There was no specific reason for selecting this distance except to allow for some spacing between the rods and the collimator in case more than three rods needed to be scanned.
Fig. 4. Schematic diagram of the arrangement of mockup fuel rods on the rotating magnetic table.
To obtain the projections, the collimator-detector system was moved in a step interval of 1 mm, and the magnetic table was rotated at a 6-deg angular step. The use of the segmented HPGe detector made it possible to examine six positions simultaneously: In total, a 30-mm lateral distance was scanned in just five steps, and at every lateral step, 60 angular positions were scanned. The total number of angular positions was determined based on the minimum requirement to mitigate aliasing artifacts.[Citation24] This requirement is equal to π/2 times the total number of lateral scan points in each projection. This translates to approximately 47 projections; however, for ease of use, 60 were chosen. For each angular position, data acquisition was run for 12 min. The acquisition time at each angular position was fixed to obtain at least 1000 net peak counts at the central lateral scan position. Assuming the counts follow Poisson distribution, with 1000 counts, the uncertainty is approximately 3%, which was considered sufficient to minimize the noise in the reconstructed image. The scan parameters are given in . The image (tomogram) reconstruction was performed using the FBP algorithm with the Hann filter from the scikit image[Citation25] processing module in Python.
TABLE III Scan Parameters*
IV. RESULTS
IV.A. Sinogram Using Method-A, and Image Reconstruction
The data obtained from the digitizer were analyzed to obtain 1-fold (only in small segments 1 to 6) and 2-fold (coincident events in a small segment and segment 7 pairs) events for each slit position. Crosstalk corrections as described in Ref. [Citation21] were performed on 2-fold events, and a total spectrum (of 1 and corrected 2-fold events) for each slit position was obtained. To determine the net counts under the 661.7-keV peak, regions of interest (ROIs) for peak and background counts were selected. The ROI was selected based on a summed spectrum that was obtained by summing many spectra binwise. The peak ROI and the lower and upper background ROIs of segment 4 are shown as an example in . The net counts under the 661.7-keV peak thus obtained for each slit position were used to construct the sinogram, which is shown in . The total peak counts used in the sinogram were 0.55% of the total counts from all the spectra.
Fig. 5. Illustration of the determination of net counts under the 661.7-keV peak. For example, multiple spectra of segment 4 were summed (binwise) to determine the peak region and lower and upper background regions from the resulting spectrum. (a) Example of a summed spectrum of many segment 4 spectra that were obtained using Method-A. (b) Example of a summed spectrum of many segment 4 spectra that were obtained using Method-B. Please note that while the peak in the resulting summed spectrum may appear wider due to variations in each spectrum, a single spectrum at a specific position has a full-width at half-maximum of around 2 keV at 662 keV.
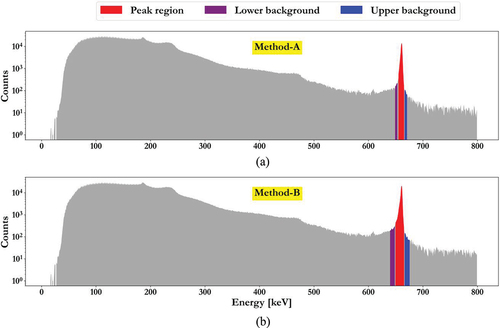
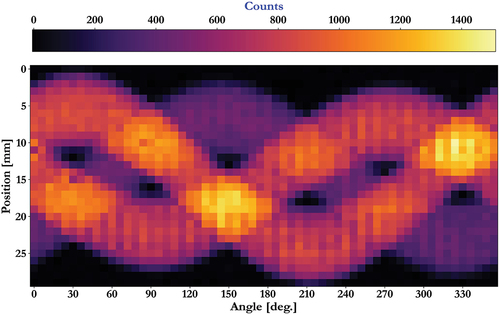
Fig. 6. Sinogram obtained from peak counts under 661.7 keV using Method-A.
The FBP image (tomogram) of the rods is shown in . The lower activity of one rod is visible in the tomogram.
IV.B. Sinogram Using Method-B, and Image Reconstruction
In Method-B, events with all possible values of segment multiplicity (except those that deposited energy only in segment 7) were used to make a spectrum at each slit position. Localization and total energy for each event were obtained as described in Sec. II. The approximate percentage values of different segment multiplicities of the counts under the 661.7-keV peak are given in .
TABLE IV Different Segment Multiplicities of the Counts Under the 661.7-keV Peak
The crosstalk effects for the 2-fold events between small segment pairs were found negligible. Crosstalk corrections to other 2-fold events (in a small segment + segment 7) were performed as described in Ref. [Citation21], which is the same as performed when using Method-A. Similarly, crosstalk corrections to 3-fold events were also made. However, no crosstalk correction was made to the events with segment multiplicity of ≥4 because of their very small contribution to the peak counts. A total spectrum including all the corrected and uncorrected events was made for each slit position, and the net counts under 661.7 keV were determined in the same way as described in Sec. IV.A. The sinogram constructed from the net counts is shown in . The total peak counts used in the sinogram were 0.83% of the total spectrum counts from all the spectra. The image reconstructed from the sinogram using the FBP algorithm is shown in . Since all the events were accepted using Method-B, an increase of more than 30% in the net peak counts was observed.
Fig. 7. Sinogram obtained from peak counts under 661.7 keV using Method-B.
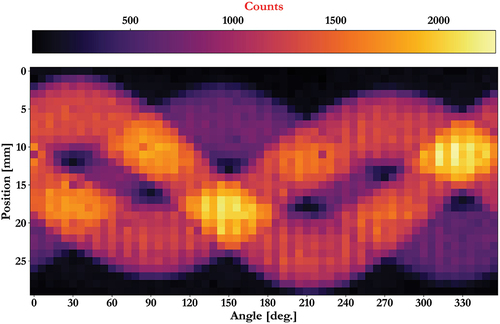
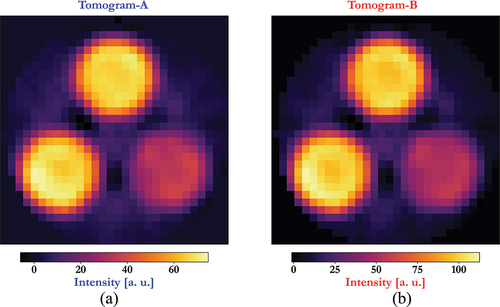
Fig. 8. Reconstructed images (tomograms) of the three mockup fuel rods from the sinograms; images were reconstructed using the FBP algorithm employing the Hann filter. (a) Tomogram from the sinogram shown in . (b) Tomogram from the sinogram shown in .
V. DISCUSSION AND OUTLOOK
The two detector data analysis methods employed in this study produced qualitatively similar images, with the second tomogram exhibiting higher intensity due to the utilization of Method-B, which employs higher peak counts. However, it is important to note that Method-B, which incorporates all full-energy peak events, may result in a higher rate of mislocalized events (as reported in Ref. [Citation15] for the true coaxial design), ranging from 7% to 10% at 662 keV. Since the reconstructed images are qualitative and based on the FBP method, which neglects factors like field-of-view divergence, self-attenuation of gamma rays, the impact of mislocalization cannot be quantified.
Nevertheless, Method-B offers an advantage of over 30% increase in net peak counts, enabling potential reduction in overall measurement time. This advantage is particularly valuable when the primary objective is qualitative reconstruction. Alternative data analysis methods as suggested in Refs. [Citation15] and [Citation26] are also viable options. For quantitative reconstruction, the simple FBP algorithm used in this work will need to be replaced by methods that consider also the strong attenuation of gamma rays in nuclear fuel, such as Siltanen[Citation9,Citation11,Citation13,Citation27] and UPPREC,[Citation28] which is planned for future work. An in-depth comparison of different methods, specifically focusing on quantifying the effects of mislocalization and performance optimization, is planned for future work.
This detector is a scaled-down prototype version of the proposed true coaxial segmented HPGe detector[Citation15]; although different in shape and dimensions, both have a common mode of operation. Therefore, the successful demonstration of the prototype strongly motivates the materialization of the large volume true coaxial segmented HPGe detector for postirradiation examination of nuclear fuel. The use of the prototype detector for real fuel measurement is currently under consideration at hot cell facilities. In addition, the use of similar segmented position-sensitive CZT and HPGe detectors is currently being evaluated for future use in GET for partial defect verification in nuclear safeguards inspections, e.g., before encapsulation at a geological repository.
VI. CONCLUSIONS
A full tomographic measurement was performed using a novel planar segmented HPGe detector, a multi-slit collimator, and three mockup fuel rods. This was the first experimental demonstration of such a detector for a GET measurement. The sinograms and the reconstructed images successfully demonstrate the detector’s ability for simultaneous data acquisition at multiple positions. Therefore, using such a segmented HPGe detector can speed up the data acquisition in a GET measurement, with the improvement in the speed depending on the number of detection elements (segmentation), the size of the detector, and the method of detector data analysis.
Acknowledgments
We would like to express our gratitude to Stefan Isaksson from Gammadata Instruments AB for lending the high voltage power supply system and NIM bin for the detector.
Disclosure Statement
No potential conflict of interest was reported by the author(s).
Additional information
Funding
References
- S. HOLCOMBE, S. JACOBSSON SVÄRD, and L. HALLSTADIUS, “A Novel Gamma Emission Tomography Instrument for Enhanced Fuel Characterization Capabilities Within the OECD Halden Reactor Project,” Ann. Nucl. Energy, 85, 837 (Nov. 2015); https://doi.org/10.1016/j.anucene.2015.06.043.
- S. JACOBSSON SVÄRD, “A Tomographic Measurement Technique for Irradiated Nuclear Fuel Assemblies,” Doctoral Thesis, Uppsala University (2004); http://urn.kb.se/resolve?urn=urn:nbn:se:uu:diva-4227.
- S. CARUSO and F. JATUFF, “Design, Development and Utilisation of a Tomography Station for γ-Ray Emission and Transmission Analyses of Light Water Reactor Spent Fuel Rods,” Prog. Nucl. Energy, 72, 49 (Apr. 2014); https://doi.org/10.1016/j.pnucene.2013.09.007.
- S. CARUSO et al., “Nondestructive Determination of Fresh and Spent Nuclear Fuel Rod Density Distributions Through Computerised Gamma-Ray Transmission Tomography,” J. Nucl. Sci. Technol., 45, 8, 828 (Aug. 2008); https://doi.org/10.1080/18811248.2008.9711484.
- P. JANSSON et al., “A Device for Nondestructive Experimental Determination of the Power Distribution in a Nuclear Fuel Assembly,” Nucl. Sci. Eng., 152, 1, 76 (2006); https://doi.org/10.13182/NSE06-A2565.
- J. DIAZ et al., “X-Ray and Gamma-Ray Tomographic Imaging of Fuel Relocation Inside Sodium Fast Reactor Test Assemblies During Severe Accidents,” J. Nucl. Mater., 543, 152567 (Jan. 2021); https://doi.org/10.1016/j.jnucmat.2020.152567.
- T. WHITE et al., “Application of Passive Gamma Emission Tomography (PGET) for the Verification of Spent Nuclear Fuel,” Proc. INMM 59th Annual Conf., Baltimore, Maryland, July 2018, Institute of Nuclear Materials Management (2018).
- M. MAYOROV et al., “Gamma Emission Tomography for the Inspection of Spent Nuclear Fuel,” Proc. 2017 IEEE Nuclear Science Symp. and Medical Imaging Conf. (NSS/MIC), Atlanta, Georgia, October 21–28, 2017, IEEE (2017); https://doi.org/10.1109/NSSMIC.2017.8533017.
- R. BACKHOLM et al., “Simultaneous Reconstruction of Emission and Attenuation in Passive Gamma Emission Tomography of Spent Nuclear Fuel,” Inverse Probl. Imaging, 14, 2, 317 (2020); https://doi.org/10.3934/ipi.2020014.
- M. FANG et al., “Quantitative Imaging and Automated Fuel Pin Identification for Passive Gamma Emission Tomography,” Sci. Rep., 11, 2442 (Jan. 2021); https://doi.org/10.1038/s41598-021-82031-8.
- P. DENDOOVEN and T. A. BUBBA, “Gamma Ray Emission Imaging in the Medical and Nuclear Safeguards Fields,” The Euroschool on Exotic Beams, Vol. VI, pp. 245–295, S. M. LENZI and D. CORTINA-GIL, Eds., Lecture Notes in Physics, Springer International Publishing, Cham (2022); https://doi.org/10.1007/978-3-031-10751-1_7.
- R. VIRTA et al., “Improved Passive Gamma Emission Tomography Image Quality in the Central Region of Spent Nuclear Fuel,” Sci. Rep., 12, 12473 (July 2022); https://doi.org/10.1038/s41598-022-16642-0.
- R. VIRTA, “Fuel Rod Classification from Passive Gamma Emission Tomography (PGET) of Spent Nuclear Fuel Assemblies,” ESARDA Bull., 61, 10 (Dec. 2020); https://doi.org/10.3011/ESARDA.IJNSNP.2020.8.
- V. RATHORE et al., “Calculation of Spatial Response of a Collimated Segmented HPGe Detector for Gamma Emission Tomography by MCNP Simulations,” IEEE Trans. Nucl. Sci., 69, 714 (2022); https://doi.org/10.1109/TNS.2022.3152056.
- P. ANDERSSON et al., “Simulation of the Response of a Segmented High-Purity Germanium Detector for Gamma Emission Tomography of Nuclear Fuel,” SN Appl. Sci., 2, 271 (Jan. 2020); https://doi.org/10.1007/s42452-020-2053-4.
- M. CIEMAŁA et al., “Measurements of High-Energy γ-Rays with LaBr3:Ce Detectors,” Nucl. Instrum. Methods Phys. Res. Sect. A, 608, 1, 76 (Sep. 2009); https://doi.org/10.1016/j.nima.2009.06.019.
- S. AKKOYUN et al., “AGATA—Advanced GAmma Tracking Array,” Nucl. Instrum. Methods Phys. Res. Sect. A, 668, 26 (Mar. 2012); https://doi.org/10.1016/j.nima.2011.11.081.
- S. PASCHALIS et al., “The Performance of the Gamma-Ray Energy Tracking In-Beam Nuclear Array GRETINA,” Nucl. Instrum. Methods Phys. Res. Sect. A, 709, 44 (May 2013); https://doi.org/10.1016/j.nima.2013.01.009.
- A. CAFFREY, “The Development and Evaluation of a Compton Camera for Imaging Spent Fuel Rod Assemblies,” PhD Thesis, University of Liverpool (2019); https://livrepository.liverpool.ac.uk/3070060.
- E. J. RINTOUL, “Characterisation of an Electrically Cooled Planar Germanium Detector for Use in the GRI+ Compton Camera System,” PhD Thesis, University of Liverpool (2020); https://livrepository.liverpool.ac.uk/3106394/1/200777228_Nov2020.pdf.
- V. RATHORE et al., “Experimental Evaluation of the Performance of a Novel Planar Segmented HPGe Detector for Use in Gamma Emission Tomography,” Nucl. Instrum. Methods Phys. Res. Sect. A, 1049, 168073 (Jan. 2023); https://doi.org/10.1016/j.nima.2023.168073.
- P. JANSSON et al., “A Laboratory Device for Developing Analysis Tools and Methods for Gamma Emission Tomography of Nuclear Fuel,” Proc. 35th ESARDA Annual Mtg., Bruges, Belgium, May 27–30, 2013, European Safeguards Research & Development Association (2013); http://urn.kb.se/resolve?urn=urn:nbn:se:uu:diva-200707.
- G. GILMORE, “Statistics of Counting,” Practical Gamma-Ray Spectrometry, 2nd ed., Chap. 5, pp. 101–126, Wiley, West Sussex (2011).
- A. C. KAK and M. SLANEY, Principles of Computerized Tomographic Imaging, IEEE Press (1988).
- S. VAN DER WALT et al., “Scikit-Image: Image Processing in Python,” PeerJ, 2, e453 (June 2014); https://doi.org/10.7717/peerj.453.
- V. RATHORE et al., “Geometrical Optimisation of a Segmented HPGe Detector for Spectroscopic Gamma Emission Tomography—A Simulation Study,” Nucl. Instrum. Methods Phys. Res. Sect. A, 998, 165164 (2021); https://doi.org/10.1016/j.nima.2021.165164.
- R. VIRTA et al., “Reconstructing Activity and Attenuation of a Spent Fuel Assembly from Passive Gamma Emission Tomography (PGET) Measurements,” Proc. 2020 IEEE Nuclear Science Symp. and Medical Imaging Conf. (NSS/MIC, Boston, Massachusetts,) October 31–November 7, 2020, IEEE (2020); https://doi.org/10.1109/NSS/MIC42677.2020.9507762.
- P. ANDERSSON and S. HOLCOMBE, “A Computerized Method (UPPREC) for Quantitative Analysis of Irradiated Nuclear Fuel Assemblies with Gamma Emission Tomography at the Halden Reactor,” Ann. Nucl. Energy, 110, 88 (Dec. 2017); https://doi.org/10.1016/j.anucene.2017.06.025.