
 ?Mathematical formulae have been encoded as MathML and are displayed in this HTML version using MathJax in order to improve their display. Uncheck the box to turn MathJax off. This feature requires Javascript. Click on a formula to zoom.
Abstract
Natural analogues are systems that have evolved over geological timescales with features similar to one or several components of a deep geological repository (DGR). Natural analogues complement short-duration laboratory studies since they are existing reflections of many long-term processes that might affect the performance of a repository. Mathematical models are often used for the post-closure safety assessment of a DGR. Confidence in the models’ predictions is enhanced when the models successfully simulate the past evolution of a natural analogue. This paper summarizes the Canadian Nuclear Safety Commission’s (CNSC’s) recent research on natural analogues to inform on (1) glacial erosion, (2) engineered barrier system, and (3) uranium reactive transport in the context of DGRs for radioactive wastes. Glaciation and its erosion are prominent factors impacting the performance of future DGRs at high latitudes in the northern hemisphere. The authors have reviewed the field data from the Greenland Analogue Project, developed a conceptual and mathematical model for the simulation of the thermal conditions within the Greenland ice sheet, as well as the thermal-hydraulic conditions at its base and the ice sheet velocity, and eventually estimated the erosion rate at the site.
The Cigar Lake Analogue demonstrates the long-term radionuclide containment capability of the illite clay zone enveloping the ore body, serving as an analogy to the engineered clay barriers. The CNSC and University of Ottawa analyzed 129I in the Cigar Lake core samples, and modeled and correlated the diffusion-dominated transport of radionuclides over the geological evolution of the Cigar Lake deposit. The results provide information on the mobility of fission products and significant radionuclides in conditions analogous to the source, engineered barriers, and near-field host rock of a DGR.
The reactive transport and geochemistry of the Kiggavik-Andrew Lake uranium deposit mineralization and remobilization was another natural uranium deposit analogue studied by the CNSC. A reactive transport model was established according to the conceptualized geochemical processes and run under specified boundary and initial conditions to validate the geochemical processes. The geometry, timing, geochemistry, and fluid composition were used as model constraints.
I. INTRODUCTION
In Canada and many other countries, deep geological disposal is being considered for the long-term management of radioactive waste.[Citation1] The objective is to contain and isolate the waste in a deep geological repository (DGR) at depths of several hundreds of meters in a suitable geological formation for periods of up to 1 million years.[Citation2] A DGR’s ability to isolate and contain radioactive waste over such long timescales must be demonstrated by multiple lines of evidence and arguments documented in a safety case.[Citation3] The safety assessment, an important component of the safety case, quantifies the impact of the DGR on the near-surface environment using mathematical modeling. Much of the data used in the safety assessment are generated by experiments carried out in laboratories, underground research facilities, and site characterization. These data typically encompass spatial-temporal scales (tens of meters and tens of years) that fall short of the ones associated with a DGR (thousands of meters and up to 1 million years). Natural and anthropogenic analogues help bridge this gap (). A natural or anthropogenic analogue is a natural (usually geological) or manmade occurrence that is similar to one or several components of a DGR. They represent part of a DGR system and typically fill the gap in spatiotemporal data obtained from laboratory, underground research facilities, and site characterization.
Fig. 1. Illustration showing how natural and anthropogenic analogues provide information over timeframes and spatial scales beyond what can be provided by experiments and site characterization, but that are commensurate with the time and scale required for demonstrating DGR safety (adapted from Ref. [Citation4]).
![Fig. 1. Illustration showing how natural and anthropogenic analogues provide information over timeframes and spatial scales beyond what can be provided by experiments and site characterization, but that are commensurate with the time and scale required for demonstrating DGR safety (adapted from Ref. [Citation4]).](/cms/asset/9d43c820-f92f-4786-9f8e-9c0bb1ba967c/unct_a_2240160_f0001_oc.jpg)
A detailed review of natural and anthropogenic analogues in the global context for high-level nuclear waste disposal in a DGR has recently been made by Fayek and Brown.[Citation4] A clear definition of natural analogues is provided in that review paper, along with the distinction between natural and anthropogenic analogues. A broad scope of published studies was analyzed as pertinent to analogues to engineered barrier systems (waste package, clay liner, and cement) and natural barriers (host rock and its structural/hydrogeological features), including but not limited to uranium ores, cementitious minerals, speciation, and transport phenomena of uranium or radionuclides in various types of geological structures, etc.[Citation4] Therefore, for a comprehensive understanding of research progress in natural analogues, it is recommended to consult with Ref. [Citation4], which was part of the Canadian Nuclear Safety Commission’s (CNSC’s) independent research effort to protect human health and environment from radioactive wastes. Some other excellent works on natural analogue studies have been published and are valuable resources.[Citation5–9]
Glaciation-induced erosion is an important factor to consider in the safety assessment of DGRs for nuclear waste. Glacial erosion has shaped the ground surface landscape by removing rock and sediment, especially in temperate climates with high precipitation rates.[Citation10] The main processes contributing to glacial erosion are abrasion, plucking, and flow. Abrasion occurs at the base of the sliding ice sheet, and is enhanced by rock debris that are included in the ice. Plucking involves the breakage of bed rocks into smaller pieces, which are further picked up and relocated by the moving ice. Sometimes sliding is used as a representative process contributing to the erosion rate.[Citation11] However, glacial fluvial erosion is always present at the melted glacier base where meltwater flows in a channelized manner with high kinetic energy while carrying finer sediments. Therefore, glacial erosion is a result of coupling between the rheological movement of glacier and meltwater flow, with the latter important according to recent studies.[Citation10]
Indeed, a review of global erosion rates showed that both rivers and glaciers can cause rates of erosion that are comparable to the rates of rock uplift.[Citation12] Erosion may reduce the thickness of overlying host rock, thus compromising its function of isolation and containment for radioactive wastes. Glacial erosion on various landscapes, including valley, polar, and mountain has been extensively investigated.[Citation11,Citation13,Citation14] Erosion rates ranging from micrometer- to centimeter-scale have been observed.[Citation10,Citation13] It is thus challenging to assess the level of glacial erosion of a site based on empirical formula. Therefore, the past and potential future glacial erosion of a target DGR site needs to be characterized in detail. For this purpose, a recent joint study of the Greenland ice sheet was conducted as an analogue to glacial erosion and glacial impact to groundwater flow and hydrochemistry.[Citation15]
This paper summarizes three of CNSC’s recent numerical modeling studies in natural analogues:
The Greenland Natural Analogue Project (NAP), which provides an analogue to the thermal-hydraulic-mechanical regime within a continental ice sheet and its potential for erosion of the underlying bedrock.
The Cigar Lake high-grade uranium deposit, which provides an analogue on radionuclide production, transport, and the long-term performance of the engineered barrier system.
The Kiggavik-Andrew Lake uranium deposit, which provides an analogue to uranium reactive transport in a fractured geological environment.
II. GREENLAND NATURAL ANALOGUE PROJECT
In the past million years, the northern hemisphere has been subjected to many glaciation-deglaciation cycles. At the glacial maximum, the ice sheet thickness reached up to 5 km, imposing loads of 50 MPa on the earth’s crust and depressing its surface by hundreds of meters. The poroelastic response of the host rock to glacial overloading/unloading will cause disturbance to the pore pressure distribution and possibly groundwater exchange in a depth of several hundred meters. The impact to pore pressure is persistent even after the glaciation recedes for thousands of years, e.g., the under-pressure phenomenon in shale formations observed in southern Ontario.[Citation16]
In addition, the advance and retreat of the ice sheet eroded the earth surface and was accompanied by permafrost development and thawing. At glacial retreat, the meltwater created new lakes in depressions and recharged the groundwater. Glacial cycles therefore profoundly altered the surface geomorphology and subsurface environment. Glacial cycles that occurred in the past will cyclically occur again in the future with the next cycle predicted to occur within 50 000 to 100 000 years. The tremendous perturbations imposed by these future glacial cycles will significantly impact the thermal-hydraulic-mechanical-chemical regimes in the host rock and engineered barriers, and therefore, need to be considered in the safety assessment. In particular, the erosion rate of the surface needs to be evaluated since it would reduce the depth of the repository, potentially affecting its isolation function.
The Greenland Analogue Project (GAP) is an international collaborative research project[Citation15] conducted by the Nuclear Waste Management Organization, Posiva, and the Swedish Nuclear Fuel and Waste Management Company, the organizations responsible for geological disposal in Canada, Finland, and Sweden. The objective of GAP is to advance the understanding of processes associated with glaciation. The bedrock in the GAP study area is crystalline, with similarities to the crystalline bedrock in Canada, Finland, and Sweden in terms of composition, fracturing, and age. These characteristics make the study site an appropriate analogue of the conditions that are expected in those countries during future glacial cycles. In the study area, much of the ice bed extending 250 km inward of the margin is implied to be covered by water. The ice overburden hydraulic pressure corresponds to 92% of the annual average ice thickness. The stable isotope profiles indicate penetration of glacial meltwaters at this site to the subglacial bedrock.
II.A. Conceptual Model
Understanding the response of the deep subsurface to glacial forcing requires detailed knowledge of the processes occurring in the supraglacial environment. The subglacial environment can be characterized by a set of variables that act as boundary conditions for models of the geosphere. Examples include temperature, stress, and groundwater pore pressure. Groundwater flow models with appropriate boundary conditions can reveal the heat exchange between the supra and subglacial environments, the flow velocity profile, the infiltration into the bedrock, and its relationship with the ice sheet.
A conceptual model can be developed based on these observations, as shown in . Based on this conceptual model, a mathematical model was developed to simulate the thermo-hydraulic-mechanical (THM) regime in the ice sheet.[Citation14] Phase change and fluid flow were taken into account in the model. Hydraulic flow takes place by melting of ice and its subsequent gravitational flow from the surface of glacier under solar radiation and convective heat flux from air. The flow process was found to be crucial to successfully reproducing the pattern of seasonal temperature swings of the ice body in shallow depths. Numerous iterations of the numerical model were run in COMSOL to search for the best model parameters within a known set of bounding limits. The main model outputs were the temperature and stress distributions in the ice sheet and its displacement velocity. These outputs were compared to the measured field data.
Fig. 2. Conceptual model for thermo-mechanical processes in the GAP ice sheet and its basal conditions.[Citation14]
![Fig. 2. Conceptual model for thermo-mechanical processes in the GAP ice sheet and its basal conditions.[Citation14]](/cms/asset/f4c646ca-96ea-41d7-b6b0-5b9204d2d2e6/unct_a_2240160_f0002_oc.jpg)
The erosion rate of the bedrock underneath the ice sheet is heavily dependent on the temperature, flow rate, and stress distribution at the interface. That erosion rate was estimated by using the temperature, slip rate, meltwater flow rate, and stress results from the THM model as input to empirical equations. The dominant processes of bedrock erosion under an ice sheet are abrasion, plucking and quarrying, and meltwater erosion. For these processes to take place beneath in an ice sheet, at least two conditions need to be met: (1) the base is warm and wet in order to allow meltwater to move rapidly and to allow basal slip and (2) the base is free of sediment to allow ice/rock contact. The total erosion rate Er would then be a combination of these previously mentioned processes,
where Ea is the abrasion rate and Ef is the fluvial erosion rate due to the channelized flow of the subglacial meltwater. The inclusion of the other erosion mechanism, plucking, etc., may lead to increased erosion rates than the one shown here. However, in this study, the plucking effect is not considered because the observed sediment in the field shows a fine grain size with no indication of large blocks of rocks.
II.B. Modeled Temperature Profile at Different Cross Sections
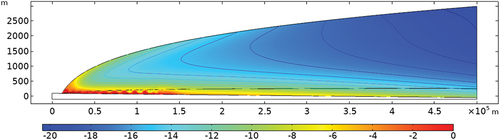
compares the calculated and field-measured temperature profiles at different distances. The model was found to well reproduce the observed trend of temperature distribution with depth. Basal melting was well identified from the modeling results, with about a 10% to 20% thickness of the ice sheet being melted. Ice is in its phase transition stage as the temperature reaches the melting point, and can temporarily remain solid, but not sustain overburden stress, as the ice is most likely floated in the edge region. In , the simulated melting zone reaches about 150 km inward and up to the 1100-m elevation. This is conservative compared to the elevation where surface lakes are observed at 1800 m at the GAP site.
Fig. 3. Temperature profile at the (a) ice divide and (b) ice sheet edge at the GAP site.
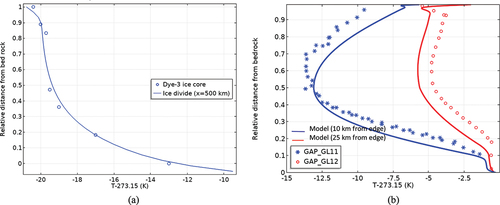
Fig. 4. Modeled ice temperature field along a transect through the GAP area.
II.C. Modeled Ice Sheet Slip Rate
compares the modeled surface ice movement with field observations. The observations were obtained by global positioning system (GPS) monitoring. Since we do not consider in the model the ablation/accumulation that affects the elevation change, only the horizontal velocity is considered for calibration. The modeling results were consistent with the GAP site measurements. The horizontal velocity peaks at about 80 to 100 km inland and decreases gradually to the level of 10 meters per year (m/a) to the ice divide. The GAP report reveals a similar range of supraglacial horizontal velocity of 100 to 400 m/a. It seems, therefore, that the model proposed in this study can adequately reproduce the thermal and deformational behaviors of the ice sheet at the GAP site.
Fig. 5. Simulated horizontal velocity of a glacier on the west coast of Greenland at 67°N and 51°W; negative values indicate movement toward the edge.
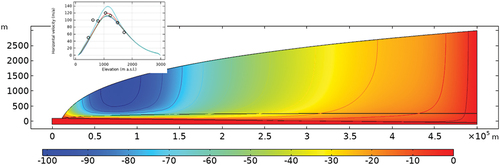
The modeling results suggest a gradual transition of ice velocity from the glacier edge toward the inland (). The glacier edge zone where surface melting starts to penetrate to the ice bed moves fastest, at the level of 100 m/a, which is consistent with the reported annual average value of the GPS measurement. The seasonal variation of temperature enhances the mobility of the ice sheet in summer, which is not considered in our model. Another important observation is the vertical variation of ice mobility. The lower 10% of the ice sheet contributes to ~60% of the surface horizontal velocity.
II.D. Erosion Rate Estimation
The erosion on the base was found to peak near the ice divide, which is mainly due to the extremely high overburden stress. The flow velocity of the ice, even with a friction contact boundary, decreased in magnitude with depth, and reached a minimum at the bedrock interface. The average erosion rate of abrasion for the bed was 0.006 mm/a. This is in good agreement with the reported value of 0.01 mm/a by Ref. [Citation13] . The subglacial erosion due to meltwater flow was calculated to be 0.12 mm/a on average, with a peak of 1.9 mm/a at the ice margin. This is the average value over the 80-km flowline of the melted base, with most of the erosion occurring in the region within 20 km from the ice margin. It is orders of magnitude higher than the predicted abrasion erosion.
II.E. Discussion
A thermal-hydraulic-mechanical-coupled model, as developed in this study, can successfully capture the mobility of an ice sheet that is constrained by the supraglacial and basal elevations and thermal boundary conditions of solar irradiance and air temperatures. Our model can reproduce the ice core temperature profile with satisfying consistency. The obtained temperature field, especially on the ice sheet base, enables a subsequent hydraulic-mechanical-coupled model of the ice sheet/bedrock system. Due to the rheological nature of ice, especially for the polycrystalline ice body in a glacier, the ice velocity is driven by self-weight, modulated by thermal field and topographic slope. The relative slip and meltwater flow upon the subglacial interface causes erosion to the bedrock.
The modeling suggests a warm base extending to about 150 km from the edge. The basal heat flux from both geothermal and frictional heating plays a negligible role in the overall temperature distribution. The geothermal heat flux of 0.5 W/m2 on the ice sheet base is insufficient to cause melting on the interface, as this flux can be quickly dissipated in the body of ice. The warm base is found to be mostly due to meltwater percolating from the glacier surface in warmer seasons.
With an inland distance of 500 km and a glacier height of 3.0 km, the simulated horizontal ice velocity peaked at the level of 100 m/a at 80 to 100 km to the edge, which agrees with the GPS measurement. The vertical distribution of the horizontal ice velocity suggests about 60% of deformation takes place in the lower 10% of the ice thickness, in agreement with various field observations.
Based on the predicted basal slip rate of the ice sheet and the channelized flow rate of the subglacial meltwater, the glacial erosion rate of a specific site can then be estimated with empirical equations by considering the mechanism of abrasion and/or fluvial erosions. Our results indicated the same level of erosion for polar glaciers and thin temperate plateau glaciers on crystalline bedrock.
It is important to note that significant erosion is induced by the rapid flow of meltwater, which transports sediment that enhances erosion. This is always observed at the edge of the glacier melt front where flow velocity and the kinetic energy of transported sediment peak. This may imply that a site subject to repeated and prolonged advance/retreat cycles of glaciation may be prone to higher-than-average erosion rates in the long run. It is also important to be cautious about the length of time a site is likely to host a melt front as it will cause cumulative erosions.
III. CIGAR LAKE NAP ON 129I TRANSPORT
Cigar Lake is an unconformity-type uranium deposit in northern Saskatchewan, Canada. It is located at a depth of approximately 450 m, with no surface expression of its existence.[Citation17–19] The Cigar Lake mineralization is reported to have occurred in several consecutive stages, with the first two stages dated at 1362 Ma and 1287 Ma, respectively, and the last stage of mineralization dated at 293 Ma.[Citation19,Citation20] The deposit is hydrothermal in origin and consists of an irregularly shaped lens about 2150 m long, 25 to 105 m wide, and 1 to 20 m in thickness, located in the sandstone host rocks at the unconformity with the basement gneiss. The average grade of the ore is around 12 wt% U3O8, with maximum concentrations up to 66 wt% U3O8. Hydrothermal alteration of the host sandstone results in an illite-rich clay formation (5 to 30 m in thickness) that envelops the ore zone.[Citation18]
Natural analogue studies at this site were originally initiated by Atomic Energy of Canada Limited in 1982, and then in collaboration with international agencies until 1993, with the aim to address three major issues related to DGRs for high-level radioactive waste: (1) the stability of the uranium ore, (2) the sealing ability of the surrounding clay, and (3) the mobility of chemicals by colloids, organics, and microbes in the vicinity of the ore body over the timescale of billions of years since its formation. The Cigar Lake study generated an excellent conceptualization of the site.[Citation17]
The clay halo was found to effectively seal the preexisting fractures in the underlying basement and overlying sandstone and to keep the uranium ore from contacting groundwater, thus preventing the occurrence of water-rock interactions (dissolution or remobilization) since its formation. Hydrogeological studies revealed that the permeability of the clay-rich zone is 1000 times lower than that of the overlying sandstone, and thus the groundwater only penetrates through the clay zone via small fractures.
The Cigar Lake Analogue Study demonstrated the long-term ability of the clay-based repository environment to retard radionuclide migration. The illite clay zone enveloping the ore body serves as an analogy to the engineered clay barriers, despite the difference in clay minerology with smectite-rich bentonite commonly used in DGR concepts. The fact that the Cigar Lake ore body remained unaltered over 1.3 Ga since formation provides evidence to support the capability of an engineered clay barrier to retard radionuclide migration.
Data generated from the existing Cigar Lake analogue project and the analysis of 129I in the Cigar Lake core samples were obtained by the University of Ottawa[Citation21] and were used to model the behavior of radionuclides over the geological evolution of the Cigar Lake deposit using a solute transport model. The results are useful for better understanding the containment and transport of fission products from their source in an analogous setting to the near field of a DGR.
III.A. Iodine-129 Production
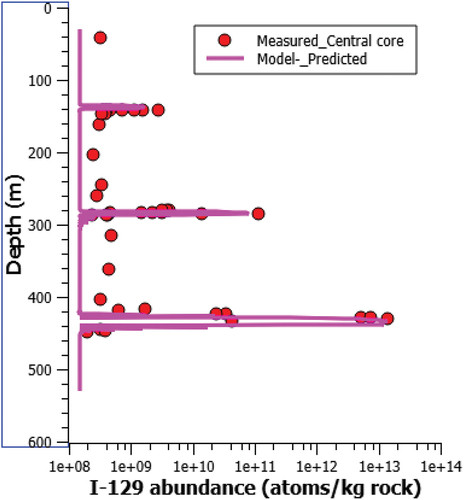
Iodine-129 is produced in situ from the spontaneous fission of 238U and the neutron-induced fission of 235U. In the geological history of uranium ore, the produced 129I is believed to be able to migrate away from its source by diffusion and advection. shows the measured 129I concentrations versus depth reported by Ref. [Citation21] for several cores combined. shows the location of the sampling cores versus the ore body. It is clear that some of the cores intersect either perched ore bodies or penetrate the clay halo and intersect the main ore body and basement. Several cores were also proximal to the ore body, but did not intersect areas with enriched U concentrations.
Fig. 6. (a) Measured 129I concentration versus depth at Cigar Lake (all cores combined) and (b) core location map created with data from CAMECO.[Citation21]
![Fig. 6. (a) Measured 129I concentration versus depth at Cigar Lake (all cores combined) and (b) core location map created with data from CAMECO.[Citation21]](/cms/asset/af88edd8-de3e-4ab1-947f-b64f3c0102d1/unct_a_2240160_f0006_oc.jpg)
The peak atomic concentration of 129I was determined to be around 1E+13 atoms/kg rock at a depth of ~440 m. This number is in agreement with Ref. [Citation17] in which the atomic concentration of 129I in the ore ranges from 5E+9 to 1E+13 atoms/kg. However, Cramer and Smellie[Citation17] also noted the measured 129I concentration was in the lower end of the predicted ranges, at 2 to 3E+12 atoms/kg and 129I/U ratios of 2 to 3E−12.
Therefore, an empirical equation can be developed on the basis of measured 129I/U ratio:
III.B. Modeling
shows the simulation results of the concentration contours after 10 Ma of transport. Under local hydraulic conditions, the 129I released from perched ore bodies forms plumes along the flowline toward the discharge zone. The peak concentration of 129I was found to be associated with the highly enriched orebody inside the clay halo, which thus produces a subhorizontal plume of higher concentration. Under pressure I n the deep formations causes downward (shallow) and horizontal (in depth) flowlines, and then solute flux streamlines. Advection/convection decreases the peak 129I concentration by two orders of magnitude compared to the diffusion-only scenario for the ore body. The downgradient 129I plume has peak concentrations about four to five orders of magnitude less than in the ore body.
Fig. 7. Contour map of 129I concentration in log scale (10 Ma, local hydraulic gradient i = 0.01).
shows the simulated vertical profile of 129I across the ore body and perched ores. The peak concentration at the 450-m depth is related to the main ore body within the clay halo. The other two peak concentrations, at 140 and 280 m, are due to perched mineralization at these elevations. The modeled trend is consistent with the prediction based on core sample testing. The location and magnitude of the peak 129I concentration and the background level are well reproduced. The pulse shape agrees with the measured test data. The peak concentration is well related to the measured source term (in situ concentration of 129I). The rapid decrease from the center of the ore toward the envelope edge resulted from advection around the ore body.
Fig. 8. Comparison of the modeled 129I concentration profile with the measured.
IV. ANDREW LAKE NAP ON REACTIVE TRANSPORT OF URANIUM
IV.A. Uranium Ore at Andrew Lake Site
Within the Andrew Lake uranium deposit, four stages of uranium mineralization and mobilization were identified to have taken place since 1750 Ma until <1 Ma, as inferred from uraninite U–Pb ages.[Citation22,Citation23] What most interests us is the interplay of the hydrogeological and geochemical factors, i.e., permeability of the shear zone, mineral alterations, redox and acidity of pore fluids, etc., which facilitated the deposition and remobilization of uranium at certain points in time. This natural analogue study examined some of the critical factors that promote or prevent radionuclide migration in a DGR setting.
The Andrew Lake deposit is near the southern end of the 30-km-long NE-SW Kiggavik-Andrew Lake trend of uranium deposits in Nunavut, Canada. The Kiggavik geological formation is dominated by metamorphosed and polydeformed ultramafic to felsic volcanic, volcaniclastic, and metasedimentary rocks.[Citation24] Geochronological and geochemical studies have identified a four-phase genetic model for the site,[Citation22] where preexisting faults are associated with later uranium mineralization. Quartz/carbonate veins were observed to first occupy fault systems that were later reactivated as conduits for U-mineralizing fluids.
The four phases related are fully described and characterized in Ref. [Citation21]; the main features related to those phases are briefly summarized here. Phase 1 comprised vein-style uraninite that is associated with illite + hematite and contains variable PbO contents. Phase 2 is characterized by altered uraninite that is associated with coffinite [U(SiO4)1−x(OH)4x]. The alteration of uraninite in phase 3 occurred as centimeter-scale “roll-fronts” (see figures within Ref. [Citation21]), and in phase 4, all three uraninite stages and coffinite were altered to boltwoodite [HK(UO2)(SiO4)·1.5(H2O)].
In the study area of the Andrew Lake site, oxidative leaching of uranium has been observed, therefore raising concerns about the likelihood of a DGR to experience similar oxidative leaching. The origin of the oxidative liquid is under investigation by Canadian researchers in collaboration with the CNSC. Traces of evidence have pointed to glacial meltwater as the potential source of the oxidative liquid. Oxidative leaching of uranium also has been found to be short termed, and the leaching started from fractures through a very limited thickness toward the intact host rock. The leaching fronts have always been found to be parallel with the trend of fractures.
Therefore, we developed a conceptualized one-dimensional (1-D) model to simulate this transport process. Our model also considered the bounding limits of the redox potential (in terms of Eh) variability. In addition, iron-oxide minerals have been found to be coexistent with localized and highly enriched uraninite in proximity, which seems to be a transient nonequilibrium state in the thermodynamic sense. This further inspired our studying the mechanism of coexistence between iron oxide and uraninite, partly because it is analogy to the use of carbon iron to contain uranium in the current design of waste packages for DGRs. The observations from this study will provide information on conditions that promote and/or prevent radionuclide migration in a DGR environment.
IV.B. Batch Equilibrium Simulations
IV.B.1. Effect of Eh on the Distribution of Redox Couples
In a typical roll-front uranium ore deposit type, there exist two major redox couples, i.e., Fe(II)/Fe(III) and U(IV)/U(VI). The variation in percentage of these redox couples with solution redox potential can be illustrated, as shown in . These data were obtained by running an equilibrium batch study of iron and uranium redox couples, respectively. The solution pH was maintained at neutral condition, while the Fe and U concentrations were kept as 1 mM.
Fig. 9. Variation of speciation percentage with solution oxidation-reduction potential Eh for the U(IV)/U(VI) and Fe(II)/Fe(III) redox couples.
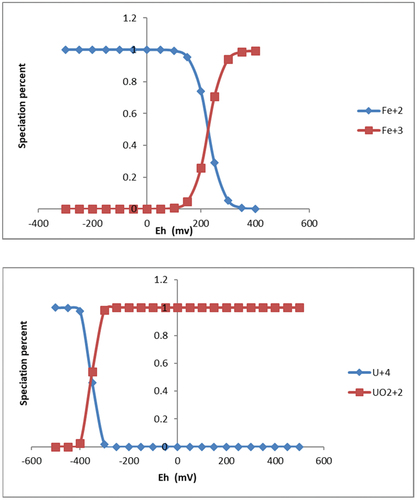
The results clearly showed that Fe(III) was reduced to Fe(II) at Eh 150 to 350 mV and that U(VI) was reduced to U(IV) at Eh −300 to −400 mV. This suggests that iron oxide (e.g., hematite) is unlikely to coexist with UO2 (uraninite) in geochemical equilibrium. This seems in agreement with the fact that hematite and altered uraninite are always observed in separate granular. These two minerals could be sitting very closely to each other, but in respective bands of enrichment, and are never found to be mixed.
The model shows the major speciation of U(IV) is U(OH)4, which takes place in the form of uraninite precipitation, while U(VI) is the combination of ternary complexes Ca2UO2(CO3)3 and CaUO2(CO3)32−.
IV.C. Reactive Transport Modeling
IV.C.1. Hypothetical Process of Redox Evolution and Reactive Leaching of Uranium
According to the genetic model of the Andrew Lake uranium deposit, a key process contributing to uranium mineralization involves acidic/oxidative bleaching of the host rock and iron oxide, resulting in the formation of roll-style uraninite bands.[Citation22,Citation24] Oxidation is known to cause uranium leaching, and thus has significant implications for environmental protection.
In this study, numerical models were designed to evaluate the impacts of redox potential variations on uranium speciation and transport resulting from pulses of oxidative fluid influx, possibly originating from surface waters via interconnected fracture systems. The geometry of the model was that of a fracture (representing the fluid source) embedded in a dense porous media (representing the U-bearing host rock). The pore fluid geochemistry was assigned an Eh of −60 to 240 mV in the presence of the minerals of interest, specifically uraninite and iron oxide. We focused on understanding the transport of chemical species and their contributions to the formation of roll-style mineralization, as observed in the ore samples.[Citation22]
IV.C.2. Chemical Reactions of Major Interest
Uranium and iron were two key elements in our assessment. Geochemical reactions, including dissolution, redox reaction, and hydroxide formation, were the predominant processes. For the purposes of this study, the reaction was considered to be isothermal, and no other thermodynamic parameters were used for the modeling. The host rock was assumed to be chemically unreactive and latent, and acted as a porous media in which the reactive transport happened. It is noted that a sensitivity analysis of the thermodynamic parameters would be beneficial to better understanding the critical controlling factors. This will be included in future studies.
Uraninite is the major form of U(IV) ore. The dissolution reaction of uraninite with carbonate complexes and oxidative agent can be written in the form of
The theoretical dissolution rate used was
where kf and kr are forward and reverse rate constants, respectively. The equilibrium coefficient ksp is related to kf and kr in the form of
The solubility of uraninite and iron oxide have been investigated in a number of experiments, with both reported to be in the range of 10−14 to 10−10 mol/m2 s in aqueous solutions with/without complexing agents.[Citation25–27]
IV.D. Modeling Scenarios
IV.D.1. Case 1: Leaching of UO2 by Oxidative Pore Fluid
A 1-D reactive transport model was developed for the leaching of UO2 by oxidation. A representative element for the uranium ore consisted of a length of 1 m with extra fine meshes. Initial conditions included electron concentration E = 1 M and UO2 = 0.001 M. Calcium and carbonate were also considered in the analysis to assess the performance of carbonate complexation on the leaching performance.
The left boundary was hypothesized to be in contact with an open fracture that supplies the oxidative agent. The boundary condition of the solute concentration was defined as E = 1E−3 M and UO22+ = 2E−15 M, while HCO3 = 3E−4 (same as initial concentration) and 0.01 M was respectively applied to study the effect of carbonate complexation. The right end was confined as impermeable and the zero-flux boundary.
Since the ore rock was granitic and very dense, it was justifiable to assume species transport in terms of diffusion. No convection term was included in the model. Species adsorption and radioactive decay were omitted as well. The diffusion coefficients of the dissolvable species were kept identical and constant.
IV.D.2. Case 2: Long-Term Equilibration of Coexisting UO2 and Fe2O3
A 1-D reactive transport model was developed for long-term equilibration of the UO2 and Fe2O3 that were spaced within the host rock. This model aimed to simulate the reactions that happened during the alteration of U in the third phase of U mineralization at the Andrew Lake site. The geometry consisted of a line of 0.9 m in length, with equal intervals of 0.3 m for each medium. These values were predicted first by batch equilibrium models, and then input into the reactive transport models. Diffusion coefficients for mobile species were defined as the same (Da = 1E−11 m2/s), with hematite and uraninite precipitates in exceptions with Da = 0. The boundaries were impermeable with no flux. The model was run for 1000 years for the current study; this could be easily upscaled to cover longer time periods.
IV.E. Results and Discussions
IV.E.1. Oxidative Leaching of Uraninite Enhanced by Carbonate Complexation
plots the concentrations of species versus depth perpendicular to the fracture plane as a result of oxidative leaching of uraninite under two boundary conditions, with and without available carbonate. With time elapsed, electron consumers (oxygen, for example) migrated into the ore body, increasing the redox potential. The concentration of UO22+ increased to a peak of 1E−6 mol/m3. The calcium carbonate (calcite) was found to dissolve gradually. The released calcium and carbonate were made available for complexing U(VI), with the peak concentration of CaUO2(CO3)3 predicted to be 5 mol/m3. The level of uranium carbonate complexes was far greater than the dissolved UO22+, suggesting a comparatively high binding capacity of carbonate with U(VI). Excess carbonate at 0.01 mol/m3 was found to increase the amount of UO2 dissolution from 4.5 of the reference case to 55 mol/m3. This enhanced dissolution was obtained with the identical dissolution rate constant, which suggests that the dissolution kinetics adopted in the model were able to reflect the effect of the complexing ligand. UO22+ was found to decrease by three orders of magnitude to the level of 5E−9 mol/m3 under the influence of a 30-fold increase in carbonate concentration from the background level.
Fig. 10. Results of speciation when uraninite (left) equilibrates with background pore fluid versus (right) 30 times of background level of carbonate appears on boundary.
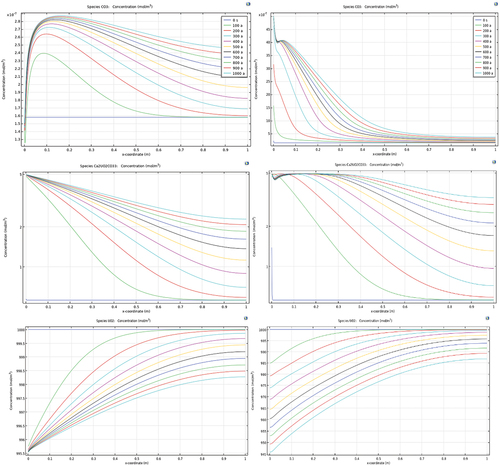
In this study case, carbonate proved to be the dominant complexing agent for UO22+. By increasing the level of carbonate concentration in the pore fluid, uraninite dissolved faster, resulting in more U(VI) carbonate complexes. This prediction is consistent with theoretical induction and experimental observations.
IV.E.2. Coexisting Uraninite and Hematite
shows the simulation results of the long-term equilibration between U and Fe minerals. It shows that the gradual dissolution of both minerals consumed the protons, leading to a pH increase in the pore fluids toward more alkaline conditions by 1-pH unit. This was more obvious in hematite, as its dissolution consumed more hydrogen protons than uraninite. Note that this trend could be compromised by the presence of other minerals, like clays and silicate aluminum hydroxide, which provide an abundant surface complexation site capable of buffering pH fluctuations.
Fig. 11. Variation of spatial distribution of species with time for coexisting uraninite and hematite.
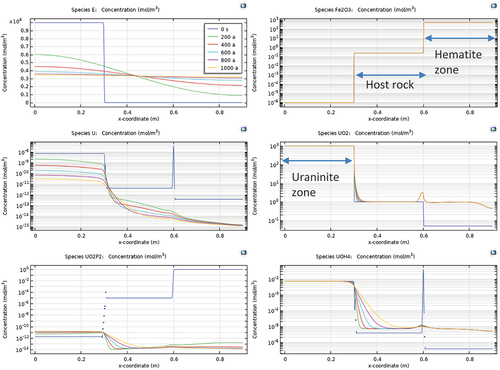
The coexistence of uraninite and hematite was metastable according to our model. This was mainly due to the gap in the redox potential between U and Fe, which once equilibrated with elapsed time, will cause the dissolution of U and then release and remobilize U under diffusion. The model suggested that UO2 exists in Eh = −59 mV and Fe2O3 persists in Eh = 239 mV. The electron concentration varies by five orders of magnitude between the granul of the two minerals. Our model showed a clear trend of a smooth transitioning from stepwise toward ramp type, and the eventual equilibrium of the redox potential distribution under the diffusive transport of chemical species. However, the dissolution kinetics of both minerals play a critical role in the time-dependent evolution of their species. Within the studied time span, no significant amount of uraninite or hematite was found to have dissolved due to their coexistence. This was probably due to the high pH considered in the model.
A key observation of U/Fe coexisting modeling is the enrichment of UO2 (uraninite) near the redox front of hematite. This enrichment of UO2 can reach as high as 300% of the background level. This enrichment is most prominent at a very sharp redox front when the oxidative agent is first introduced into contact with the hematite ore. With time lapsed, the spike in UO2 enrichment showed up quickly and was maintained even after 1000 years of reactive equilibration. This phenomenon was found to be accompanied by a spike in the concentration of U(OH)4, which is the hydrous product of reduced U(IV), as well as a sharp reduction in UO22+. This indicates that the enrichment was a combinational result of the redox reaction and transport of U(VI) originally contained in hematite. Note that the precipitate of UO2 was immobile, and thus acted as a sink for U in hematite.
IV.F. Discussion
For the Andrew Lake uranium natural analogue, major geological events were highlighted and the focus was on the acidic/oxidative leaching of uranium mineral. The geochemistry of the uraninite and hematite were reviewed focusing on the fate and transport of uranium in the host rock. A reactive transport modeling approach was developed to study uranium oxidation and U/Fe mineral coexistence.
The modeling suggested that carbonate as a complexing agent largely facilitated the oxidative dissolution and leaching of uraninite. The dissolution kinetics of uraninite was the predominant process governing the rate of oxidative leaching. Uraninite has a low redox potential and contrasts with hematite, which has a high redox potential. The coexistence of uraninite and hematite allowed the redox potential to eventually equilibrate across the medium. The final redox potential was predicted to be lower than the threshold for hematite to exist if the equilibrium reaction is considered. However, because of the slow dissolution that controls the overall reaction kinetics, hematite can persist in a substantial time span.
The enriched precipitate of UO2 was found to form at redox front in the rim of hematite. This prediction was similar to the phenomenon of Fe enrichment upon rim of UO2 as observed in uranium ores. Uraninite tends to be easier to dissolve than hematite at similar neutral pHs, mainly due to the migration of U(OH)4 from uraninite toward the host rock in contact.
V. CONCLUSIONS
Natural analogues are important and valuable supplements to laboratory and underground research facility experiments and site characterization activities in order to inform and validate the processes assumed in safety assessment models. In this paper, we summarized the CNSC’s recent research on natural analogues at three sites, the Greenland ice sheet, the Cigar Lake uranium ore body, and the Kiggavik-Andrew Lake uranium deposit. These sites provided invaluable insights into processes that might be found in a DGR system: glacial erosion, radionuclide diffusion and retardation in engineered clay barrier system, and reactive uranium transport in fractured rocks.
We adopted a combination of research strategies, including review of site investigation data, laboratory tests of core samples, and numerical modeling. The interpretation of these processes requires the development of multiphysics-geochemical-coupled models. This research has resulted in an improved understanding of select features, events, and processes (quantification of glacial erosion on bedrock, sealing performance of clay barriers, and oxidative leaching of uranium under presence of iron oxides and complexing chemicals, etc.) that may need to be considered in the development of scenarios for the safety assessment of a DGR.
Disclosure Statement
No potential conflict of interest was reported by the authors.
References
- T. A. KURNIAWAN et al., “Technological Solutions for Long-Term Storage of Partially Used Nuclear Waste: A Critical Review,” Ann. Nucl. Energy, 166, 108736 (2022); https://doi.org/10.1016/j.anucene.2021.108736.
- T. S. NGUYEN et al., “Hydro-Mechanical Behavior of an Argillaceous Limestone Considered as a Potential Host Formation for Radioactive Waste Disposal,” J. Rock Mech. Geotech. Eng., 10, 6, 1063 (2018); https://doi.org/10.1016/j.jrmge.2018.03.010.
- “The Safety Case and Safety Assessment for the Disposal of Radioactive Waste,” IAEA Safety Standards Series No. SSG-23, International Atomic Energy Agency (2012).
- M. FAYEK and J. BROWN, “Natural and Anthropogenic Analogues for High-Level Nuclear Waste Disposal Repositories: A Review,” Can. Mineral., 59, 1, 287 (2021); https://doi.org/10.3749/canmin.2000051.
- E. SASAO et al., “An Overview of a Natural Analogue Study of the Tono Uranium Deposit, Central Japan,” Geochem. Explor. Environ. Anal., 6, 1, 5 (2006); https://doi.org/10.1144/1467-7873/05-084.
- R. METCALFE et al., “A System Model for the Origin and Evolution of the Tono Uranium Deposit, Japan,” Geochem. Explor. Environ. Anal., 6, 1, 13 (2006); https://doi.org/10.1144/1467-7873/05-080.
- F. AKAGAWA et al., “Redox Front Formation in Fractured Crystalline Rock: An Analogue of Matrix Diffusion in an Oxidizing Front Along Water-Conducting Fractures,” Geochem. Explor. Environ. Anal., 6, 1, 49 (2006); https://doi.org/10.1144/1467-7873/05-085.
- W. R. ALEXANDER et al., “Natural Immobilization Processes Aid the Understanding of Long-Term Evolution of Deep Geological Radioactive Waste Repositories,” Geochem. Explor. Environ. Anal., 6, 1, 3 (2006); https://doi.org/10.1144/1467-7873/05-100.
- A. M. SIMMONS and J. S. STUCKLESS, “Analogues to Features and Processes of a High-Level Radioactive Waste Repository Proposed for Yucca Mountain, Nevada,” U.S. Geological Survey Professional Paper 1779, p. 195, U.S. Geological Survey (2010).
- S. J. COOK et al., “The Empirical Basis for Modelling Glacial Erosion Rates,” Nat. Commun., 11, 1, 759 (2020); https://doi.org/10.1038/s41467-020-14583-8.
- F. HERMAN et al., “The Impact of Glaciers on Mountain Erosion,” Nat. Rev. Earth Environ., 2, 6, 422 (2021); https://doi.org/10.1038/s43017-021-00165-9.
- M. N. KOPPES and D. R. MONTGOMERY, “The Relative Efficacy of Fluvial and Glacial Erosion Over Modern to Orogenic Timescales,” Nat. Geosci., 2, 9, 644 (2009); https://doi.org/10.1038/ngeo616.
- B. HALLET, L. HUNTER, and J. BOGEN, “Rates of Erosion and Sediment Evacuation by Glaciers: A Review of Field Data and Their Implications,” Global Planet. Change, 12, 1, 213 (1996); https://doi.org/10.1016/0921-8181(95)00021-6.
- Z. LI and T. S. NGUYEN, “Thermo-Mechanical Regime of the Greenland Ice Sheet and Erosion Potential of the Crystalline Bedrock,” Minerals, 11, 2, 120 (2021); https://doi.org/10.3390/min11020120.
- C. LILJEDAHL et al., “The Greenland Analogue Project: Final Report,” Technical Report TE-14-13, Nuclear Waste Management Organization (2016).
- T. BIRCHALL, K. SENGER, and R. SWARBRICK, “Naturally Occurring Underpressure—A Global Review,” Pet. Geosci., 28, 2, petgeo2021–051 (2022); https://doi.org/10.1144/petgeo2021-051.
- J. CRAMER and J. A. T. SMELLIE, “Final Report of the AECL/SKB Cigar Lake Analog Study,” Swedish Nuclear Fuel and Waste Management Company (1994).
- M. PAGEL, F. RUHLMANN, and P. BRUNETON, “The Cigar Lake Uranium Deposit, Saskatchewan, Canada,” Can. J. Earth Sci., 30, 4, 651 (1993); https://doi.org/10.1139/e93-053.
- G. L. CUMMING and D. KRSTIC, “The Age of Unconformity-Related Uranium Mineralization in the Athabasca Basin, Northern Saskatchewan,” Can. J. Earth Sci., 29, 8, 1623 (1992); https://doi.org/10.1139/e92-128.
- M. FAYEK et al., “O and Pb Isotopic Analyses of Uranium Minerals by Ion Microprobe and U-Pb Ages from the Cigar Lake Deposit,” Chem. Geol., 185, 3, 205 (2002); https://doi.org/10.1016/S0009-2541(01)00401-6.
- H. MOZAFARISHAMSI, “In Situ Production and Migration of 129I in the Cigar Lake Natural Analogue,” Canadian Nuclear Safety Commission (2023).
- B. M. SHABAGA et al., “Mineralogy, Geochronology, and Genesis of the Andrew Lake Uranium Deposit, Thelon Basin, Nunavut, Canada,” Can. J. Earth Sci., 54, 8, 850 (2017); https://doi.org/10.1139/cjes-2017-0024.
- A. GRARE et al., “The Contact Uranium Prospect, Kiggavik Project, Nunavut (Canada): Tectonic History, Structural Constraints and Timing of Mineralization,” Ore Geol. Rev., 93, 141 (2018); https://doi.org/10.1016/j.oregeorev.2017.12.015.
- B. M. SHABAGA et al., “Geochemistry and Geochronology of the Kiggavik Uranium Deposit, Nunavut, Canada,” Miner. Deposita, 56, 7, 1245 (2021); https://doi.org/10.1007/s00126-020-01001-8.
- I. CASAS et al., “The Role of Pe, pH, and Carbonate on the Solubility of UO2 and Uraninite Under Nominally Reducing Conditions,” Geochim. Cosmochim. Acta, 62, 13, 2223 (1998); https://doi.org/10.1016/S0016-7037(98)00140-9.
- P. L. SMEDLEY and D. G. KINNIBURGH, “Uranium in Natural Waters and the Environment: Distribution, Speciation and Impact,” Appl. Geochem., 148, 105534 (2023); https://doi.org/10.1016/j.apgeochem.2022.105534.
- K.-U. ULRICH et al., “Comparative Dissolution Kinetics of Biogenic and Chemogenic Uraninite Under Oxidizing Conditions in the Presence of Carbonate,” Geochim. Cosmochim. Acta, 73, 20, 6065 (2009); https://doi.org/10.1016/j.gca.2009.07.012.