
 ?Mathematical formulae have been encoded as MathML and are displayed in this HTML version using MathJax in order to improve their display. Uncheck the box to turn MathJax off. This feature requires Javascript. Click on a formula to zoom.
Abstract
This paper presents simulations of the xM3 power ramp with the fuel performance code ALCYONE performed during an international simulation exercise organized within the Organisation for Economic Co-operation and Development/Nuclear Energy Agency Power to Melt and Maneuverability project. The xM3 test involved a large-grain UO2 fuel from Mitsubishi Heavy Industries cladded with Zirlo and pre-irradiated in a Spanish pressurized water reactor up to an average burnup of 27 GWd/tU−1. It was then submitted to a staircase ramp protocol in the R2 reactor at Studsvik (Sweden) with 10 successive steps of 5 kW·m−1 up to a ramp terminal level of 70 kW·m−1. The fuel rodlet did not fail, and detailed post irradiation examinations performed during the Studsvik Cladding Integrity Project II evidenced recrystallization of the pellet center around a central hole, interpreted as signs of fuel melting.
In this paper, simulations with ALCYONE of the xM3 power ramp, including an advanced model for fuel melting based on thermodynamic equilibrium calculations, are detailed. The model relies on the determination of the liquid fuel fraction evolution with temperature that is used to obtain a continuous description of the material properties during phase change. In consequence of the incorporation of rare earths and actinides in the bulk of the fuel, distinct solidus and liquidus temperatures are estimated. It is shown that the observed central hole and recrystallized central part of the pellet could be the consequence of totally melted fuel (liquidus is reached), partially melted fuel (solidus is reached), or pore migration only.
I. INTRODUCTION
Within the Organisation for Economic Co-operation and Development (OECD)/Nuclear Energy Agency (NEA) Framework for IrraDiation ExperimentS (FIDES),[Citation1] the Power to Melt and Maneuverability project (P2M) has been launched by CEA, EdF, and SCK●CEN to study partial centerline fuel melting in pressurized water reactor (PWR) fuel rods during staircase power transients. The transients are planned in the BR2 reactor[Citation2] (SCK●CEN, Belgium) and the associated post-irradiation examinations (PIEs) in the LECA/STAR hot-cell laboratory (CEA, France).
In 2020, an international simulation exercise was organized by the CEA in the frame of the P2M project to help predesign the P2M transients. Two past power ramps, named xM3 and HBC4,[Citation3] were studied. This paper is concerned with the staircase xM3 power ramp that was performed in the R2 reactor in Studsvik[Citation4] (Sweden) and used as a test case in the third modeling workshop[Citation5,Citation6] of the OECD Studsvik Cladding Integrity Project II (SCIP II) (2009–2014). In fact, this test is a rare example of a power ramp with suspected incipient fuel melting and no clad failure. The international simulation exercise showed a general trend of underestimation of the molten fuel radius by the fuel performance codes.[Citation7,Citation8] At nominal power, half of the codes did not predict melting at all.
In this paper, the xM3 test case and the PIE of importance are first described. The simulation results obtained with the fuel performance code ALCYONE are then presented in detail. The novel approach available in the code to precisely model fuel melting from thermochemical equilibrium calculations is described and discussed. The determination of the fuel melting radius during the simulated xM3 power ramp from the solidus or liquidus temperatures is then illustrated. The potential importance of temperature gradient–driven pore migration with respect to fuel melting is then studied by including this mechanism in the simulations. Conclusions are drawn on the occurrence or not of melting during this experiment.
II. xM3 STAIRCASE POWER RAMP
In this section, the main data provided to participants of the P2M simulation exercise for the modeling of the xM3 power ramp are detailed. The PIEs performed at Studsvik are also discussed. A complete description of the power ramp and of the PIE program performed can be found in Refs. [Citation4,Citation9].
II.A. Main Characteristics of the Rod
The xM3 rodlet was part of a segmented rod that was manufactured by ENUSA in Spain. The father rod consisted of seven segments screwed and welded together. The xM3 segment contained large-grain UO2 fuel pellets (30 μm) manufactured by MHI in Japan within a SR Zirlo cladding. The main characteristics of the fuel rodlet are recalled in .
TABLE I Main Characteristics of the xM3 Rodlet
The father rod was irradiated during two cycles in a Spanish PWR, up to an average burnup of 27 GWd/tU−1. During the first cycle (270 days), the average linear heat generation rate (LHGR) on the xM3 segment reached 26 kW·m−1. During the second cycle (236 days), it decreased to 18 kW·m−1. The axial power profile was nearly flat leading to a small axial variation of the burnup. Plots of the LHGR time history and of the axial power profile during the base irradiation can be found in Ref. [Citation8].
II.B. Power Ramp
After refabrication, the xM3 rodlet was power ramped in 2005 in the Studsvik R2 reactor (Sweden). The pressurized water loop N°1 was used for the test, simulating PWR conditions (147 bar, 315°C, 0.65 kg/s). In the loop, the maximum rod surface temperature was estimated at 347°C due to subcooled surface boiling initiated at a local LHGR of 40 kW·m−1. At peak power node (PPN), the rod was preconditioned at a LHGR of 20 kW·m−1 during 18 h before the first power step. The power was then progressively increased up to 70 kW·m−1 by steps of ~5 kW·m−1. Each 5 kW·m−1 step was maintained during ~1 h, as well as the ramp terminal level (RTL) of 70 kW·m−1. The power ramp rate during the steps was close to 10 kW/m/min. shows the power history during the ramp. shows the axial power profile during the power ramp normalized with respect to the average power. The rodlet did not fail during the test.
Fig. 1. Power histories and axial power profiles during the xM3 power ramp.
II.C. Available PIEs
During the power ramp, the rod elongation was recorded.[Citation4] After the ramp, extensive PIEs were performed[Citation9]: clad profilometry measurements (also made before the ramp); puncturing of the rod and fission gas analysis; pellet diameter measurements at PPN; pellet-clad gap measurements (see Appendix A); fuel density measurements; porosity, pore size, and grain size distributions; light optical microscopy (LOM), as shown in , scanning electron microscopy on a transverse cross section located near the PPN; and radial profiles of fission products by electron probe microanalysis (EPMA). Most of the PIEs are compared to simulation results in Sec. IV, and therefore, will be detailed later.
Fig. 2. Overview and details of the etched fuel cross section cut near the PPN after the xM3 power ramp.
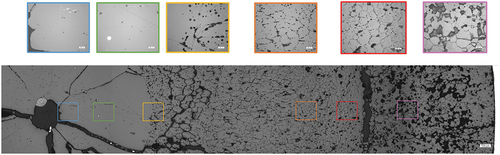
As detailed in the PIE report, the cross section of shows that recrystallization of the fuel pellet center took place during the power ramp, indicating that the fuel had melted. The formation of a well-defined and symmetrical central hole of radius 0.15 mm was also observed, surrounded by a ring of very-high-density fuel with no obvious grain structure (see the blue and green frames). A net boundary at a radius of 1.2 mm separates the dense zone from the surrounding material (see the yellow frame), where radially elongated grains with numerous bubbles at the grain boundaries are found (see the orange frame). A transition between radially elongated and equi-axed grains with numerous intragranular bubbles is found in the red frame at a radius of 2.8 mm. A circumferential crack follows at a radius of 3 mm (dark zone). The fuel microstructure after the crack corresponds to the as-fabricated grain structure with no intragranular bubbles (see the purple frame).
Several other PIEs confirmed the strong evolution of the pellet center during the power ramp. Cumulative pore fractional area (pore diameters between 0.24 and 42 μm) determined on images taken from the cross section at several pellet radii confirmed the fuel densification around the central hole; the pore fraction was less than 0.3% at 0.2 mm while it reached 7% at 1.2 mm and was close to the initial porosity (4.7%) at 2 and 3 mm from the pellet center (see ).
Fig. 3. Pore fractional area at selected pellet radii.[Citation9]
![Fig. 3. Pore fractional area at selected pellet radii.[Citation9]](/cms/asset/144b8bf0-351d-4892-b2cf-2fa366e1e467/unct_a_2253660_f0003_oc.jpg)
The grain size was determined along the pellet radius according to the American Society for Testing and Materials (ASTM) E112-10 circular intercept method. illustrates the observed decrease of the grain size with the radius. Inside the dense fuel zone (radius below 1.2 mm), no grains were visible on the etched fuel surface, making any estimation of grain size impossible. Backscattered electron images revealed that grains in this zone were very large, with typical dimensions on the order of a millimeter. The very large grain size was interpreted as another signature of molten fuel. Note also that the grain size at the pellet periphery (<20 μm) was notably smaller than the as-fabricated value (30 μm).
Fig. 4. Grain size determined at selected pellet radii according to the ASTM procedure.[Citation9]
![Fig. 4. Grain size determined at selected pellet radii according to the ASTM procedure.[Citation9]](/cms/asset/818864e7-8f25-4a44-b667-fdf41b61750a/unct_a_2253660_f0004_oc.jpg)
A considerable fission gas release (FGR) of 31% for Kr and 34% for Xe was estimated from rod puncturing. Note that these values include the FGR during base irradiation. The latter, however, is not expected to be important since the average fuel burnup of the rodlet was moderate (27 GWd/tU) and the grain size large (30 μm). The volumes of Xe and Kr released in the rod reached 50.3 and 5.9 cm3 (at 0°C and 1 bar), respectively. The rod internal pressure at the end of the power ramp was estimated at 34.8 bar (at 0°C). This FGR was confirmed by the EPMA radial profiles of Xe and Cs, which showed a total depletion up to a pellet radius of 3 mm (see ).
Fig. 5. EPMA radial profiles of Cs and Xe after the xM3 power ramp.[Citation9]
![Fig. 5. EPMA radial profiles of Cs and Xe after the xM3 power ramp.[Citation9]](/cms/asset/7cf0ef6d-b4ce-4918-b7fe-a7aecc991906/unct_a_2253660_f0005_oc.jpg)
During the third modeling workshop of the SCIP II OECD project, Arimescu et al.[Citation5] distinguished two rings in the dense fuel layer visible in : an inner ring around the central hole up to a radius of 0.4 to 0.5 mm with a high density of small pores (referred to as the “porous band” in this paper) and an outer ring almost free of pores (referred to as the “pore-free band” in this paper) up to the boundary with the columnar grain region (radius of 1.2 mm). Following the definition proposed by Robertson et al.[Citation10] or De Halas and Horn,[Citation11] Arimescu et al.[Citation5] defined the melt radius at the interface between these two rings (0.4 to 0.5 mm). They also showed that the size of the central hole (0.15 mm) was consistent with this radius if it was assumed that the central hole was formed by shrinkage of the once molten fuel center upon cooling down. While these porous and pore-free bands are frequently observed after power-to-melt experiments,[Citation12–14] some authors include the pore-free band in the melt radius, meaning that there is no consensus on the definition of the melt radius.
During the P2M simulation exercise, where calculations of the xM3 ramp were performed by 11 different fuel performance codes,[Citation7] half of the codes did not predict fuel melting. Only with a 5% increase in power was a better agreement found on the occurrence and extension of melting. One of the hypotheses proposed by D’Ambrosi et al.[Citation7] to explain these results is that only the solidus temperature was reached during the xM3 transient. Since most of the fuel performance codes evaluate congruent melting in UO2 fuel once the liquidus temperature is reached, this might explain the difficulty in predicting fuel melting in this case.
To further debate, it is well known that thermally activated pore migration up the temperature gradient can lead to the formation of a central hole and of the surrounding high-density fuel ring,[Citation15] even without melting of the fuel. This is why the central hole alone cannot be considered a clear sign of central fuel melting. Novascone et al.[Citation16] showed by simulation that the formation of a central hole by pore migration is favored in slow power ramps such as xM3, while fuel melting is more likely in fast power ramps performed until a similar RTL.
To investigate in more details the fuel behavior during the xM3 power ramp, a thermodynamic-based model for fuel melting has been introduced in the fuel performance code ALCYONE. It is detailed in Sec. III. In Sec. IV, the main results obtained with this model are compared to available PIEs with a focus on the melt radius and the porosity radial profile. In the discussion in Sec. V, the hypothesis of a central hole formation by pore migration is investigated. The impact on the temperature reached at the fuel centerline and on fuel melting is studied.
III. MODELING OF FUEL MELTING IN ALCYONE
III.A. ALCYONE Fuel Performance Code
ALCYONE is a multidimensional fuel performance code dedicated to PWR fuel rods.[Citation17,Citation18] It was co-developed by the CEA, EdF, and Framatome within the PLEIADES computational environment.[Citation19] It includes three different schemes [1.5 dimensional (1.5D), two dimensional (2D) (r, ), and three dimensional (3D)] that rely on the finite element (FE) code Cast3M[Citation20] for the solution of the thermomechanical equilibrium and share a common database of material properties and physical models. In this paper, only the 1.5D scheme is used. In this scheme, the fuel rod is discretized axially in slices and each slice is divided in annular rings with a refinement of the mesh at the pellet center (0.1 mm) and periphery (0.05 mm), as illustrated in .
Fig. 6. 1.5D scheme in the ALCYONE code (mesh is indicative).
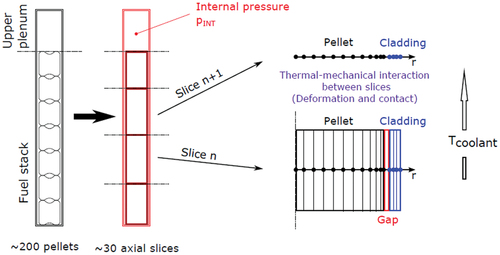
Interactions between the slices are due to the coolant thermal hydraulics and to the closing of the pellet-clad gap (no sliding at the pellet-clad interface is allowed when the gap is closed at a given axial position). The main phenomena considered in a typical 1.5D simulation of PWR UO2-fueled pins are irradiation creep, thermal creep, and fragmentation of the fuel pellet; irradiation creep, thermal creep, and plasticity of the cladding; the evolution of the thermal-mechanical properties with irradiation; the generation of fission gases in the fuel, their gathering in bubbles in the grain or at the grain boundaries, the migration of bubbles to the grain boundaries and the fission gas release in the free volume of the rod when grain boundary coverage by bubbles reaches a threshold; fuel swelling associated with fission gases and solid fission products; and mechanical interaction at the pellet-clad interface when the pellet-clad gap is closed. The scheme has been validated on a wide range of base irradiations, power ramps, and Reactivity Initiated Accident (RIA) tests on UO2 rods with Zy4 and M5 claddings up to an average burnup of 80 GWD/tU−1.[Citation18]
III.B. Thermodynamic Modeling of Fuel Melting
For the P2M simulation exercise on xM3, a fuel melting model has been developed and implemented in ALCYONE. To account for the impact of fission products and actinides within the fuel on melting, thermochemical calculations are very useful to predict the phases that may form and their evolution with temperature.[Citation21,Citation22] In ALCYONE, thermochemical equilibrium calculations are performed with the OpenCalphad (OC) solver[Citation23,Citation24] using two different thermodynamic databases: the TBASE[Citation25–27] or the Thermodynamics of Advanced Fuels—International Database[Citation28,Citation29] (TAF-ID, version 11).
In the TAF-ID, the thermodynamic modeling of oxide fuels rests largely on the description of the fluorite (U, Pu)O2 phase from Guéneau et al.,[Citation30] where, apart from major actinides (U, Pu), minor actinides (Np) and fission products (Ce, Gd, La, Nd, Zr) may also occupy the cation sites, both at hypo- and hyper-stoichiometric oxygen conditions. The Calphad method is used in the TAF-ID to describe the thermodynamic properties of the phases (fluorite, liquid, gas) and of the stoichiometric compounds. In this respect, the measured heat capacities of the phases and compounds are part of the data used to build the database. shows the phase diagram for obtained from OC calculations with the TAF-ID compared to measurements of the solidus and liquidus temperatures by Manara et al.[Citation31] As can be seen, the evolution of the solidus and liquidus temperatures with the oxygen fraction of the fuel is well reproduced with the TAF-ID.
Fig. 7. U-O phase diagram calculated with the TAF-ID and OC (adapted from Introni et al.[Citation32]) compared to measurements of the solidus and liquidus temperatures (blue squares) by Manara et al.[Citation31] is the oxygen mole fraction of
.
![Fig. 7. U-O phase diagram calculated with the TAF-ID and OC (adapted from Introni et al.[Citation32]) compared to measurements of the solidus and liquidus temperatures (blue squares) by Manara et al.[Citation31] xO is the oxygen mole fraction of UO2±x.](/cms/asset/068659aa-56c6-4df2-a9ca-c187e1ffd7a1/unct_a_2253660_f0007_oc.jpg)
During irradiation, the fuel composition evolves due to the numerous fission products that are formed following U and Pu fission reactions. In ALCYONE, the fuel composition is obtained from calculations performed with the neutronic-based solver PRODHEL,[Citation26] which includes 199 isotopes of fission products and 23 isotopes of actinides. To simplify the thermodynamic equilibrium calculations, actinides and fission products are grouped in chemical families, with one representative element for each family. The groups are shown in .
TABLE II Grouping of Fission Products and Actinides for the Thermodynamic Equilibrium Calculations with OC and the TAF-ID
Thermodynamic equilibrium calculations have been made on UO2 fuels of average burnups between 0 and 80 GWd/tU by steps of 10 GWd/tU. The temperature step is 1°C to capture precisely the solid-liquid phase transition. Equilibria are calculated at a pressure of 5 MPa, representative of the fuel rod pressure during normal operating conditions. The calculated evolutions of the liquid fuel fraction as a function of temperature are plotted in .
Fig. 8. Calculated liquid fuel fractions in irradiated UO2 as a function of temperature and burnup.
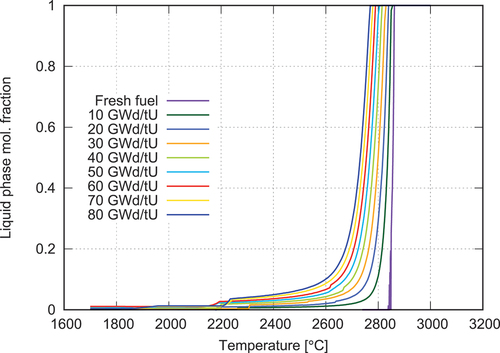
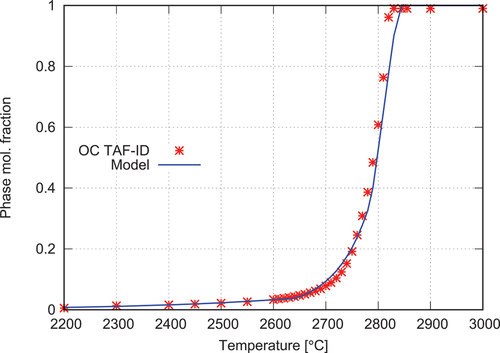
As can be seen, there is a shift of the liquid fuel fraction curves toward lower temperatures with fuel burnup increase. Also, a liquid fuel fraction of 1 is reached at a lower temperature when burnup is increased. There is also a widening of the liquid fuel fraction curves that are spread over a larger temperature interval. To analyze in more detail the thermodynamic calculations while focusing on the xM3 fuel of interest, shows the calculated evolution with temperature of the solid, liquid, and gas phases in a fuel of average burnup 30 GWd/tU−1, representative of xM3 at the end of the ramp test.
Fig. 9. Calculated evolution of the phase fractions with temperature in a fuel of average burnup 30 GWd/tU−1: (a) all phases and (b) liquid phases.
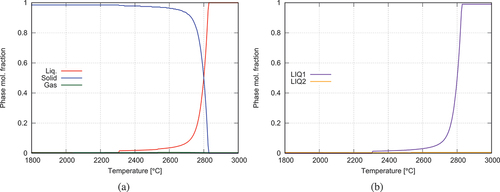
Below 2300°C, the fuel is mostly solid (solid fuel fraction >0.99). A first step in the liquid phase fraction is observed at a temperature close to 2300°C. It is followed by a slow increase until approximately 2700°C, where the liquid fraction reaches 0.08. A fast increase is then observed until 2835°C, where the fuel is completely liquid. Also plotted in is the gas-phase fraction, which remains always small (<0.01).
Within the temperature range studied (1800°C to 3000°C), the thermodynamic calculations indicate that the liquid phase is composed of two immiscible liquids (LIQ1 and LIQ2) that are plotted in as a function of temperature. LIQ1 is the main liquid phase. LIQ2 is a minor phase with a fraction that remains low at all temperatures. show the composition of the LIQ1 and LIQ2 phases in more detail. The quantity of an element in each liquid phase is normalized with respect to the total quantity of that element in the fuel. This allows for perceiving how much of that element is melted at a given temperature.
Fig. 10. Elemental composition of the immiscible liquid phases LIQ1 and LIQ2 as a function of temperature in a fuel of average burnup 30 GWd/tU−1.
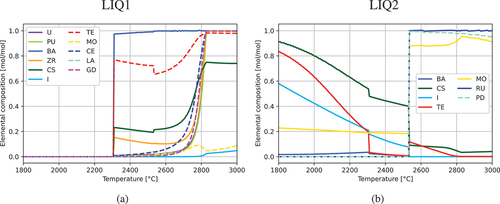
shows that the melting of the fluorite phase is represented by LIQ1, where all the U and Pu, most of rare earths Ce, La, and Gd, and Zr are found at 2835°C. The smooth increase of the liquid fuel fraction occurring between 2300°C and 2700°C is related to the progressive incorporation of rare earths and actinides in LIQ1. At ~2300°C, the step in the LIQ1 curve is mainly due to the melting of the perovskite phase BaZrO3 and to the formation of liquid Cs2Te. As shown in large proportion of the volatile (I, Te, Cs) and semi-volatile (Mo, Ba) fission products[Citation22] is found in LIQ2 at temperatures below 2550°C. Above 2550°C, the hexagonal close-packed metallic phase melts, leading to the incorporation of Mo, Ru, and Pd in LIQ2. This explains the small step in LIQ2 that is seen at this temperature in
III.C. Comparison of Solidus and Liquidus Temperatures to Available Experimental Results
While the definition of the liquidus temperature from the liquid fraction curve of is straightforward (the lowest temperature at which the liquid fraction reaches 1), the definition of the solidus temperature is more difficult. In their work on (U,Pu)O2 melting, Guéneau et al.[Citation28] showed that the solidus temperature of irradiated U-Pu-O fuels was well assessed when only the fluorite phase was considered in the thermodynamic calculations. The solidus was defined from the lowest temperature where the liquid fuel fraction was non-zero. Guéneau et al.[Citation28] compared with success their TAF-ID estimations to experimental data from Hirosawa and Sato.[Citation33] In fact, as illustrated in a small proportion of liquid forms at temperatures much lower than the melting temperature of the fuel, associated with the melting of secondary phases, such as the perovskite at 2300°C. To define precisely the solidus temperature, the calculated evolutions of the liquid and solid fuel fractions considering all the phases (solid lines) and only the fluorite phase (dashed lines) are compared in for a fuel of average burnup 30 GWd/tU−1.
Fig. 11. Comparison of the calculated solid-liquid phase transition for a 30 GWd/tU−1 fuel considering all phases and only the fluorite matrix.
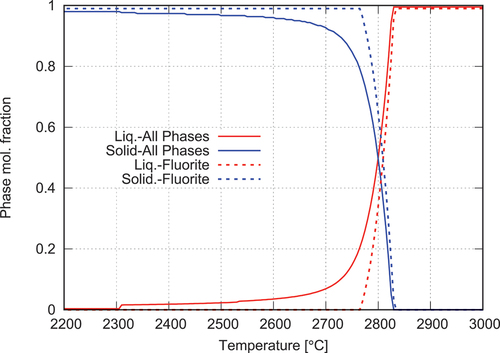
As can be seen, complete melting is reached at the same temperature in the two calculations, i.e., 2835°C, defining the liquidus temperature. The evolution of the liquid fuel fraction at lower temperatures is, on the contrary, strongly impacted by the phases considered in the calculation. When only the fluorite phase is considered, the liquid fraction is null below 2765°C and then increases sharply until 2835°C. To be consistent with the definition of Guéneau et al.,[Citation28] the solidus temperature should be defined from the fluorite phase only, i.e., 2765°C. Note that a liquid fuel fraction of ~0.2 corresponds to this temperature in the calculation with all the phases.
There is considerable literature on the experimental characterization of the solidus and liquidus temperatures for fresh and irradiated UO2 and (U,Pu)O2. It is thus interesting to compare the TAF-ID calculations with the correlations derived from these experimental data. To this end, the evolution of the liquid fuel fractions as a function of temperature and burnup were recalculated with the TAF-ID considering the fluorite phase only. The solidus and liquidus temperatures at each burnup were determined from the calculated curves, i.e., temperature at which the liquid fuel fraction is first non-zero for the solidus and temperature at which the liquid fuel fraction reaches one for the liquidus. presents the TAF-ID estimates of the solidus and liquidus temperatures as a function of the fuel burnup compared to correlations from the open literature, which are detailed in Appendix B.
Fig. 12. TAF-ID estimates of the solidus and liquidus
temperatures as a function of the fuel burnup compared to correlations from the open literature.
refers to the melting temperature when the solidus and liquidus temperatures are equal in the correlation.
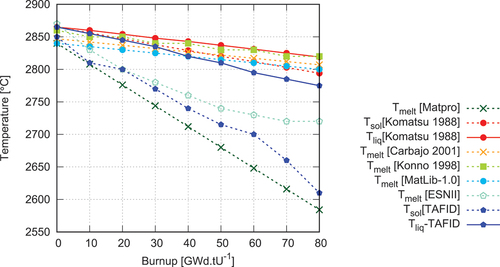
The correlation providing the lower solidus temperatures is that of MATPRO[Citation34] (dark green dotted line). The linear burnup dependency (−3.2°C per GWd/tU−1) is based on the measurements of Christensen et al.[Citation35] on irradiated UO2 fuels. Just above this correlation are the solidus temperatures of the TAF-ID (dark blue dotted line) that decrease with burnup with a similar slope. The 2020 reevaluation of the melting temperatures of irradiated (U,Pu)O2 fuel described in the ESNII++ project[Citation36,Citation37] (cyan dotted line) is close to the TAF-ID estimates of the solidus temperatures up to a burnup of 40 GWd/tU−1. Interestingly, the ESNII++ correlation is based on a selection of measurements that excluded the data obtained on samples melted inside a tungsten capsule (such as those of Christensen et al.[Citation35] behind the MATPRO correlation) because of its suspected influence on the measured melting temperature[Citation38] (potential contamination of the fuel sample by the tungsten from the capsule could have led to lower melting temperatures). The burnup dependency of the ESNII++ correlation is described by an exponential function, assuming that some saturation will take place at high burnup.
Most of the other correlations present an evolution with burnup that is slower. Carbajo et al.[Citation39] recommended a linear decrease of the melting temperature with burnup of 0.5°C per GWd/tU−1 (orange dotted line). The same rate is proposed in the latest version of the MatLib catalog[Citation40] (blue dotted line with filled circles). A nonlinear evolution with burnup is proposed by Konno and Hirosawa,[Citation41] based on their measurements on irradiated mixed-oxide (MOX) fuels (light green dotted line). In general, the proposed correlations do not distinguish the solidus and liquidus temperatures in case the fuel is stoichiometric and contains no Pu. Only Komatsu et al.[Citation42] identified distinct correlations based on their measurements on fresh UO2 and irradiated (U,Pu)O2 fuels (red solid and dotted lines). The TAF-ID estimates for the liquidus temperatures agree reasonably well with the correlations recommended in MatLib-1.0,[Citation40] by Carbajo et al.,[Citation39] Konno and Hirosawa,[Citation41] and Komatsu et al.,[Citation42] considering the 25°C to 30°C uncertainty indicated by the authors.
In view of the marked differences between the correlations plotted in , it is difficult to conclude on the validity of the TAF-ID estimates. One may, however, note that the distinction between the solidus and liquidus temperatures could reconcile the authors of the correlations since two distinct groups appear in , one close to the solidus temperatures of the TAF-ID and the other close to the liquidus temperatures of the TAF-ID.
III.D. Melting Model Implemented in ALCYONE
The implementation of fuel melting in ALCYONE relies on the calculated evolution of the liquid fuel fraction with temperature. In this way, even the melting of secondary phases is included in the analysis. The introduction of the liquid fuel fraction in the material properties allows for a continuous description of the phase change. The modeling of fuel melting is illustrated hereafter for the xM3 case where the fuel burnup at the pellet center (where melting is expected) is close to 30 GWd/tU−1.
III.D.1. Liquid Fuel Fraction
The liquid fuel fraction evolution with temperature available from the thermodynamic calculations can be fitted with multiple mathematical functions. The model implemented in ALCYONE is compared to the TAF-ID calculations in .
Fig. 13. Model implemented in ALCYONE for the liquid fuel fraction compared to the TAF-ID calculation results for a fuel of average burnup 30 GWd/tU−1.
According to the TAF-ID calculations, the solidus temperature is reached at 2765°C (liquid fuel fraction of ~0.2), while the liquidus temperature
is equal to 2835°C.
III.D.2. Thermal Properties
Thermodynamic calculations also allow for a direct evaluation of the fuel enthalpy evolution with temperature and during the melting process. By derivation, it is possible to obtain the heat capacity of the fuel, which includes here the latent heat of melting. A plot of the calculated heat capacity with the TAF-ID as a function of temperature for a fuel of average burnup 30 GWd/tU−1 is given in .
Fig. 14. Model implemented in ALCYONE for the heat capacity compared to the TAF-ID calculation results for a fuel of average burnup 30 GWd/tU−1.
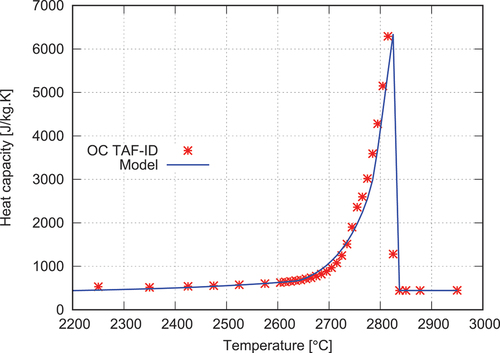
The latent heat of melting results in the observed sharp increase of the above 2700°C. For implementation in the fuel performance code ALCYONE, it is of interest to express the heat capacity as a function of the liquid fraction and temperature instead of temperature only. The mathematical formulation reads as follows:
where is the liquid fuel fraction,
and
are the heat capacity of the solid and liquid fuel in (J·kg−1·K−1), respectively, and
a constant parameter in J·kg−1·K−1 associated to the latent heat of melting. To be consistent with past simulations, the standard model of ALCYONE for the heat capacity of the solid fuel is used. The heat capacity of the liquid fuel and the parameter L are evaluated from the TAF-ID calculation results. The model given by EquationEq. (1)
(1)
(1) is compared to the TAF-ID calculation results in .
The thermal conductivity of the fuel during the solid-liquid transition can be evaluated as a function of the liquid fuel fraction. The following expression is used in ALCYONE:
where is the thermal conductivity of the solid fuel (the standard model of ALCYONE, i.e., a modified version of the model proposed by Lucuta et al.,[Citation43] is used) and
is the thermal conductivity of melted fuel (constant).
depends on temperature T, porosity
, burnup
, and high burnup structure (HBS) formation (
equals 1 in the pellet regions where HBS is calculated and 0 in the other regions).
III.D.3. Thermal-Mechanical Properties
Similarly to thermal conductivity, a simple mixing law is used to evaluate the elastic modulus E and shear modulus G as a function of the temperature and liquid fuel fraction:
The elastic and shear moduli of the solid fuel ( and
) depend on temperature and porosity (the standard models of ALCYONE are used).[Citation44] The moduli of liquid fuel are unknown. To limit the stresses at the pellet center when melting takes place, they are taken equal to the moduli of the solid fuel at the solidus temperature divided by 100.[Citation45] In reality, the viscoplastic mechanical behavior of the fuel implemented in ALCYONE (thermal creep model[Citation46]) should also be modified to account for the liquid fuel fraction. The homogenization approach proposed by D’Ambrosi et al.[Citation47] on this aspect led to the conclusion that the stress relaxation at the pellet center takes place before melting occurrence. In a first approximation, the viscoplasticity of melting fuel can thus be neglected.
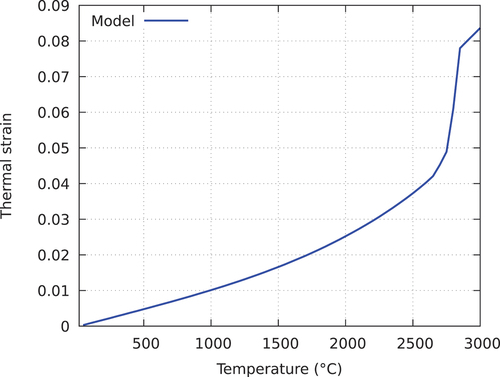
The thermal strain model implemented in ALCYONE accounts for three contributions: the thermal expansion of the solid phase (the standard model of ALCYONE[Citation48] is used), the expansion related to melting (thermal expansion coefficient equal to
),[Citation49] and the thermal expansion of the liquid phase
. The expansion is assumed isotropic, and the importance of each contribution depends on the liquid fuel fraction. The following expressions for the thermal strain are used in ALCYONE:
The evolution of the thermal strain with temperature is plotted in . Note the fast increase of the thermal strain between the solidus and liquidus temperatures.
Fig. 15. Evolution of the thermal strain with temperature implemented in ALCYONE for a fuel of average burnup 30 GWd/tU−1.
III.E. Fission Gas Release from Melting Fuel in ALCYONE
High temperatures and high thermal gradients in melting fuel lead to important modifications of the fuel microstructure and of the fission gas distribution, as illustrated for the xM3 power ramp in Sec. II. This includes pore migration up the temperature gradient with the formation of the so-called columnar grain structure, local fuel densification with disappearance of the fuel grains, and pronounced fission gas release in the melted fuel zone. The modeling of all these phenomena is out of the scope of the present paper. In ALCYONE, the mechanistic model MARGARET is used to describe fission gas distribution in the grains and grain boundaries, fission gas bubble transport and coalescence, fission gas diffusion and release, and the formation of the HBS with a specific microstructure. Details can be found in Ref. [Citation50].
As shown in the next section, simulations of the xM3 staircase power ramp indicate that most of the fission gases are released from the fuel center before melting occurrence. This is due to the long duration (1 h) of the numerous power plateaus that precede the last plateau at 70 kW/m. Therefore, the implementation of a specific fission gas release mechanism in the melting fuel region would not change the calculated end-of-life fission gas release from the fuel. For the present application, the MARGARET model is therefore used as is. Note that the high temperatures encountered during the xM3 ramp are out of the domain of validity of the MARGARET model.
IV. SIMULATION RESULTS
IV.A. Clad Profilometry and Elongation
The clad outer diameter axial profiles obtained with ALCYONE at the end of the base irradiation and after the power ramp are compared in with the measured profilometries.
Fig. 16. Calculated and measured clad outer diameters before and after the xM3 power ramp.
As may be noticed, the calculated diameters at the end of base irradiation are somehow low when compared to the measurements (by ~20 to 30 μm). This stems from the fact that there is no mechanical model and no properties available in ALCYONE for the Zirlo cladding, so the stress-relieved Zy-4 models and properties were used with some adjustment of the irradiation creep rate only. The best agreement was obtained by applying a 0.3 factor on the creep rate of the Zy-4 model. This minimized the clad convergence during base irradiation while ensuring an effective pellet-clad contact that is consistent with the ridges observed on the clad profilometry at the end of base irradiation.
Three simulations of the power ramp were then performed in order to account for the uncertainty on the LHGR of 5%.[Citation8] The calculated clad outer diameters are presented in . The clad diameter profiles are consistent with measurements from the bottom of the fuel rod up to about 350 mm. In the upper part of the rod, the calculated diameters underestimate the measured diameters. This difference is best seen when the calculated and measured clad residual strains are plotted as a function of the local LHGR, as shown in .
Fig. 17. Calculated and measured clad residual strains as a function of the local LHGR.
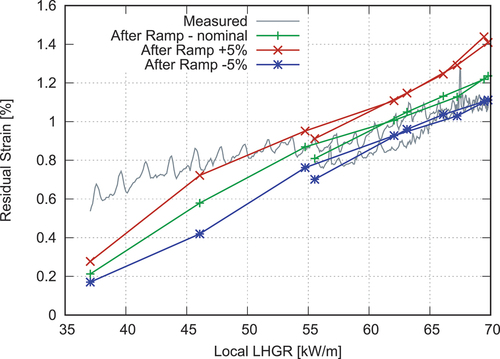
The underestimation concerns the region of LHGR below 55 kW·m−1 and reaches a factor 3. A possible explanation for this behavior may come from the consideration of a constant axial power profile during the ramp. Tilting of the R2 reactor power distribution during the transient was needed to increase the power of the rod, which changed the axial power distribution. The power distribution was known at three different times during the ramp, but a detailed chronology is not available. Note that a similar underestimation at low LHGR characterized other code results during the simulation exercise,[Citation8] which shows that it is probably related to the axial power profile considered and not to the fuel performance code.
At PPN and RTL (LHGR 70 kW·m−1, axial position 200 mm in ), where melting is assessed, a residual strain between 1.1% and 1.4% is calculated depending on the power uncertainty considered, to be compared to the 1.1% measured residual strain. The simulation performed at 95% nominal power is the one that best fits the measured residual strains at LHGR above 55 kW·m−1. The slope of the residual strain – local LHGR curve, however, is overestimated between 65 and 70 kW/m. This trend is best seen in , where the experimental curve is almost flat (neglecting the ridges) at an axial position between 200 to 300 mm.
The ramp rig used in the R2 reactor was equipped with a linear variable differential transformer extensometer to continuously measure the rod elongation during the ramp. shows the calculated rod elongation compared to the measurements. Globally, the calculated rod elongation is very consistent with the measurements, with a maximum difference not exceeding 0.2 mm. It may be noticed that the rod elongation is overestimated during the first four power steps. This may be due to the perfect pellet-clad bonding assumed in ALCYONE when the pellet-clad gap is closed.
Fig. 18. Comparison of the calculated rod elongation with the experimental measurements performed during the xM3 power ramp.
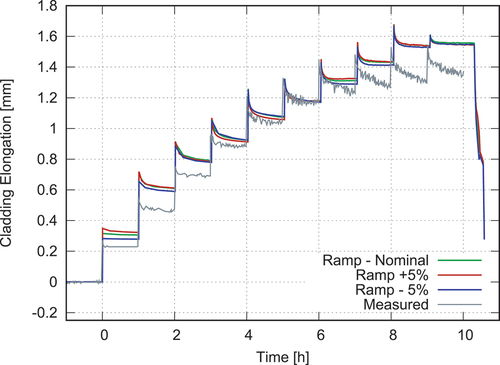
Interestingly, during the following power steps where the pellet-clad contact is certainly very strong (inhibiting, therefore sliding at the interface), ALCYONE gives a rod elongation extremely close to the measurements. In general, the relaxation taking place during the 1-h-long holding periods at each step is also well represented. Only the behavior during the last power plateaus, characterized by a continuously decreasing rod elongation, is not reproduced by ALCYONE. It seems surprising, however, that the highest power plateaus leading to the highest clad temperatures did not lead to a fast stabilization of the measured rod elongation related to clad thermal creep, as obtained with ALCYONE.
Overall, the clad diameter and rod elongation results indicate that the volume variation of the fuel during the xM3 power ramp and the resulting clad deformations are correctly assessed by ALCYONE.
IV.B. Fuel Melting
The ALCYONE melting model is temperature dependent, and the melting process is thus completely reversible, as is physically expected. To assess melting, simulation results obtained at hot state, therefore, must be considered. They can be compared to local measurements from LOM performed at PPN after the ramp. This comparison obviously neglects the impact of melted fuel shrinkage when resolidification takes place and has to be kept in mind. presents the calculated radial temperature profiles at PPN and RTL (70 kW·m−1). The liquidus temperature (2835°C) is reached in the calculation with +5% on the LHGR.
Fig. 19. Calculated radial profiles of temperature at RTL and PPN. The solidus and liquidus temperatures and the 1800°C isotherm are also indicated.
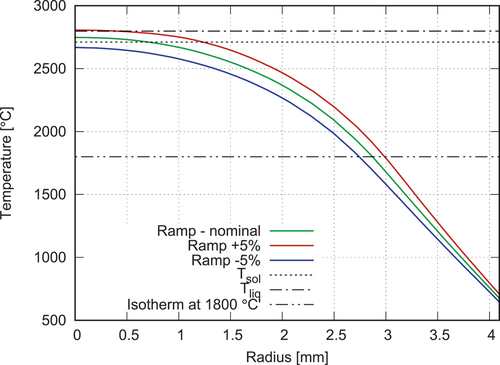
From LOM, the transition between the columnar grain region and the equi-axed grain region is effective at a radius of 2.8 mm (see Sec. II). This transition is usually associated with a local temperature of about 1800°C.[Citation10] The isothermal at 1800°C is thus also reported in . The radii at which 1800°C is reached in the calculations vary between 2.7 and 3 mm. They are consistent with the measured 2.8 mm.
In , the calculated radial profiles of the liquid fuel fraction at PPN and RTL are presented. The 5% uncertainty on the LHGR is taken into account.
Fig. 20. Calculated radial profiles of the liquid fuel fraction at RTL and PPN.
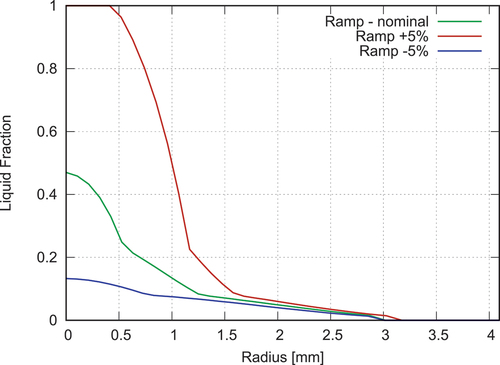
As discussed in Sec. III, the temperature at which a 0.2 liquid fuel fraction is reached defines the solidus temperature. The fuel cannot be considered melted below this temperature, but some positive impact of the minor liquid phases that form on the thermal conductivity of the fuel cannot be excluded. In fact, the thermal conductivity of molten fuel in ALCYONE is higher than that of solid fuel, meaning that any formation of a liquid phase in the fuel will improve the thermal conductivity of the material and hence decrease the fuel pellet temperature (so-called positive impact).
In the calculation with 5% extra power, the solidus temperature is reached at a radius of 1.25 mm, while the liquidus temperature is exceeded at a radius of 0.4 mm. Recalling that fuel shrinkage of the melted zone during cooling down is not considered in this calculation, the calculated radial position of the liquidus temperature (0.4 mm) appears consistent with the estimation of Arimescu et al.[Citation5] based on the central hole and porous band radii (see Sec. II.C). The radial position where the solidus temperature (2765°C) is reached in this calculation is furthermore consistent with the boundary between the dense fuel and the columnar grain regions (~1.2 mm).
In the calculation at nominal power, the liquidus temperature is not reached (no fully molten fuel). A 0.2 liquid fuel fraction corresponding to the solidus temperature (2765°C) is exceeded at a radius of 0.7 mm, while the liquid fuel fraction at the pellet center reaches 0.46, meaning that melting and not melted fuel are expected. The radius where the solidus temperature is reached (0.7 mm) is somehow consistent with the porous band radius (0.4 to 0.5 mm). The liquid fuel fraction at the boundary between the dense fuel and columnar grain regions (radius 1.2 mm) is close to 0.1.
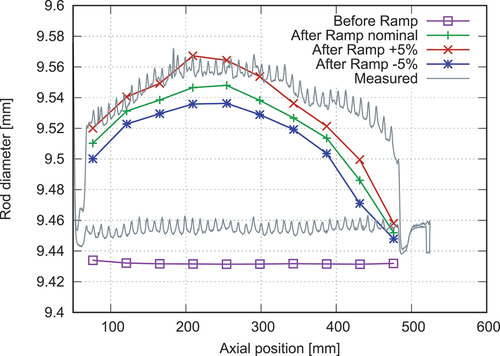
To analyze in more detail the impact of fuel melting on clad strains, it is of interest to plot the axial profiles of the melting fuel radii, i.e., corresponding to the radial positions of the solidus temperature (2765°C) where an 0.2 liquid fuel fraction is calculated. They are shown in .
Fig. 21. Calculated axial profiles of the melting fuel radii at RTL, with the measured rod diameter after the power ramp (right y-scale). The radii of the inner porous and pore-free rings are also indicated.
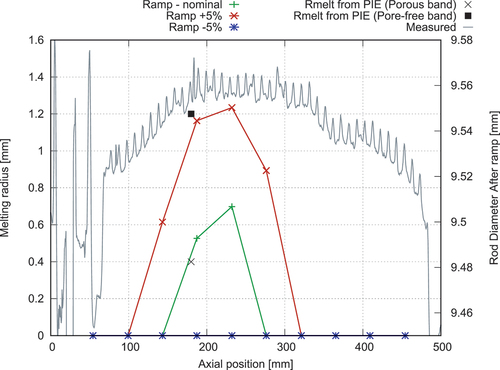
The melting fuel radius in the simulation with 5% extra power (red curve) is consistent with the outer radius of the pore-free band (black filled square), i.e., at the boundary between the dense fuel and columnar grain regions. The melting fuel radius is relatively constant axially around the PPN (axial position 200 mm). This is also the axial location where the clad diameter profile is flat (180 to 300 mm).
The melting fuel radius in the simulation at nominal power (green curve) matches perfectly with the radial position of the porous band outer boundary (black cross). The flat clad diameter profile corresponds roughly to the axial location where the melting fuel radius is non-zero.
IV.C. Pellet-Clad Gap and Pellet Swelling
The LOM transverse cross section of was thoroughly analyzed at Studsvik, and measurements of the residual pellet diameter at PPN (minimum-maximum, 8.381 to 8.389 mm) were provided. Measurements of the residual and relocated radial gaps were furthermore obtained by compressing the rod transversally (see Appendix A for a detailed description of the experimental procedure and of the measurements) at three axial positions (~200, 350, and 450 mm). shows the calculated pellet-clad radial gaps at the end of the power ramp and reports the different measurements. The cold gap in the graph refers to the measurement obtained from LOM at PPN. Note that it is consistent with the residual gaps obtained during the compression of the rod (loading phase, see Appendix A). shows the calculated residual pellet diameters compared to the measure from the LOM on the transverse cross section. Simulations with the 5% uncertainty on the power are presented.
Fig. 22. (a) Calculated axial profiles of the pellet-clad gap at the end of the power ramp compared to the measured cold, residual, and relocated gaps. (b) Calculated axial profiles of the residual pellet diameter compared to the estimates by LOM.
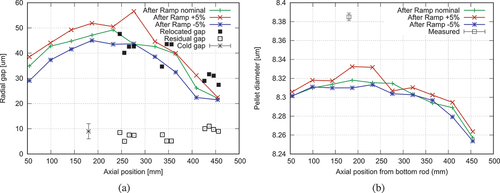
A very good agreement between the calculated gaps and the measured relocated gaps was obtained. The relocated gaps are representative of the gaps after relocation of the fuel pellet fragments, i.e., after elimination of the voids related to pellet cracks. The ALCYONE pellet cracking model includes a description of pellet cracking in the radial, circumferential, and axial directions. Originally implemented in the 2D and 3D schemes of ALCYONE,[Citation46] it is also used in 1.5D simulations. Since the fuel cracking model used in the code assumes complete reversibility of crack openings upon unloading, it is not surprising that the pellet-clad gaps calculated at the end of the xM3 power ramp are in better agreement with the relocated gaps than the residual gaps. The agreement is good not only in the PPN region (200 to 250 mm/bottom of the fissile column), but also at the two other axial locations where measurements have been made. The residual pellet diameter is underestimated by at least 50 to 70 μm. This difference corresponds approximately to twice the difference between the relocated and residual radial gaps (~30 to 40 μm), which characterizes the voids/cracks in the fuel pellet. The underestimation in ALCYONE is therefore mostly related to the reversibility of the cracks in the code.
IV.D. Fission Gases and Porosity
FGR reached 56 cm3 at the end of the xM3 power ramp (corresponding to 31% to 34% of the preramp fission gas inventory in the rod). Simulations led to a calculated released gas volume of 37 to 50 cm3 during the ramp phase (22% to 30% of the preramp inventory in the rod), depending on the power uncertainty (5%). The calculated radial profiles of Xe concentration at the end of the simulations are compared in to the measured EPMA profile of Xe.
Fig. 23. Calculated radial profiles of Xe at RTL and at PPN. The measured EPMA profile is also indicated.
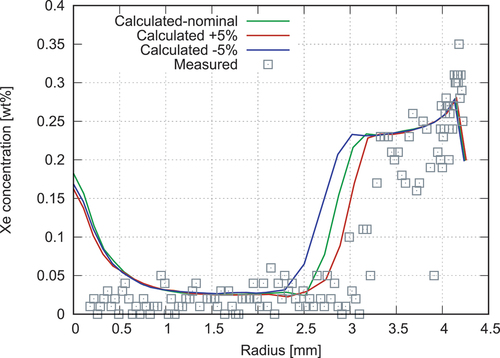
The calculated radial profiles of the fission gases indicate that almost all the gases left the fuel pellet center up to a radius of 2.4 to 2.8 mm during the power ramp, consistently with the boundary of the columnar grain region. This trend is independent of melting since the calculation with −5% on the LHGR and no melting led to the same result. Overall, there is a reasonable agreement between the calculated and measured profiles. In particular, the transition at 2.4 to 2.8 mm is well caught in the simulations. On this particular point, the EPMA profile fits best when +5% on the LHGR is considered (red curve). It is well known that the sample preparation for PIEs and the formation of bubbles lead to some underestimation of the Xe retention in the fuel when measured by EPMA.[Citation51] This is in particular the case at the boundary of the columnar grain region (2.8 mm) where numerous intragranular bubbles are visible (see ). This might explain to some extent the better agreement with the Xe profile calculated with +5% on the LHGR.
Furthermore, there are two main differences between the calculated and measured profiles that originate from the modeling of fission gases in MARGARET: the higher Xe concentration calculated at the pellet center and the decreasing Xe concentration calculated at the pellet rim. The higher Xe concentration calculated at the pellet center is due to the smaller thermal gradient at this radial position, which hinders the temperature gradient–driven migration of intra-granular bubbles, and hence, FGR. The decrease of the Xe concentration at the pellet outer surface is a consequence of fission product implantation in the cladding or zirconia layer that forms at the pellet-clad interface.[Citation52]
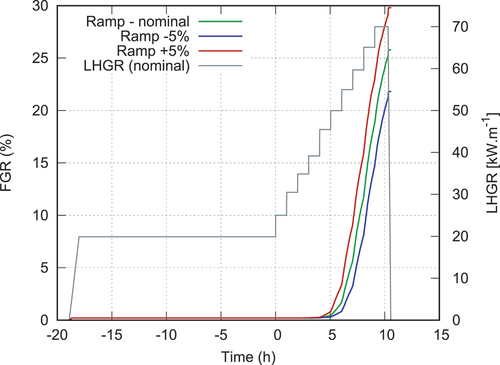
gives the FGR kinetics during the simulations of the xM3 power ramp. Interestingly, FGR takes place early during the power ramp, with most of it occurring during the 50 to 65 kW·m−1 steps and plateaus. Five percent FGR is obtained during the last step at RTL (70 kW·m−1). This confirms that a specific refinement of the FGR model related to melting is not essential to capture the release of fission gases. This is due to the high temperatures that are reached at the pellet center during the intermediate plateaus at 50 to 65 kW·m−1 and to the 1-h duration of the plateaus. This conclusion might not hold, however, in the case of faster power ramps with shorter holding times.
Fig. 24. Calculated FGR kinetics during the xM3 power ramp.
The calculated radial profiles of porosity (initial porosity plus fission gas bubbles) are presented in , where they are compared to the measurements. As can be seen, there are some marked differences between the calculated and measured porosities. The porosity increase calculated at the pellet center (up to 5%) is consistent with the non-zero Xe concentration calculated at the end of the power ramp (see ). In this region, fission gases are mostly predicted to be in intra-granular bubbles that swell during the power transient, explaining the important porosity increase. This result is inconsistent with the measured quasi-null porosity in the dense fuel layer, but may be related to the fact that the central hole formation is not simulated by ALCYONE.
Fig. 25. Calculated radial profiles of porosity (initial porosity plus fission gas bubbles) at RTL and PPN compared to the measurements.
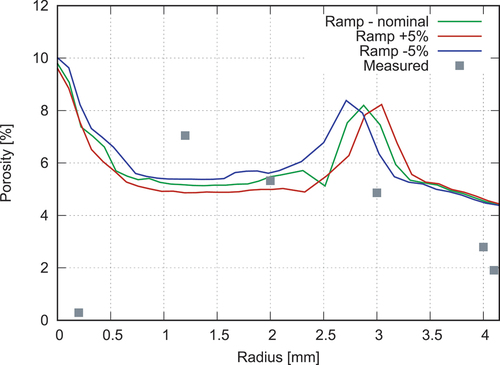
A significant porosity increase of up to 3% is also calculated at a radius of 2.5 to 3.2 mm, depending on the simulation. This result is also a consequence of the pronounced intra-granular bubble swelling that took place in this region during the power ramp. In fact, according to , fission gases did not leave the fuel pellet at this radial position. The temperatures reached at least 1800°C during the 1-h-long plateau at RTL, which is sufficient to trigger intra-granular bubble swelling. The smaller than calculated porosity estimated at the pellet periphery could be related to the prevalence of pores of small dimensions in this region that have not been measured at Studsvik (measured pore diameters were between 0.24 and 24 μm).
V. DISCUSSION
V.A. Central Hole Formation
It is of interest first to discuss the results, keeping in mind that most of the codes during the P2M simulation exercise did not predict melting during the xM3 power ramp.[Citation7,Citation8] For this reason, a refined definition of melting has been incorporated in ALCYONE based on advanced thermochemical equilibrium calculations of the U-O-Pu-fission product system. In particular, the proposed melting model makes a clear distinction between melting (solidus temperature is reached but not the liquidus) and molten fuel (liquidus temperature is reached). The solidus temperature in the xM3 fuel is 70°C below the liquidus temperature. It is not clear in the open literature if the so-called melt radius should be defined from the solidus or the liquidus temperature. As most of the correlations do not distinguish the two, this point is usually not discussed.
Consistent with other code results, molten fuel during the xM3 power ramp is only calculated with ALCYONE if the power uncertainty of +5% is considered. In this case, the calculated melt radius (~0.4 mm) corresponds to the radial position where the liquidus is reached. Its size is consistent with the estimation of Arimescu et al.[Citation5] based on the radii of the central hole (0.15 mm) and of the so-called porous band, assuming the central hole originates from the shrinkage of the once molten fuel region during cooling down. In this simulation, the dense fuel boundary (1.2 mm) corresponds to the radius where the solidus temperature is reached.
At nominal power, no molten fuel is calculated (the liquidus temperature is not reached). Melting fuel (solidus temperature is reached), however, is found up to a radius of 0.4 mm, which corresponds with the estimated melt radius of Arimescu et al.[Citation5] based on the size of the porous band and of the central hole. The liquid fuel fraction reaches a maximum of 0.46 at the pellet center. A 0.1 liquid fuel fraction is found at the boundary of the dense fuel region (1.2 mm). Assuming shrinkage during solidification of the fuel is proportional to the liquid fuel fraction (with 10% shrinkage for molten fuel, i.e., for a liquid fuel fraction of 1), the shrinkage of a 1.2-mm large region of melting fuel (with a calculated average liquid fuel fraction of 0.18) leads to a central hole radius (0.16 mm) consistent with the one measured on the transverse cross section (0.15 mm). This means that the observed central hole at the pellet center does not require molten fuel to appear if shrinkage is the mechanism at its origin.
Simulations with molten or melting fuel can both explain the formation of the central hole by shrinkage during cooling down. Considering the very high LHGR and the staircase power history with long plateaus, it is also possible that the central hole appeared at hot state in consequence of the pore migration mechanism related to uranium dioxide vaporization. Pore migration is known to occur up the temperature gradient if the temperature is sufficient[Citation15] and the ramp kinetics is sufficiently slow.[Citation16] Some of the PIEs after the xM3 power ramp seem to corroborate the development of a central hole at hot state. In fact, the clad residual strains in the high power region of the rod are best estimated considering a 5% reduction of the LHGR. This result is in contradiction to the calculated liquid fuel fractions that lead to molten fuel at the pellet center only when the LHGR is increased by 5%. In theory, the 10% expansion upon melting should lead to an increase of the clad strains in the region where fuel melts. Measurements show on the contrary a flat clad strain axial profile in the high power region that is not reproduced by the simulation.
The presence of voids in the fuel pellet, such as a central hole or a dish, is known to reduce significantly the radial expansion of the fuel pellet during power ramps,[Citation17] and consequently, the clad strains. In ALCYONE, the fuel mechanical model describes the potential dish filling by fuel thermal creep.[Citation53] Complete dish filling is calculated at PPN during the xM3 power ramp. The formation of the central hole at hot state via fuel vaporization and pore migration, however, is not considered and could be the reason behind the observed flat clad strain axial profile since it provides an additional free volume to accommodate pellet expansion.
V.B. Modeling of Central Hole Formation
Two recent papers were concerned with the coupled modeling of heat transport and pore migration in nuclear fuels. Novascone et al.[Citation16] used the BISON code to describe pore migration in MOX fuels. They investigated the impact of pore migration and central hole formation on fuel melting and concluded that the dense fuel region adjacent to the central hole tends to reduce the temperature reached at the fuel pellet center. The improved thermal conductivity of the fuel in the dense region explains this result. Barani et al.[Citation54] reformulated the coupled thermal-pore migration equations in order to improve the numerical stability of the scheme. Both authors used the FE method to solve the system and performed 2D simulations.
The pore migration model they implemented was proposed by Sens in 1972[Citation15] and considers uranium dioxide vaporization from the hot to cold face of lenticular pores as the transport mechanism at the origin of pore migration. It was proposed initially for UO2 and not MOX fuel, and is therefore a priori suitable for the xM3 fuel. In this section, the coupled system of equations proposed by Barani et al.[Citation54] is considered. The one-dimensional (1D) pore transport equation in cylindrical coordinates r reads as follows:
where p is the fuel porosity and v is the pore migration velocity. The expression of the pore velocity proposed by Sens[Citation15] is detailed in Appendix C. It depends on temperature and on the radial temperature gradient. Conversely, the heat balance equation depends on the fuel porosity and reads as follows[Citation54]:
where is the fuel density (kg·m−3),
is the heat capacity of the fuel (J·kg−1·K−1),
is the thermal conductivity of the fuel (W·m−1·K−1),
is the porosity of the fuel before the power ramp, and
is the volumetric heat generation rate (W·m−3). This formulation conveniently ensures that the local heat generation rate vanishes in the central hole region when p = 1. The fuel density, the thermal conductivity, and the heat source term depend on porosity, which explains why the system of EquationEqs. (8)
(8)
(8) and Equation(9)
(9)
(9) must be solved at the same time. To guarantee the conservation of pore volume in the pellet and to avoid the introduction of artificial diffusion,[Citation16] the system is here solved by the finite volume method. A specific program has been written in Fortran to solve the coupled system of equations.
V.C. Simulation Results
The thermal properties given in Sec. III have been used in the simulations of pore migration coupled to heat transfer in the pellet. The radially dependent volumetric heat generation rate was extracted from ALCYONE considering the slice at PPN (simulation at nominal LHGR). The clad temperatures calculated by ALCYONE were also used as boundary conditions at each time step. It was first checked that the temperature and liquid fuel fraction calculated at the pellet center during the xM3 power ramp without considering pore migration were equal to those obtained in the simulation with ALCYONE. The porosity of the fuel before the power ramp
was considered constant in the pellet and taken equal to the as-fabricated value, i.e., 4.7%. The calculated radial profile of porosity at the end of the power plateau at 70 kW/m is given in . The simulations were performed with a mesh size of 0.01 mm to catch the small size of the central hole.
Fig. 26. Radial profile of porosity calculated at the end of the plateau at 70 kW/m considering a 4.7% initial porosity.
The simulation led to a central hole radius of 0.5 mm (where the porosity is equal to 1), followed by a ring of dense fuel up to a radius of 1.7 mm, with a porosity close to zero. A progressive increase of the porosity was then seen up to a radius of 2.7 mm, where the initial porosity is recovered. While the size of the central hole is clearly overestimated (measured radius of 0.15 mm), the size of the dense region is relatively consistent with the measurements (1.2 mm in the transverse section). The calculated residual porosity in this region (around 0.2% to 0.3%) is in good agreement with the low 0.2% measured by Studsvik (see ).
In the simulation, the integral of the calculated porosity loss in the porosity-depleted regions (radius between 0.5 and 2.7 mm) is consistent with the size of the calculated central hole. This is not the case when the size of the measured central hole is compared to the porosity loss of the measured dense fuel region. This means that either some of the pores were not measured in the dense fuel region or part of the pores migrated down the temperature gradient, as Studsvik’s measurements tend to indicate. In fact, the measured porosity in the columnar grain region adjacent to the dense zone reached 7%, exceeding by 2% the initial porosity (see , radius 1.2 mm).
shows the calculated evolution of the porosity at the fuel pellet center and at PPN during the power ramp. Pore migration starts during the plateau at 50 kW·m−1 and accelerates during the plateau at 55 kW·m−1 , where the porosity reaches ~0.7. The central hole formation takes place at the very beginning of the plateau at 60 kW·m−1 in approximately 3 min. The impact of pore migration on the fuel temperature is shown in , where the temperature evolution at the pellet center is calculated with and without coupling with the pore migration mechanism.
Fig. 27. Calculated evolution of the porosity at the pellet center and at PPN during the xM3 power ramp.
Fig. 28. Calculated evolution of the temperature at the pellet center during the xM3 power ramp with and without coupling with the pore migration mechanism.
The development of the central hole during the power ramp has a strong impact on the maximum fuel temperature at the pellet center. During the plateau at 60 kW·m−1, where the central hole appears, the maximum temperature in the coupled simulation is 55°C below the maximum temperature of the simulation without coupling. The impact is more pronounced once the central hole is formed, with a difference reaching 134°C during the 70 kW·m−1 plateau. The maximum liquid fuel fraction at the end of the coupled simulation (0.05) is smaller than that of the simulation without the pore migration mechanism (0.47), which confirms the potential inhibition of melting related to the prior formation of a central hole.
VI. CONCLUSIONS
In this paper, simulations of the staircase power ramp xM3 with the fuel performance code ALCYONE have been detailed. The code has been upgraded to include a continuous description of the material properties during fuel melting based on reasonable assumptions and on models for the properties of solid fuel already available in the code. The modeling of phase change is based on thermodynamic equilibrium calculations performed with the solver OC and the TAF-ID. The calculations include the fission products and actinides that are formed in the fuel matrix during irradiation. They were used to define the evolution of the liquid fuel fraction with temperature on the range of interest (room temperature to 3000°C). The inclusion of the fission products leads to distinct solidus and liquidus temperatures separated by a few tens of degrees Celsius.
The thermodynamic calculations performed on the xM3 fuel pre-irradiated up to 30 GWd/tU−1 led to a solidus temperature of 2765°C and to a liquidus temperature of 2835°C. The simulations of the xM3 power ramp showed that the liquidus temperature (2835°C) is reached at the pellet center only if the 5% uncertainty on the LHGR is taken into account. In this case, the boundary of the porous band identified by Arimescu et al.[Citation5] corresponds to the calculated melt radius based on the liquidus temperature (0.4 mm). The boundary of the recrystallized or dense fuel zone (radius 1.2 mm) corresponds with the calculated solidus temperature. The central hole of radius 0.15 mm therefore can be attributed to the shrinkage of the once molten fuel pellet core (of radius 0.4 mm) upon cooling down.
The simulations of the xM3 power ramp with the nominal LHGR indicate that the solidus temperature is exceeded at the pellet center but not the liquidus. In this case, the outer radius of the porous band (0.4 mm) corresponds to the radial position where the solidus temperature is reached. The boundary of the recrystallized zone (radius 1.2 mm) corresponds approximately to the radial position where the liquid fuel fraction reaches 0.1. The central hole can be attributed to the shrinkage of the melting (or partially molten) fuel pellet core (of radius 1.2 mm).
The impact of pore migration during the xM3 power ramp was investigated by independent simulations based on ALCYONE calculations. A 1D radial thermal analysis coupled to the pore migration model of Sens[Citation15] was proposed. It showed that the staircase protocol of the xM3 power ramp could lead to the formation of a central hole of radius 0.15 mm by the sole pore migration mechanism and that the solidus temperature would in this case not be reached at the pellet center. This lower temperature is a consequence of the fuel densification around the central hole associated with pore migration, which improves the thermal conductivity of the fuel.
In conclusion, the three simulations were able to explain the formation of a central hole and of an adjacent dense fuel region during the xM3 power ramp. This shows that the modeling of incipient melting during staircase power ramps, as planned in the P2M project, can be improved to some extent. Coupling the thermal analysis with the pore migration mechanism appears essential since the latter reduces the temperatures at the pellet center and might suppress fuel melting. Consistency with the nodal fission gas models available in ALCYONE, or in other fuel performance codes where porosity is one of the state variables, should also be ensured in the future. The foreseen staircase power-to-melt experiments and PIEs planned in the P2M project should provide important data to assess which of the mechanism is at the origin of the central hole formation in oxide fuels at high temperatures and of the adjacent dense fuel region.
Acknowledgments
The authors would like to acknowledge Mitsubishi Nuclear Fuel, Studsvik, and the SCIP project and community for the extensive data used during this simulation exercise on the xM3 power ramp in the frame of the FIDES/P2M Joint ExpErimental Programme (JEEP). The CEA authors thank Laurence Noirot for her help on the MARGARET fission gas model, Chrystelle Nonon-Solaro for her support of the P2M project, and Gilles Bignan for his support in the FIDES framework.
Disclosure Statement
No potential conflict of interest was reported by the authors.
References
- M. BALES, “The Framework for IrraDiation experimentS (FIDES),” presented at the TopFuel Conf., Raleigh, North Carolina (2022).
- B. BOER and M. VERWERFT, “Qualification of the New Pressurized Water Capsule (PWC) for Fuel Testing at BR2,” Proc. RRFM 2021, September 26–30 2021, Helsinki, Finland (2021).
- G. BONNY et al., “Re-Evaluation of a Power-to-Melt Experiment Performed in the High Burnup Chemistry International Program,” Nucl. Technol., 210, 2, 216 (2013); https://doi.org/10.1080/00295450.2023.2264505.
- U. ENGMAN, “Step Ramp Test of the PWR Test Rod xM3 with ZIRLO Radial Texture,” Studsvik Technical Note N-09/180 Rev. 1, STUDSVIK-SCIP-II-146, Studsvik (2012).
- V. ARIMESCU et al., “Third SCIP Modeling Workshop: Beneficial Impact of Slow Power Ramp on PCI Performance,” Proc. WRFPM 2014, Paper No. 100045, Sendai, Japan, September 14–17, 2014 (2014).
- V. ARIMESCU and J. KARLSSON, “Towards Understanding Beneficial Effects of Slow Power Ramps,” J. Nucl. Sci. Technol. (2015); http://dx.doi.org/10.1080/00223131.2015.1023382.
- V. D’AMBROSI et al., “P2M Simulation Exercise on Past Fuel Melting Irradiation Experiments: Main Outcomes on Fuel Melting Assessment in PWR Fuel,” presented at the TopFuel Conf., Raleigh, North Carolina (2022).
- V. D’AMBROSI et al., “P2M Simulation Exercise on Past Fuel Melting Irradiation Experiments,” Nucl. Technol., 210, 2, 189 (2023); http://dx.doi.org/10.1080/00295450.2023.2194270.
- H.-U. ZWICKY, “Post-Irradiation Examinations of Ramped Rodlets xM1, xM2 and xM3,” Studsvik Technical Report N-12/125 Rev. 1, STUDSVIK-SCIP-II-140, Studsvik (2012).
- J. ROBERTSON et al., “Temperature Distribution in UO2 Fuel Elements,” J. Nucl. Mater., 7, 3, 225 (1962); http://dx.doi.org/10.1016/0022-3115(62)90243-X.
- D. DE HALAS and G. HORN, “Evolution of Uranium Dioxide Structure During Irradiation of Fuel Rods,” J. Nucl. Mater., 8, 2, 207 (1963); http://dx.doi.org/10.1016/0022-3115(63)90036-9.
- M. FRESHLEY, “Operation with Fuel Melting,” Nucl. Eng. Des., 21, 2, 254 (1972); http://dx.doi.org/10.1016/0029-5493(72)90076-3.
- D. FREUND, D. GEITHOFF, and H. STEINER, “Evaluation of the Power-to-Melt Experiments POTOM,” J. Nucl. Mater., 204, 228 (1993); http://dx.doi.org/10.1016/0022-3115(93)90221-J.
- I. MASAKI et al., “Power-to-Melts of Uranium-Plutonium Oxide Fuel Pins at a Beginning-of-Life Condition in the Experimental Fast Reactor JOYO,” J. Nucl. Mater., 323, 1, 108 (2003); http://dx.doi.org/10.1016/j.jnucmat.2003.08.030.
- P. SENS, “The Kinetics of Pore Movement in UO2 Fuel Rods,” J. Nucl. Mater., 43, 3, 293 (1972); http://dx.doi.org/10.1016/0022-3115(72)90061-X.
- S. NOVASCONE et al., “Modeling Porosity Migration in LWR and Fast Reactor MOX Fuel Using the Finite Element Method,” J. Nucl. Mater., 508, 226 (2018); http://dx.doi.org/10.1016/j.jnucmat.2018.05.041.
- J. SERCOMBE et al., “2.14—Modelling of Pellet Cladding Interaction,” Comprehensive Nuclear Materials, R. KONINGS and R. STOLLER, Eds., Elsevier, Oxford (2020).
- B. MICHEL et al., “Two Fuel Performance Codes of the PLEIADES Platform: ALCYONE and GERMINAL,” Nuclear Power Plant Design and Analysis Codes, pp. 207–233, Elsevier (2021).
- B. MICHEL et al., “Simulation of Pellet-Cladding Interaction with the PLEIADES Fuel Performance Software Environment,” Nucl. Technol., 182, 2, 124 (2013); http://dx.doi.org/10.13182/NT13-A16424.
- “Cast3M,” CEA; http://www-cast3m.cea.fr/.
- E. GEIGER et al., “Modelling Nuclear Fuel Behaviour with TAF-ID: Calculations on the VERDON-1 Experiment, Representative of a Nuclear Severe Accident,” J. Nucl. Mater., 522, 294 (2019); http://dx.doi.org/10.1016/j.jnucmat.2019.05.027.
- A. GERMAIN et al., “Modeling High Burnup Fuel Thermochemistry, Fission Product Release and Fuel Melting During the VERDON 1 and RT6 Tests,” J. Nucl. Mater., 561, 153527 (2022); http://dx.doi.org/10.1016/j.jnucmat.2022.153527.
- “ What is OpenCalphad,” OpenCalphad Software; http://www.opencalphad.com/.
- B. SUNDMAN et al., “OpenCalphad—A Free Thermodynamic Software,” Integr. Mater. Manuf. Innovation, 4, 1 (2015); http://dx.doi.org/10.1186/s40192-014-0029-1.
- B. BAURENS et al., “3D Thermo-Chemo-Mechanical Simulation of Power Ramps with ALCYONE,” J. Nucl. Mater., 452, 518 (2014); http://dx.doi.org/10.1016/j.jnucmat.2014.06.021.
- P. KONARSKI, “Thermo-Chemical-Mechanical Modeling of Nuclear Fuel Behavior. Impact of Oxygen Transport in the Fuel on Pellet Cladding Interaction,” PhD Thesis, INSA, Lyon, France (2019).
- C. INTRONI, J. SERCOMBE, and B. SUNDMAN, “Development of a Robust, Accurate and Efficient Coupling Between PLEIADES/ALCYONE 2.1 Fuel Performance Code and the OpenCalphad Thermo-Chemical Solver,” Nucl. Eng. Des., 369, 110818 (2020); http://dx.doi.org/10.1016/j.nucengdes.2020.110818.
- C. GUÉNEAU et al., “TAF-ID: An International Thermodynamic Database for Nuclear Fuels Applications,” Calphad, 72, 102212 (2021); http://dx.doi.org/10.1016/j.calphad.2020.102212.
- “Thermodynamics Advanced Fuels—International Database (TAF-1D),” Nuclear Energy Agency (2013); https://www.oecd-nea.org/science/taf-id/.
- C. GUÉNEAU et al., “Thermodynamic Modelling of Advanced Oxide and Carbide Nuclear Fuels: Description of the U-Pu-O-C Systems,” J. Nucl. Mater., 419, 1–3, 145 (2011); http://dx.doi.org/10.1016/j.jnucmat.2011.07.033.
- D. MANARA et al., “Melting of Stoichiometric and Hyperstoichiometric Uranium Dioxide,” J. Nucl. Mater., 342, 1, 148 (2005); http://dx.doi.org/10.1016/j.jnucmat.2005.04.002.
- C. INTRONI et al., “Phase-Field Modeling with the TAF-ID of Incipient Melting and Oxygen Transport in Nuclear Fuel During Power Transients,” J. Nucl. Mater., 556, 153173 (2021); http://dx.doi.org/10.1016/j.jnucmat.2021.153173.
- T. HIROSAWA and I. SATO, “Burnup Dependence of Melting Temperature of FBR Mixed Oxide Fuels Irradiated to High Burnup,” J. Nucl. Mater., 418, 1, 207 (2011); http://dx.doi.org/10.1016/j.jnucmat.2011.07.001.
- L. SIEFKEN et al., “SCDAP/RELAP5/MOD 3.3 Code Manual. MATPRO: A Library of Materials Properties for Light-Water-Reactor Accident Analysis,” Technical Report NUREG/CR-6150, Vol. 4, Rev. 2, INEL-96/0422, Idaho National Laboratory (2001).
- J. CHRISTENSEN, R. ALLIO, and A. BIANCHERIA, “Melting Point of Irradiated Uranium Dioxide,” Atomic Power Division, Westinghouse Electric Corp. (1965).
- A. MAGNI et al., “Report on the Improved Models of Melting Temperature and Thermal Conductivity for MOX Fuels and JOG,” Technical Report D6.2, Version 2, INSPYRE (2020).
- A. MAGNI et al., “Modelling and Assessment of Thermal Conductivity and Melting Behaviour of MOX Fuel for Fast Reactor Applications,” J. Nucl. Mater., 541, 152410 (2020); http://dx.doi.org/10.1016/j.jnucmat.2020.152410.
- M. ADAMSON, E. AITKEN, and R. CAPUTI, “Experimental and Thermodynamic Evaluation of the Melting Behavior of Irradiated Oxide Fuels,” J. Nucl. Mater., 130, 349 (1985); http://dx.doi.org/10.1016/0022-3115(85)90323-X.
- J. J. CARBAJO et al., “A Review of the Thermophysical Properties of MOX and UO2 Fuels,” J. Nucl. Mater., 299, 3, 181 (2001); http://dx.doi.org/10.1016/S0022-3115(01)00692-4.
- K. GEELHOOD et al., “MatLib-1.0: Nuclear Material Properties Library,” Technical Report PNNL 29728, Pacific Northwest National Laboratory (2020).
- K. KONNO and T. HIROSAWA, “Melting Temperature of Mixed Oxide Fuels for Fast Reactors,” J. Nucl. Sci. Technol., 39, 7, 771 (2002); http://dx.doi.org/10.1080/18811248.2002.9715259.
- J. KOMATSU, T. TACHIBANA, and K. KONASHI, “The Melting Temperature of Irradiated Oxide Fuel,” J. Nucl. Mater., 154, 1, 38 (1988); http://dx.doi.org/10.1016/0022-3115(88)90116-X.
- P. LUCUTA, H. MATZKE, and I. HASTINGS, “A Pragmatic Approach to Modelling Thermal Conductivity of Irradiated UO2 Fuel: Review and Recommendations,” J. Nucl. Mater., 232, 2–3, 166 (1996); http://dx.doi.org/10.1016/S0022-3115(96)00404-7.
- D. MARTIN, “The Elastic Constants of Polycrystalline UO2 and (U, Pu) Mixed Oxides: A Review and Recommendations,” High Temp. High Pressures, 21, 1, 13 (1989).
- M. LAINET et al., “GERMINAL, a Fuel Performance Code of the PLEIADES Platform to Simulate the In-Pile Behaviour of Mixed Oxide Fuel Pins for Sodium-Cooled Fast Reactors,” J. Nucl. Mater., 516, 30 (2019); http://dx.doi.org/10.1016/j.jnucmat.2018.12.030.
- J. SERCOMBE, I. AUBRUN, and C. NONON, “Power Ramped Cladding Stresses and Strains in 3D Simulations with Burnup-Dependent Pellet-Clad Friction,” Nucl. Eng. Des., 242, 164 (2012); http://dx.doi.org/10.1016/j.nucengdes.2011.08.069.
- V. D’AMBROSI et al., “Homogenization Approach to Model the Thermal-Mechanical Behavior of Melting Fuel Material,” J. Nucl. Mater., 535, 152149 (2020); http://dx.doi.org/10.1016/j.jnucmat.2020.152149.
- D. MARTIN, “The Thermal Expansion of Solid UO2 and (U, Pu) Mixed Oxides—A Review and Recommendations,” J. Nucl. Mater., 152, 2–3, 94 (1988); http://dx.doi.org/10.1016/0022-3115(88)90315-7.
- J. FINK, “Thermophysical Properties of Uranium Dioxide,” J. Nucl. Mater., 279, 1, 1 (2000); http://dx.doi.org/10.1016/S0022-3115(99)00273-1.
- L. NOIROT, “MARGARET: A Comprehensive Code for the Description of Fission Gas Behavior,” Nucl. Eng. Des., 241, 6, 2099 (2011); http://dx.doi.org/10.1016/j.nucengdes.2011.03.044.
- M. VERWERFT, “Multiple Voltage Electron Probe Microanalysis of Fission Gas Bubbles in Irradiated Nuclear Fuel,” J. Nucl. Mater., 282, 2–3, 97 (2000); http://dx.doi.org/10.1016/S0022-3115(00)00421-9.
- C. SCHNEIDER, “Physical, Chemical and Mechanical Changes at the Fuel-Cladding Interface of Irradiated PWR Fuel Rods,” PhD Thesis, Université Bourgogne Franche-Comté (2022) ( in French).
- J. JULIEN et al., “Adjustment of Fuel Creep Behavior Based on Post-Ramp Dish Filling Observations and 3D Simulations. Impact on Clad Ridges,” presented at the TopFuel Conf., Manchester, United Kingdom (2012).
- T. BARANI, I. RAMIÈRE, and B. MICHEL, “Analysis of Fabrication and Crack-Induced Porosity Migration in Mixed Oxide Fuels for Sodium Fast Reactors by the Finite Element Method,” J. Nucl. Mater., 558, 153341 (2022); http://dx.doi.org/10.1016/j.jnucmat.2021.153341.
- A. MAGNI et al., “Modelling of Thermal Conductivity and Melting Behaviour of Minor Actinide-MOX Fuels and Assessment Against Experimental and Molecular Dynamics Data,” J. Nucl. Mater., 557, 153312 (2021); http://dx.doi.org/10.1016/j.jnucmat.2021.153312.
APPENDIX A
GAP MEASUREMENT
The rod is compressed transversally between two parallel flat edges, as shown in . The measurements are corrected for compliance in the apparatus. It is also corrected for the elasticity in the cladding. shows load displacement curves, illustrating the principle of the measurement. The measurements are plotted as load against the fuel pellets (applied force minus force to deform the cladding) as a function of cladding deformation (measured deformation minus the compliance in the apparatus). The gap size is arbitrarily defined as the deformation at a load of 50 N. The gap evaluated during loading corresponds to the situation before the measurement (residual gap). The gap measured during unloading is the relocated gap, when the pellet fragments had been pressed together. This value is more relevant, as any contribution from pellet cracks is minimized. Knowledge of the cold gap from metallography contributes to the overall picture.
Fig. A.1. (a) Setup for gap measurement and (b) recorded load displacement curves illustrating the principle of the measurement (reproduced from Ref. [Citation9]).
![Fig. A.1. (a) Setup for gap measurement and (b) recorded load displacement curves illustrating the principle of the measurement (reproduced from Ref. [Citation9]).](/cms/asset/b05de528-7b5f-45ec-b72f-4b722b68f93e/unct_a_2253660_f0029_oc.jpg)
APPENDIX B
CORRELATIONS FOR THE SOLIDUS AND LIQUIDUS TEMPERATURES OF IRRADIATED STOICHIOMETRIC UO2 FUEL (IN DEGREES CELSIUS)
In the following equations, is the melting temperature of stoichiometric fresh UO2 (in degrees Celsius) and Bu is the fuel burnup in GWd/tU−1. Note that the Pu content and stoichiometry deviation terms that appear in most of the correlations have been removed here:
Correlations of Komatsu et al.[Citation42]:
where .
Correlation of MATPRO[Citation34]:
Correlation of Carbajo et al.[Citation39] based on Adamson et al.[Citation38]:
Correlation of MatLib-1.0[Citation40]:
Correlation of Konno and Hirosawa[Citation41]:
Correlation of ESNII++[Citation36,Citation37]:
Note that a modified version of this correlation has recently been proposed by Magni et al.[Citation55] following the inclusion of minor actinides in the formulation (the exponential factor is equal to 41.01 instead of 40.43).
APPENDIX C
PORE VELOCITY
The pore velocity is taken from the work of Sens[Citation15] and reads as follows as a function of temperature T and of the radial temperature gradient :
with T in K, in K/cm,
in ergs/mol,
in dynes/cm2,
,
,
,
,
, and
in ergs/mol/K. With these units, the pore velocity is obtained in cm/s. To use SI units, the following conversions must be considered: 1 erg = 10−7 J and 1 dyne = 10−5 N.