
 ?Mathematical formulae have been encoded as MathML and are displayed in this HTML version using MathJax in order to improve their display. Uncheck the box to turn MathJax off. This feature requires Javascript. Click on a formula to zoom.
Abstract
Relevant atmospheric corrosion laboratory testing environments were developed to explore the influence of inert dust and seawater on the corrosion susceptibility of stainless steel in spent nuclear fuel dry storage conditions. Measurements from dust collected on in-service dry storage canisters were applied to develop exposure conditions. Three atmospheric exposure conditions, two static and one cyclic, were examined with three different surface coverages: co-deposited large dust and seawater, co-deposited small dust and seawater, and solely seawater.
Stainless steel coupons representative of spent nuclear fuel dry storage canister material were subjected to the various corrosion environments, with the results from exposures up to 1 year presented here. Post exposure, corrosion damage was analyzed using optical microscopy, scanning electron microscopy, and energy dispersive X-ray spectroscopy. Initial observations are presented herein, and potential implications with respect to the influence of inert dust particles on corrosion susceptibility are summarized. In general, the co-deposition of dust and salt resulted in larger pits and exhibited mixed modes of corrosion that were not observed in the no-dust conditions (i.e., crevicing, filiform, and pits within pits). The presence of the inert dust may influence brine spreading and/or act as crevice formers, leading to enhanced corrosion. This study highlights the significance of incorporating dust particulate(s) beyond the deliquescent chemistries to fully evaluate atmospheric corrosion severity.
I. INTRODUCTION
The potential for stress corrosion cracking (SCC) of storage canisters during long-term storage of spent nuclear fuel (SNF) has been identified as an issue of concern.[Citation1] In dry storage, SNF is stored in welded, stainless steel canisters enclosed in passively ventilated overpacks. Over time, as air is drawn through the overpacks, dust accumulates on the canister surfaces, and as the SNF cools, salts within that dust can deliquesce to form concentrated brines. If the salts contain aggressive species, such as chloride, then the resulting brine can cause localized corrosion, and if sufficient tensile stresses are present in the metal due to weld residual stresses, this could lead to SCC. Developing an improved understanding of the potential risk of canister SCC, especially under relevant atmospheric exposure conditions, is considered important to demonstrating the safety of long-term dry storage of SNF.
Inert mineral grains (i.e., nonsoluble, organic matter from plants, detrital mineral grains) have been observed to co-deposit with salt and other soluble species on canister surfaces. These detrital mineral grains are abundant in the dust, and while not chemically reactive, may affect corrosion processes by facilitating brine spreading via capillary processes and/or acting as crevice formers.[Citation2–5] If the dust acts to spread brine more evenly across a canister surface through capillary action, the thin water layers produced may be able to support larger areas of cathodic activity, thus leading to enhanced anodic attack. Additionally, the insoluble material on the surface can form crevices, creating regions in which local chemical environments can develop. Further, oxygen depletion can occur due to elongated or tortuous diffusion pathways through the dust/brine layer to the metal surface. Thus, insoluble dust may play a large role in the SCC susceptibility of austenitic stainless steel in atmospheric exposure environments.
To evaluate the role inert dust may play in SCC susceptibility, an atmospheric exposure environment was developed based on the size and distribution of real-world dust samples collected from independent spent fuel storage installations (ISFSIs). This paper describes an example collection process, the analysis of the inert dust size and distribution, and the developed relevant exposure conditions. The exposure setup (including laboratory dust deposition) is detailed herein, and initial results of the corrosion exposures are presented. These results are further discussed in relation to the influence of the relevant exposure environments on corrosion susceptibility and implications for the pit-to-crack transition and subsequent crack growth rates.
II. METHODS
II.A. Dust Collection
Information on the composition and size range of the inert dust particles present on the surface of SNF dry storage canisters is available from several sampling campaigns that have been undertaken over the past decade.[Citation6–9] These campaigns have demonstrated that deliquescent salts are present on dry storage canister surfaces, but commonly only make up a small fraction of the dusts present. The majority of the dust particles are detrital mineral grains, mostly quartz and aluminosilicate minerals, such as feldspars and clays. These are likely to be inert in brines formed by deliquescent salts under the atmospheric conditions relevant to SNF canisters stored at the ISFSIs. The information on the composition and the size and distribution of salts and inert mineral grains is based on the prior sampling campaigns; detailed descriptions of the sampling and the methods applied have been provided in previous reports and publications.[Citation6–9]
Two ISFSI sites are the exemplar sites discussed here.[Citation6,Citation7] Dust samples were collected from SNF dry storage canisters at those sites, and the sampling results, regarding dust size and morphology (specifically insoluble dust particulates), are summarized here. For more details, the reader is referred to the two parent reports.[Citation6,Citation7]
Horizontal storage systems were inspected with a remote crawler () that was placed on the canisters within their overpacks. It was moved over the surface on rubber treads using a Venturi valve to create a vacuum and to keep the robot on the canister surface. Samples were collected with a sampler on the underside of the crawler. The sampler held a rotatable sampling block with two samples located 180 deg from each other. Each sample consisted of a glass fiber filter sandwiched between two Scotch-brite® pads through which a vacuum was drawn. To collect a sample, the sampler would rotate the sampling block until one of the sampling pads was facing downward and in contact with the canister surface. Then the crawler would move a specified distance in order to sample a known area. Each sample pad was 1/2 in. (1.27 cm) wide, and the crawler was moved 6 in. (15.2 cm), collecting a sample from 3 sq. in. (19.35 cm2).
Fig. 1. (a) Remote robotic crawler with mounted sampling block and diagram of sampled area, and (b) schematic of a sampling block with two samples, each consisting of a glass fiber filter sandwiched between two porous Scotch-brite abrasive pads.
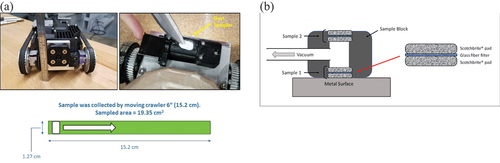
When not actively collecting the sample, the sample block was rotated such that the sample pads were protected from contamination while the crawler moved. Each sampling block could collect two samples, minimizing trips into and out of the canister overpack. Samples were collected at several circumferential locations, from the top centerline of the canister down the sides to locations just above the rails upon which the canisters rested. Each sample consisted of the Scotch-brite pads and the glass fiber filter that was sandwiched between them ().
Using an adhesive strip, a dry dust sample was collected from the outer surface of each sample block for scanning electron microscopy (SEM) and energy dispersive X-ray spectroscopy (EDS) analyses. Once the pad/filter samples were extracted from the sample blocks, the samples and the blocks were leached to extract the soluble salts for analysis. The focus is only on the dust morphology analysis/characterization rather than compositional analysis; the compositional data are discussed in Katona et al.[Citation9] SEM/EDS analyses of the dry dust samples were carried out to provide morphological and mineralogical information for the insoluble phases and soluble salts in the dust. The SEM/EDS analyses also allowed for visual identification of organic matter (floral/faunal fragments). For this work, two different SEMs were used, a Tescan Vega III SEM and a Zeiss Gemini SEM 500 equipped with a Bruker XFlash 6 × 60 SDD EDS.
The particle size distributions for the dust samples collected from in-service canisters at the ISFSI sites were determined by SEM and image analyses. The Feret diameter was evaluated for each particle using ImageJ software. Attempts were made to analyze as many particles as possible for each image, with 8 to 12 SEM images analyzed per ISFSI site.
II.B. Material
Austenitic stainless steel 304 (SS304) coupons, 2 × 1 in., were used in this study (compositions in weight percent: 0.045 C, 18.48 Cr, <0.01 Cu, 0.83 Mn, 71.96 Fe, 0.018 Mo, 0.055 N, 8.18 Ni, 0.027 P, 0.002 S, and 0.4 Si).[Citation10] The SS304 coupons were prepared to a #8 machined finish (equivalent of a mirror finish) by Polished Metals Ltd, Incorporated (Hillside, New Jersey). The #8 finish was achieved by mechanically grinding on a series of abrasive belts, up to 1200 grit, followed by mirror finishing on compound and buffing wheels, which resulted in an average surface roughness of 4 to 8 μm. All specimens were degreased and cleaned prior to salt printing following a previously developed procedure[Citation10–12] consisting of ultrasonication in acetone (3 min), ethanol rinse, ultrasonication in Liquinox® detergent (3 min), ultrasonication in deionized water (3 min), ethanol rinse, and finally, drying with compressed nitrogen.
II.C. Salt Loading and Dust Deposition
A LogoJet Pro H4-2400 industrial inkjet printer was used to print American Society for Testing and Materials (ASTM) seawater[Citation13] onto the SS304 coupons with a salt-loading density of 300 µg/cm2 (3 g/m2) at a relative humidity (RH) of 80% and temperature of 21°C.[Citation11,Citation12,Citation14] By utilizing an inkjet printer, uniform fields of pico-liter-sized droplets (diameters ranging between 2 to 133 µm) with a given salt load density were produced over the entire surface of the coupons, representing droplet volumes produced from atmospheric sea salt aerosols.[Citation15] Following salt printing, each sample was immediately placed in a nitrogen-purged dry box until all samples were printed with salt.
Initial dust deposition tests were performed by depositing quartz dust onto SS304 coupons pre-deposited with 300 μg/cm2 of artificial seawater (ASW). MIN-U-SIL® 10 (with a median particle diameter of 3.4 μm), a well-sorted, high-purity crushed quartz, was selected as an analog for the small-size fraction of detrital grains on the canister surfaces. While this may be slightly larger than the small particle mean, smaller dust would make laboratory deposition extremely difficult/hazardous; therefore, 5 µm was selected for ease of deposition.
SIL-CO-SIL® 75 (~75-µm) quartz dust was also selected for testing, representing larger detrital grain sizes. However, this product has a large distribution of particle sizes. Therefore, prior to dust deposition, the SIL-CO-SIL 75 was size fractionated using a column settling procedure based on Stokes Law, shown in EquationEq. (1)(1)
(1) :
where
| = | settling velocity | |
| = | difference in density between the particles and the liquid | |
| = | viscosity of the liquid | |
| = | particle diameter | |
| = | force of gravity. |
Using a graduated cylinder filled with 1 L of deionized water, 20 to 30 g of the SIL-CO-SIL 75 was added and the column was inverted several times to suspend the solids. Then the suspended dust was allowed to settle for 1.5 to 2 h. The supernatant (containing small dust particles) was discarded, and the solids at the bottom of the cylinder were dried in an oven at 60°C. The small dust particulate, MIN-U-SIL 10, did not require a settling procedure.
The dust was deposited using a TOPAS SAG 410, with the RH of the deposition chamber held at ~45% to 50% during deposition. At this RH, the MgCl2 in the deposited ASW[Citation13] was deliquesced (but not the NaCl), such that the surface of the SS304 coupons was slightly wetted at the time of dust deposition. This enabled adherence of the dust particles to the SS304 coupon surface and reduced potential static issues. The surface was not fully wetted to avoid redistribution or pooling of the salts into larger droplets/deposits. Following injection of the dust, the humidity generation ceased (allowing slow equilibration to the ambient RH), and the dust was allowed to settle out of the air for several hours. The coupons were weighed pre and post dust deposition to determine the deposited dust load. Approximately 300 μg/cm2 of dust was deposited on each coupon, for a total dust and salt density of 600 μg/cm2.
II.D. Exposures
The SS304 coupons, deposited with ~300 µg/cm2 of sea salt and ~300 µg/cm2 of inert dust, were exposed at three different atmospheric conditions of temperature and RH to evaluate the role of dust on corrosion morphology and severity. The exposure conditions included (1) a static atmospheric condition of 75% RH and 50°C (NaCl-rich deliquescent brine) for up to 24 months, (2) a static atmospheric condition at 40% RH and 50°C (MgCl2-rich brine) for up to 24 months, and (3) cyclic conditions that mimic potential diurnal cycles present on the surface of heated SNF canisters.[Citation9,Citation10] Note, the static exposures occurred at 50°C and fixed RH, whereas the diurnal cyclic conditions spanned ~32°C to 44°C and a RH range of 28% to 50%, with an average close to the 40% RH of the fixed condition.
Full-cycle development has been previously described in Katona et al.[Citation9] and Montoya et al.[Citation10] Exposures are being carried out for times ranging from 1 month up to 2 years; at the time of writing this paper, samples for up to 12 months of exposure for the 75-µm co-deposited coupons and up to 6 months of exposure for the 5-µm co-deposited coupons have been completed, with periodic coupon removal and characterization to determine the influence of dust on the subsequent corrosion attack. Additionally, coupons deposited with only 300 µg/cm2 of sea salt are being exposed for comparison to a no-dust condition for all environments. A summary of the environments, coupons, and status of exposure is provided in .
TABLE I Atmospheric Exposure Conditions for Dust Deposition Coupons
II.E. Post-Exposure Corrosion Analysis
Following exposure, the samples were rinsed with deionized water and stored in nitrogen backfilled desiccators prior to analysis. Initial images were acquired with corrosion product and residual salts on the sample surfaces through optical microscopy, SEM, and EDS, as detailed in the following. The samples were then cleaned following the ASTM G-1 procedure as applied in previous studies[Citation10] and re-imaged through SEM (again detailed in the following sections) to determine the morphology, size, and extent of the corrosion attack. Additionally, a set of optical and SEM images were collected pre exposure to examine salt and dust deposition density and morphology.
II.E.1. Optical Microscopy
Optical images were collected post exposure, prior to removal of the corrosion product, on a Keyence VHX-5000 Digital Microscope for all samples exposed. For optical microscopy, images were taken at three select magnifications: 20×, 100×, and 500×.
II.E.2. Scanning Electron Microscopy
Post-exposure images, both prior to and after corrosion product removal, were acquired using a Tescan Vega 3 scanning electron microscope at 10-kV accelerating voltage with secondary (SE) and backscatter (BSE) detection modes. The microscope was utilized to image salt and corrosion product distributions on the surface of the coupons, providing an indication of potential brine spreading. Additionally, EDS data were collected (at 20 kV) to determine the salt distribution and the composition of the corrosion products. Once the coupons were cleaned, the resultant corrosion damage was imaged again using the SE and BSE modes of the scanning electron microscope. Micrographs were collected randomly across the sample surfaces due to the large number of features that were visible during SEM examination. Representative images of each exposure type, including material, dust deposition, and time of exposure, are presented herein.
III. RESULTS
III.A. Dust–Sea Salt Morphology
III.A.1. Characterization of Inert Dust Particles on Dry Storage Canister Surfaces
The SEM images were used to evaluate the particle size distribution of the dust collected from the canister surfaces at the examined ISFSI sites. Particle size distributions for the exemplar sites A and B are provided in in red (darker) and are compared with data from other ISFSI sites in gray. The particle diameters for sites A and B peak at slightly larger particle diameters in comparison to the other sampled sites.
Fig. 2. Probability versus particle diameter (as measured from ImageJ analysis assuming a Feret diameter). The red (darker triangles and circles) lines represent the two exemplar sites discussed herein, and gray represents all the other ISFSI sites measured to date. The dashed and dotted lines indicate 5- and 75-μm sizes for comparison to dust used in laboratory exposures.
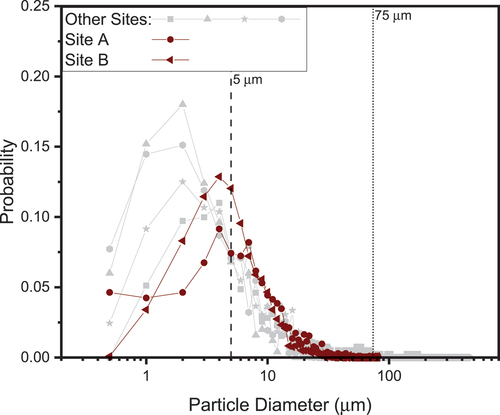
It should be noted that the sampling methods used at sites A and B were likely more effective than the previous sampling methods (as detailed in Katona et al.).[Citation10] Overall, the median and mean particle diameter for sites A and B, respectively, are a 7.66-μm median with a mean of 9.66 μm and a 6.22-μm median with a mean of 7.91 μm. For all sites, the peak in particle distribution fell within 2 to 10 μm, with a tail of larger particles extending to roughly 100 to 150 μm. Two dust sizes were selected to represent inert particles based on these measurements: 5 μm for the peak distribution and 75 μm to represent particles on the larger end.
III.A.2. Exemplar SEM/EDS Characterization of Soluble and Insoluble Dust on Dry Storage Canister Surfaces
The EDS observations of site A indicated that dust was dominated by quartz (SiO2) and dolomite [CaMg(CO3)2], with lesser amounts of potassium feldspar (KAlSi3O8), calcite (CaCO3), and calcium sulfate [gypsum (CaSO4:2H2O) or anhydrite (CaSO4)], and iron oxides (potentially from welding spatter). Minor or trace amounts of other silicates and sulfates were also present. The salt aerosols at site A were mostly calcium sulfate, but trace amounts of sodium sulfate as very fine particles were also present. In addition to sulfates and carbonates, other soluble salt phases were observed in small amounts. Chloride was sparse, but when identified, occurred as relatively large particles of halite. In a few cases, chloride was associated with Mg and K, but due to the prevalence of Mg- and K-rich minerals, the definitive identification of chloride phases other than NaCl was not possible. The example SEM image and the corresponding EDS element maps in show some chloride salts and capture the characteristics (composition/particle sizes) of the dust in general.
Fig. 3. SEM BSE images and EDS element maps of site A dust. Particles are largely carbonates and aluminosilicates. A single large grain of NaCl with a rim of soda niter (NaNO3) is prominent (reproduced from the site A report).[Citation6]
![Fig. 3. SEM BSE images and EDS element maps of site A dust. Particles are largely carbonates and aluminosilicates. A single large grain of NaCl with a rim of soda niter (NaNO3) is prominent (reproduced from the site A report).[Citation6]](/cms/asset/74493bb0-2c13-4f4a-b1fe-8c2c02ad2ff5/unct_a_2291605_f0003_oc.jpg)
At site B, the dust was dominantly quartz and aluminosilicates (feldspars and mica). Iron and aluminum oxides/hydroxides were also relatively common. Detrital calcite was common, and dolomite was rare at this site. For soluble salts, sulfate minerals were very common. Calcium sulfate was the most abundant, but sulfate was also present as phases that are common components in fertilizers, such as potassium sulfate (potash of sulfur) and an organo-sulfate phase. Sodium sulfate was also observed and may have originated via atmospheric reactions with NaCl.
In addition to sulfates and carbonates, other soluble salt phases were observed in small amounts. Chloride was commonly present as halite, but on one occasion, was present as sylvite (KCl, a common component of fertilizers). Phosphate occurred as discrete detrital mineral grains, commonly associated with Ca2+ (as apatite). Phosphate was also present in forms likely associated with fertilizers, such as aggregates containing K and SO4, possibly as ammonium phosphate or organic phosphate compounds. The dust also contained a significant amount of organic matter. This material was mostly plant matter, such as pollen and stellate trichomes (plant fibers produced by oak trees), other plant fibers, and possibly insect parts. The SEM image and the EDS element maps of dust from site B are shown in .
Fig. 4. SEM/EDS map of the dust particulates from site B dust showing a large halite grain and spherical Al-Si oxide particle (noted by the arrow), which is likely fly ash from nearby industrial combustion processes (reproduced from the site B report).[Citation7]
![Fig. 4. SEM/EDS map of the dust particulates from site B dust showing a large halite grain and spherical Al-Si oxide particle (noted by the arrow), which is likely fly ash from nearby industrial combustion processes (reproduced from the site B report).[Citation7]](/cms/asset/a4357ea2-d586-4305-b17f-447c3bee93cb/unct_a_2291605_f0004_oc.jpg)
Representative SEM images of dust collected from sites A and B, and a third site C that is not discussed here, are shown in . The images show examples of common dust morphologies and particle sizes, as well as organic matter, such as stellate trichomes (), fly ash (spherical particle in ), and pollen ( and and small oblong grains in ).
Fig. 5. Representative SEM images of dust from (a) and (d) sites A, (b) and (c) site B, and (c) and (f) site C (reproduced from the dust analysis reports).[Citation6–8]
![Fig. 5. Representative SEM images of dust from (a) and (d) sites A, (b) and (c) site B, and (c) and (f) site C (reproduced from the dust analysis reports).[Citation6–8]](/cms/asset/c5a9dd3d-b83c-4315-aa3c-60fbf925cfef/unct_a_2291605_f0005_b.gif)
III.A.3. Pre-Exposure Laboratory Salt and Dust Co-Deposition
Representative SEM and EDS images are shown in and of the dust alone, deposited on Si coupons for characterization purposes. shows the effect of the dust settling procedure applied to the SIL-CO-SIL 75 dust. Prior to the settling procedure, the initial dust had a large range of particle sizes with many fine particulates (). Following the settling procedure, the particle size distribution was much narrower, with far fewer fine particles (). Following deposition using the TOPAS system (), the particle distribution was reduced, and primarily larger particles remained. A similar settling procedure was not applied to the MIN-U-SIL 10 dust, as the particulate distribution and dust particle sizes were relatively close to the desired dust size, as can be seen in .
Fig. 6. SEM images of SIL-CO-SIL 75 dust (a) as received, (b) post settling procedure, and (c) post deposition using the TOPAS system.[Citation16]
![Fig. 6. SEM images of SIL-CO-SIL 75 dust (a) as received, (b) post settling procedure, and (c) post deposition using the TOPAS system.[Citation16]](/cms/asset/b8ccb790-f68d-4350-a2b1-6dec5d0bc62b/unct_a_2291605_f0006_b.gif)
Fig. 7. SEM images of the MIN-U-SIL 10 quartz dust.[Citation16]
![Fig. 7. SEM images of the MIN-U-SIL 10 quartz dust.[Citation16]](/cms/asset/85a99124-37cf-4e4f-b430-e09900898a07/unct_a_2291605_f0007_b.gif)
A SEM image of a SS coupon and corresponding EDS element maps of co-deposited dust (300 μg/cm2 SIL-CO-SIL 75 dust) and seawater (300 μg/cm2) are shown in . The Si elemental map, representing the quartz dust, is shown in pink, which appears randomly distributed across the coupon surface and is not segregated around the sea salt. Additionally, large NaCl crystals (green and blue) are aproned by other Mg-, K-, and sulfate-rich seawater evaporite minerals.
Fig. 8. SEM/EDS analysis of 300 μg/cm2 SIL-CO-SIL 75 dust deposited on a coupon previously coated with 300 μg/cm2 of sea salt.[Citation16]
![Fig. 8. SEM/EDS analysis of 300 μg/cm2 SIL-CO-SIL 75 dust deposited on a coupon previously coated with 300 μg/cm2 of sea salt.[Citation16]](/cms/asset/c7e7ea83-9637-4333-8b40-77e18042426c/unct_a_2291605_f0008_oc.jpg)
III.B. Post-Exposure Corrosion Damage Imaging
III.B.1. Optical Images Post-Atmospheric Exposure
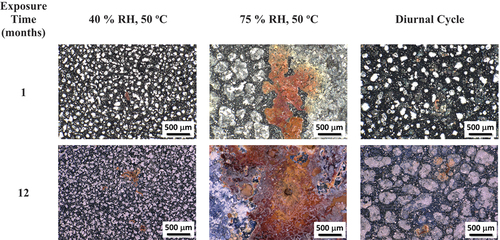
Representative post-atmospheric exposure optical images (prior to cleaning and corrosion product removal) of coupons co-deposited with 300 μg/cm2 of sea salt and 300 μg/cm2 of SIL-CO-SIL 75 dust are shown in . Images are shown for the three different exposure conditions: (1) static 40% RH at 50°C, (2) static 75% RH at 50°C, and (3) the diurnal cyclic condition, all at 1- and 12-month exposure times. Visually, corrosion increases with time of exposure, as indicated by an increase in corrosion products. For the low-RH and cyclic conditions, small rust spots, with “worm-like” corrosion can be observed. For the high-RH exposure, larger rust spots, which increase in size with exposure time, appear on the coupon’s surfaces. Additionally, the salt appears to have spread or shifted during exposure, likely due to the increased amount of brine, possibly combined with the presence of dust at the higher RH.
Fig. 9. Representative optical images post 1- and 12-month corrosion exposure for samples co-deposited with 300 μg/cm2 of sea salt and 300 μg/cm2 of SIL-CO-SIL 75 dust (100× magnification).
III.B.2. SEM Micrographs Post-Atmospheric Exposure
III.B.2.a. Assessment of Corrosion Product
Representative, post-atmospheric exposure for 1-month SEM images (prior to cleaning and corrosion product removal) of coupons co-deposited with 300 μg/cm2 of sea salt and 300 μg/cm2 of SIL-CO-SIL 75 dust (~75-μm particles), 300 μg/cm2 of sea salt and 300 μg/cm2 of MIN-U-SIL 10 dust (3.4-μm median diameter), and only 300 μg/cm2 of sea salt are shown in . Images are shown for the three different exposure conditions for each surface coverage. After 1 month of exposure, both dusted conditions under the static, high-RH exposure display evidence of spreading (droplet outlines shown with white arrows) across the surface, whereas the no-dust condition does not. For both the low static RH and diurnal cycles, while spreading may have occurred under the co-deposited dust and ASW conditions, the surfaces were not significantly different from those observed in the no-dust condition.
Fig. 10. Post-exposure exemplar SEM images prior to removal of corrosion products and residual salts and dust for all exposure types and dust depositions and 1-month exposure.
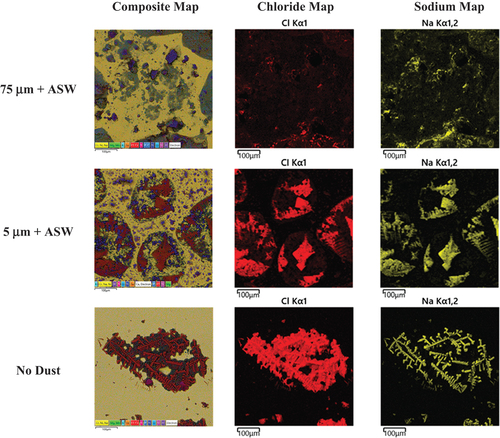
Energy dispersive X-ray spectroscopy maps taken at each exposure condition after 1 month of exposure to further explore the potential spreading/distribution of salts and corrosion products across the coupon surfaces for the static high-RH condition are presented in . These are consistent with the SEM images, in that spreading is observed in the high static RH with the large, 75-μm dust particulates. For the small dust particulates, some potential spreading is observed; however, in the exposure with no co-deposition of dust, no salt spreading nor corrosion product formation is observed.
Fig. 11. Post-exposure exemplar EDS maps prior to removal of corrosion products and residual salts and dust for 300 μg/cm2 of sea salt and 300 μg/cm2 of SIL-CO-SIL 75 dust with composite, Cl, and Na maps shown.
Scanning electron microscopy imaging was carried out over the exposure time for the 300 μg/cm2 sea salt and 300 μg/cm2 SIL-CO-SIL 75 dust coupons, with representative images shown in . Each SEM image only represents a singular area of damage; however, they were selected as each displays the most common/dominant corrosion morphologies observed across each deposition and exposure condition. For all exposure conditions, as time increased from 1 to 12 months, the corrosion damage across the surface visually increased for the static conditions. Minimal increases in corrosion damage were observed for the cyclic exposure conditions. Large increases in corrosion products were seen for the static conditions, with a substantial corrosion product observed initially on the 75% RH static condition and increasing over time. For the 40% RH static conditions, corrosion products increased with time, with worm-like corrosion products (light gray) appearing to increase in length over time. It is important to note that the two static exposure conditions were carried out at 50°C, whereas the diurnal cyclic conditions, chosen to be representative of canister surface conditions, ranged from ~32°C to 44°C.
Fig. 12. Post-exposure SEM images prior to removal of corrosion products and residual salts and dust for 300 μg/cm2 of sea salt and 300 μg/cm2 of SIL-CO-SIL 75 dust at three exposure times: 1, 6, and 12 months.
III.B.2.b. Assessment of Underlying Corrosion Damage
After initial SEM analysis of the corrosion products, the ASTM G-1 cleaning procedure was applied to remove both residual salts and corrosion products on the coupon surfaces. SEM images were again collected to gain information on the underlying corrosion damage. Representative images for all conditions and all dust depositions after 1 month of exposure are presented in . For all coupons exposed without the co-deposition of dust (seawater only) in all conditions, pitting and corrosion damage appeared smaller in size, with pits typically less than ~5 μm in diameter. Some crevice corrosion was observed on samples exposed with no dust in the static low-RH condition, but pits remained small. In the presence of dust, either 5 or 75 μm, in general larger pits were observed. A significant increase in pit size at 75% RH with the 75-μm dust particles was observed (), with pits as large as approximately 150 μm in diameter (note the difference in the scale bar).
Fig. 13. Post-exposure exemplar SEM images post removal of corrosion products and residual salts and dust. Images display corrosion damage. Note the difference in scale of the 75% RH, 50°C ASW + 75-μm sample.
Representative SEM images as a function of exposure time for the 300 μg/cm2 sea salt and 300 μg/cm2 SIL-CO-SIL 75 dust coupons, after corrosion product and residual salt removal, are shown in . For all exposure conditions, as time increased from 1 to 12 months, the corrosion damage across the surface visually increased. At the low, 40% static RH condition, filiform-like corrosion was present and appeared to increase in size for exposures up to 12 months, with a damage length reaching roughly 600 μm. For the static 75% RH exposures, large pits continued to be observed over time, and increased in both diameter and number. Finally, under cyclic conditions, there were not large differences in the resultant corrosion damage observed with and without the presence of dust or with increased exposure time.
Fig. 14. Post-exposure exemplar SEM images post removal of corrosion products and residual salts and dust for 300 μg/cm2 of sea salt and 300 μg/cm2 of SIL-CO-SIL 75 dust at three exposure times: 1, 6, and 12 months.
IV. DISCUSSION
From the initial atmospheric exposures of the SS304 coupons with co-deposited dust and seawater compared to only seawater, it is evident that the exposure environment, presence of dust, and exposure time all play significant roles in the resultant corrosion damage and pitting morphologies. Potential influences of brine spreading in the presence of dust may be due to multiple variables. The exposure conditions (temperature, RH, and subsequently, brine composition) control the water layer thickness. At higher RH, with more brine present, the interaction with the dust particulates may increase, and in the presence of dust, can lead to spreading due to capillary processes.[Citation17] However, further research is necessary to determine the extent of these influences, including particulate size, density, etc., as well as the environmental interactions.
While influences were observed on brine morphology with the presence of dust and some indication of brine spreading was observed, it is unclear from these exposures how the ratio of dust to salt, the distribution of the dust across a surface, the size of the dust, etc., may also play a role in the surface wetting, drying, and/or brine morphology. Additionally, as dust can act as a crevice former, creating potential occluded sites, this may also influence the corrosion severity of a given environment. As only two dust sizes were explored, the understanding of dust size influence on crevice formation is limited. The influences of inert dust on brine layer thickness, distribution/morphology, and composition, all in turn appear to affect the resultant corrosion damage.
For the exposure time period, observations found that the corrosion products and underlying damage appeared to increase in size and density over time when dust was co-deposited with salt and exposed under the static RH conditions. However, no significant changes or increases in corrosion damage were observed under the cyclic conditions as compared to the coupons with only seawater present. This may be a function of the lower temperature of the cyclic exposures (32°C to 44°C).
While outside the scope of this paper, continued analysis is ongoing for longer-term exposures (currently underway), including further comparison of the 5-μm co-deposited and no-dust coupons.
IV.A. Limitations and Implications
While initial observations of corrosion damage indicate there may be influences of inert dust on resultant pitting or localized corrosion, there are some limitations to these results. First, these are only qualitative observations of a limited numbers of SEM images. While the images presented herein are representative of the general corrosion trends observed, quantitative analysis would provide further support for interpretation of the corrosion damage. Additionally, full comparison of the co-deposited dust and seawater corrosion exposures to no-dust coupons (seawater only) is necessary to understand any influences of purely dust, rather than potential differences due to changes in temperature or exposure conditions. While the current interpretations are limited, full analysis will be carried out in the future as exposures are completed. (At the time of this paper, the no-dust and 5-μm co-deposited coupons have only been fully analyzed for 1-month exposures.)
However, while there are limitations to the current data set, there are some significant conclusions that can be drawn. The morphologies of pits observed in conditions with co-deposition of dust, in general, were larger and exhibited mixed modes of corrosion that were not observed in the no-dust conditions (i.e., crevicing, filiform, and pits within pits). While it is not fully understood if pit size, morphology, or other features control the pit-to-crack transition, it is recognized that pits can act as stress/strain concentrators and initiation sites for cracks.[Citation18] Others have also observed that atmospheric corrosion is a complex process, resulting in corrosion damage that is not solely a hemispherical pit morphology, but rather is dependent on the interaction of many environmental and material properties.[Citation19] Additionally, pits are not the only feature that may induce SCC, as observations have shown the development of SCC from crevicing sites under immersed conditions.[Citation20]
Understanding the governing factors for corrosion damage susceptibility, the resultant morphologies, and their propensity toward transitioning to a crack is key to determining the overall susceptibility of stainless steel to SCC in a given environment. Additionally, while the literature has placed an emphasis on the role of soluble salts on subsequent atmospheric corrosion damage, a better understanding of inert particulates and the subsequent influences they may have on corrosion susceptibility cannot be ignored. Developing an improved understanding of the potential risk of canister SCC, especially under relevant atmospheric exposure conditions, will enable overall enhanced lifetime predictions of SNF dry storage canisters.
V. CONCLUSIONS
Atmospheric exposure conditions relevant to SNF canister storage were developed based on anticipated canister temperature and RH conditions and from in-service dust measurements from SNF dry storage canisters. The influences of inert dust on corrosion susceptibility were evaluated on austenitic stainless steel coupons after exposure to three different atmospheric environments and surface depositions. Initial observations of the co-deposited samples versus solely seawater samples displayed the potential influences of inert dust on corrosion susceptibility. SEM and EDS observations indicated probable brine spreading, especially with the presence of large inert dust particles. Subsequent observations of pitting damage and morphologies displayed the dependence of both the pit size and morphology on the exposure conditions, as well as the size and presence of the inert dust.
As these exposures are still in progress, further analysis is necessary to determine the relative influence of various parameters (dust size, deposition density, corrosion mechanisms), as well as the interaction of these environments with material properties, including, surface finish, residual stresses, and materials composition.
Acknowledgments
This paper was authored by an employee of National Technology & Engineering Solutions of Sandia, LLC under contract no. DE-NA0003525 with the U.S. Department of Energy (DOE). The employee owns all rights, title, and interest in and to the paper and is solely responsible for its contents.
The U.S. government retains and the publisher, by accepting this paper for publication, acknowledges that the U.S. government retains a nonexclusive, paid-up, irrevocable, worldwide license to publish or reproduce the published form of this paper, or allow others to do so, for U.S. government purposes. The DOE will provide public access to the results of federally sponsored research in accordance with the DOE Public Access Plan https://www.energy.gov/downloads/doe-public-access-plan.
The views expressed in the article do not necessarily represent the views of the U.S. Department of Energy or the United States Government.
Disclosure Statement
No potential conflict of interest was reported by the authors.
Additional information
Funding
References
- B. HANSON et al., “Gap Analysis to Support Extended Storage of Used Nuclear Fuel,” FCRD-USED-2011-000136 Rev. 0, Pacific Northwest National Laboratory (2012).
- A. J. M. C. COOK, C. PADOVANI, and A. J. DAVENPORT, “Effect of Nitrate and Sulfate on Atmospheric Corrosion of 304L and 316L Stainless Steels,” J. Electrochem. Soc., 164, 4, C148 (2017); https://doi.org/10.1149/2.0921704jes.
- C.-P. YEH, K.-C. TSAI, and J.-Y. HUANG, “The Effect of Deposited Dust on SCC and Crevice Corrosion of AISI 304L Stainless Steel in Saline Environment,” Materials, 14, 22, 6834 (2021); https://doi.org/10.3390/ma14226834.
- H. LIANG, R. F. SCHALLER, and E. ASSELIN, “Three Phase Corrosion of Pipeline Steel: Size Effects of Deposited Solids Under Water Droplets and an Oil Diffusion Barrier,” JPSE, 1, 1, 137 (2021); https://doi.org/10.1016/j.jpse.2021.01.006.
- S. IBRAHIM et al., “Water Interaction with Mineral Dust Aerosol: Particle Size and Hygroscopic Properties of Dust,” ACS Earth Space Chem., 2, 4, 376 (2018); https://doi.org/10.1021/acsearthspacechem.7b00152.
- C. R. BRYAN and A. W. KNIGHT, “Analysis of Dust Samples Collected from an Inland ISFSI Site (Site A),” Sandia National Laboratories (2020).
- A. W. KNIGHT and C. R. BRYAN, “Analysis of Dust Samples Collected from an Inland ISFSI Site (‘Site B’),” Sandia National Laboratories (2020).
- C. BRYAN, A. KNIGHT, and M. MAGUIRE, “Analysis of Dust Samples Collected from a Near-Marine East Coast ISFSI Site (Site C),” Sandia National Laboratories (2022).
- R. M. KATONA et al., “Considerations for Realistic Atmospheric Environments: An Application to Corrosion Testing,” Sci. Total Environ., 885, 163751 (2023); https://doi.org/10.1016/j.scitotenv.2023.1613751.
- T. MONTOYA et al., “Influence of Realistic, Cyclic Atmospheric Cycles on the Pitting Corrosion of Austenitic Stainless Steels,” J. Electrochem. Soc., 170, 4, 041502 (2023); https://doi.org/10.1149/1945-7111/acc42e.
- J. SRINIVASAN et al., “Long-Term Effects of Humidity on Stainless Steel Pitting in Sea Salt Exposures,” J. Electrochem. Soc., 168, 2, 021501 (2021); https://doi.org/10.1149/1945-7111/abdc75.
- T. D. WEIRICH et al., “Humidity Effects on Pitting of Ground Stainless Steel Exposed to Sea Salt Particles,” J. Electrochem. Soc., 166, 11, C3477 (2019); https://doi.org/10.1149/2.0551911jes.
- ASTM standard for Standard Practice for the Preparation of Substitute Ocean Water, Designation: D 1141-98, (Reapproved 2003), ASTM International, United States.
- E. SCHINDELHOLZ and R. G. KELLY, “Application of Inkjet Printing for Depositing Salt Prior to Atmospheric Corrosion Testing,” Electrochem. Solid-State Lett., 13, 10, C29 (2010); https://doi.org/10.1149/1.3473724.
- C. LEYGRAF et al., Atmospheric Corrosion, John Wiley & Sons (2016).
- C. BRYAN et al., “SNF Interim Storage Canister Corrosion and Surface Environment Investigations (FY21 Status Report),” Sandia National Laboratories (2021).
- C. BRYAN et al., “SNF Interim Storage Canister Corrosion and Surface Environment Investigations (FY23 Status Report),” Sandia National Laboratories (2023).
- R. M. KATONA, E. K. KARASZ, and R. F. SCHALLER, “A Review of the Governing Factors in Pit to Crack Transitions in Metallic Structures,” Corrosion, 79, 1, 72 (2023).
- C. ÖRNEK, “Stress Corrosion Cracking and Hydrogen Embrittlement of Type 316L Austenitic Stainless Steel Beneath MgCl2 and MgCl2: FeCl3 Droplets,” Corrosion, 75, 6, 657 (2019); https://doi.org/10.5006/3090.
- S. TSUJIKAWA, “Initiation of Cl- SCC Cracks from Crevices Rather than from Pits,” Chemistry and Electrochemistry of Corrosion and Stress Corrosion Cracking: A Symposium Honoring the Contributions of R. W. Staehle as held at the 2001 TMS Annual Meeting, p. 339.