
 ?Mathematical formulae have been encoded as MathML and are displayed in this HTML version using MathJax in order to improve their display. Uncheck the box to turn MathJax off. This feature requires Javascript. Click on a formula to zoom.
Abstract
The CASL reactor simulation package VERA has been adapted to provide high-fidelity simulation capabilities for modeling source range detector response during subcritical reactor configurations. New features include the activation and shuffling of secondary-source assemblies, use of burned fuel neutron emission data from the ORIGEN depletion solver to the MPACT deterministic neutron transport solver, allowance of user-defined sources in MPACT based on material composition, ability to solve the subcritical source-driven system with neutron multiplication using the MPACT diffusion solver, and transfer of the calculated fission source from MPACT to the continuous-energy Monte Carlo solver Shift for final detector response evaluation using the CADIS methodology for variance reduction. These new capabilities were benchmarked against Watts Bar Unit 1 plant operating data for the first few fuel loading steps and were found to demonstrate excellent agreement with the measured data.
I. INTRODUCTION
All commercially operated pressurized water reactors (PWRs) rely on the use of ex-core detectors for continuous monitoring of core reactivity during reactor shutdown, reload, and restart activities. This continuous monitoring ensures that inadvertent reactivity insertions, whether by fuel misloading, unintentional control rod withdrawal, or accidental reactor coolant system boron dilution, are immediately detected and mitigated with appropriate operator action.
In the Tennessee Valley Authority (TVA) Watts Bar Nuclear plant (WBN), as well as similar PWR designs, source range detectors (SRDs) are used to obtain ex-core neutron response measurements from the loading of the first fuel assembly into the reactor up to shortly beyond criticality achievement but before power ascension.Citation1,Citation2 SRDs produce their electrical signals from neutron interactions and must be provided a sufficiently strong neutron source from the reactor to measure core reactivity. The signal can be provided by using spontaneous neutron emissions from burned fuel and/or neutron-emitting nonfuel inserts to induce subcritical neutron multiplication in the fuel. Proper use of fuel and neutron-emitting inserts is crucial to ensuring sufficient detector signal strength and enabling the SRDs to respond accurately to changes in core flux levels and avoid poor placement resulting in delayed operator detection of adverse conditions.Citation3–7
The ability to accurately predict SRD response would allow utilities to better identify and mitigate adverse core designs that may increase the risk of the SRD response falling below the technical specification–required SRD minimum count rates during core reload or exhibiting a nonlinear inverse count rate ratio (ICRR), as was observed at the Surry nuclear power station.Citation5 Furthermore, accurate predictions may better inform current core design decisions made to ensure adequate SRD response behavior, allowing said decisions to be altered so as to decrease nuclear fuel costs or eliminate the need for neutron-emitting nonfuel inserts.
Given the benefits that might be achieved with more accurate SRD response simulations, the Consortium for Advanced Simulation of Light Water Reactors (CASL) has developed a SRD response modeling capability within its high-fidelity Virtual Environment for Reactor Analysis (VERA) framework.Citation8 The uniqueness of this capability, from an ex-core radiation transport perspective, is both the detailed characterization of the time-dependent source term in the reactor core and the state-of-the-art hybrid transport techniques for variance reduction. VERA already provides one of the most advanced reactor core simulation capabilities in the world, producing very detailed isotopic distributions in the fuel and a three-dimensional (3-D) pin-wise 51-group neutron flux distribution. This detailed flux distribution serves as the source term for advanced ex-core radiation transport application.
This paper describes the ex-core detector response capability implemented in VERA and the validation of the capability against measurements taken during several refueling cycles of WBN Unit 1 (WBN1). It is organized to first provide a brief overview of the relevant design characteristics of WBN1 in Sec. II, followed by a detailed description of the VERA features used for SRD modeling in Sec. III, a description of the specific model used to validate the SRD modeling capability in Sec. IV, comparisons to plant operating data in Sec. V, and finally concluding remarks in Sec. VI.
II. BACKGROUND
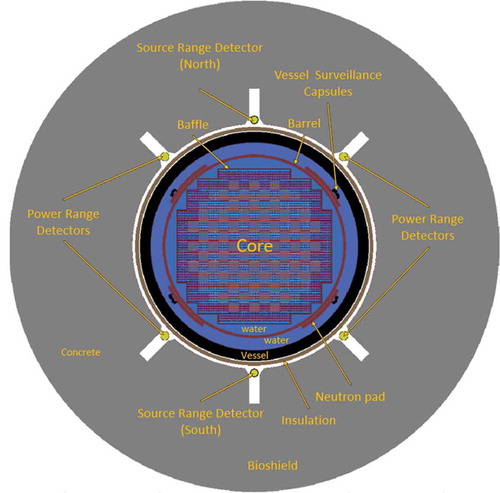
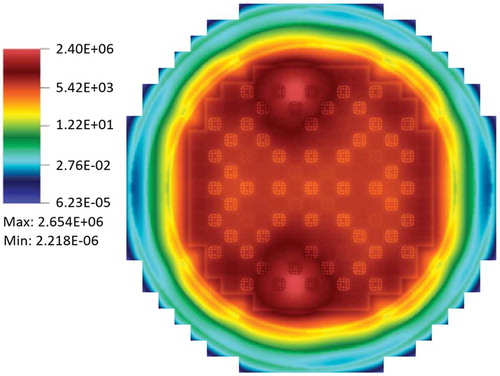
The Watts Bar Nuclear plant consists of two Westinghouse four-loop ice condenser PWR units with primary design characteristics well documented in CASL technical reports.Citation9,Citation10 The SRDs for WBN are physically located on the north and south sides of the reactor core, outside the reactor vessel, and nearly adjacent to the concrete bioshield, as shown in . These locations provide the most sensitivity to changes in neutron flux levels at very low power levels. The SRDs are centered axially with the active fuel region of the core.
Fig. 1. Radial layout of WBN detailed ex-core model with SRD locations
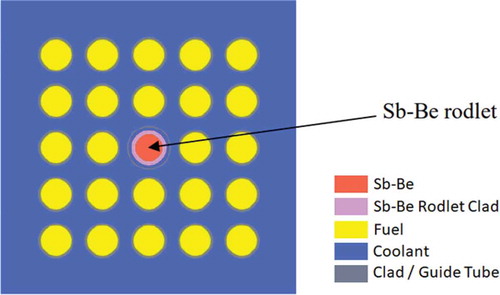
To ensure sufficient counts are available during startups, and to enable the SRDs to respond more accurately to changes in flux levels in the core, WBN employs secondary-source assemblies (SSAs) as an additional neutron source (in addition to neutrons emitted by depleted fuel). An SSA at WBN is an insert assembly consisting of six rodlets inserted into a fuel assembly via the guide tubes, with each rodlet containing antimony-beryllium (Sb-Be) material that acts as an intermediate-energy neutron emitter once fully charged. The emitting region is 88 in. tall and is axially located near the bottom of the fuel stack. A diagram of an SSA can be found in CitationRef. 1. A typical reload core contains two active SSAs, one for each SRD.
The Sb-Be material, which consists of the natural isotopic abundances of 121Sb, 123Sb, and 9Be, is a binary neutron source based on two reactions to produce neutrons. The first reaction is neutron absorption in 123Sb, which produces radioactive 124Sb that has a half-life of 60.2 days and decays by beta and gamma emission. The second reaction is a photonuclear reaction in 9Be, in which the gamma released by the decay of 124Sb is absorbed and produces a neutron via the following reaction:
It should be noted that though 121Sb also becomes activated during irradiation, the 9Be photoneutron production energy threshold is generally higher than the gamma emissions resulting from 122Sb decay. As such, the 121Sb activation and subsequent decay do not significantly contribute to the overall photoneutron production of 9Be.
The Sb-Be source acts as a mechanism for capturing neutrons during plant operation and releasing others later during refueling and startup. The 60.2-day half-life of 124Sb makes it an ideal gamma source for supporting the typical reactor refueling outage length of approximately 30 days. Because the 9Be neutron source is directly proportional to the gamma source from 124Sb (see Sec. IV.A), the strength of the SSAs essentially decays during the refueling outage to a level of about 70% of initial strength for a typical outage length.
In practice, an SSA containing six Sb-Be rodlets is inserted into a reactor one cycle before it is needed to activate the material and produce radioactive 124Sb. When the core is reloaded for the next fuel cycle, the SSA is moved into its new target assembly and placed back into the core near the SRD. The neutrons produced in the Sb-Be rods create a subcritical fission distribution in the adjacent fuel that is largely driven by and maximized near the SSA rodlets. The behavior of the SSA-driven fission distribution is a function of the SSAs themselves and the isotopics and burnable absorbers in the fuel assemblies that are present in the reactor core. The fissions that occur nearest to the SRD on the core periphery produce high-energy neutrons that have a higher probability to escape the reactor vessel and be absorbed in the SRDs, often after the neutron downscatters in the nearby concrete or within the thermalization medium of the SRDs themselves. Fissions that occur within the core interior do not significantly contribute to the SRD signal.
It should be noted that many commercial reactors no longer use secondary sources for startups. In most cases the neutrons born in the depleted fuel assemblies from spontaneous fission and reactions of fission products provide a sufficient startup source of neutrons. However, one unintended consequence of reliance on fission product decay sources is that the neutron strength from the burned fuel assemblies can in some circumstances mask the subcritical multiplication contribution of the core interior, leading to a nonlinear ICRR. Previous instances of this resulted in SRDs failing to register inadvertent boron dilutions.Citation3,Citation5 Since then, studies have looked at optimizing the placement of secondary sourcesCitation6 and sought analytical techniques to solve the subcritical flux distribution and nuclear instrumentation detector responses.
Most utilities rely on a source-weighted modeling approach, wherein predetermined assembly-wise weight factors are used in conjunction with calculated core neutron source distributions for the operating state of interest to approximate the ex-core detector response.Citation7,Citation11–13 However, one weakness of this approach is that the weight factors, though possibly pregenerated and functionalized for a number of different state conditions, are only approximates of the weight factors necessary to arrive at the true solution. Additional errors may also be introduced through the coarseness of isotopic tracking and/or calculated neutron source distributions typical of common industry methods (for example, nodal simulators). VERA, with its detailed pin-wise isotopic resolution and high-fidelity 3-D flux solvers, can reduce the implicit errors of the neutron source calculation and effectively bypass the weight-factor approximation via its continuous-energy (CE) Monte Carlo (MC) transport simulation capabilities.
III. METHODOLOGY
The VERA framework consists of multiple physics packages coupled together to provide high-fidelity light water reactor simulations with the goal of significantly improving current industry modeling resolution while also limiting computational expense to allow practical full-core analyses on modern small- to mid-sized clusters. In keeping with this philosophy, the work presented herein seeks to build on the previous successes of VERA and extend its high-fidelity simulation capabilities to include SRD response modeling. VERA physics modules relevant to this study include the deterministic solver MPACT (CitationRef. 14) and CE MC solver ShiftCitation15 for neutron transport, the SCALE ORIGEN API (CitationRefs. 16 and Citation17) for isotopic depletion, and the subchannel solver CTF (CitationRef. 18) for thermal hydraulics.
III.A. Stage 1: Depletion Calculation
To perform an SRD calculation in VERA for a given reactor state, two stages of calculations must be performed. First, assuming the isotopic distribution of all relevant core components (i.e., fuel, burnable inserts) is not known a priori, a series of depletion calculations must be performed starting from some initial core condition to generate the correct core-wide isotopic distribution. A simplified illustration of this simulation process using the VERA components, ignoring details such as cycle-to-cycle restart file management, is shown in . To summarize, VERA depletion simulations begin by reading the user input and setting up the core initial conditions based on the user geometry and material specifications, including fuel shuffling information pertaining to the reloading of previous burned reactor components. After setting up the base model, the simulation proceeds into the time-step loop, wherein reactor state conditions (i.e., control rod position, inlet coolant temperature, reactor power) provided in the user input are applied to the base model and the reactor is evolved through time. This evolution is performed by first solving for the steady-state solution of the neutronics/thermal-hydraulic coupled system and then passing the resultant flux solution to the depletion solver to update the isotopic conditions of the core components due to burnup. This process is repeated for all user-defined time steps until the final time step is completed, at which point the simulation is concluded.
Fig. 2. Flowchart of typical VERA depletion calculation.Footnotea
These simulations ultimately calculate the core-wide isotopic distribution for all materials designated by the user as depletable, including fuel, burnable poisons, and SSA rodlet materials. In typical calculations, unique depletion tracking is performed for each depletable material in each pin-cell at each computational axial level, with approximately 50 axial levels for the active fuel region. provides an example illustration of the detailed SSA isotopic calculations that can be achieved using VERA. As can be seen in , VERA is capable of resolving detailed radial and axial variations in SSA 124Sb concentrations with the number density versus cumulative exposure plot specifically accentuating the ability to track the detailed SSA exposure history. In this plot, one can observe not only the charging of active operation (the sharp buildup of 124Sb after every dip) and the decay of refueling outages (seen as sudden dips), but also the flux histories of each individual pin, most noticeably in the first three charging phases wherein a steep intra-assembly flux gradient introduces a significant difference in 124Sb concentrations between the pins facing the core interior versus the core exterior. This highly detailed tracking of individual depletion regions is one of the multiple capabilities that sets VERA apart from traditional modeling approaches and helps to eliminate errors associated with material burnup approximations.
Fig. 3. Examples of VERA SSA 124Sb isotopic tracking
III.B. Stage 2: MPACT Source Calculation
After determining the core isotopics for both the fuel and relevant nonfuel components, the second stage of simulations, the SRD response simulation proper, may be performed for each core loading state. provides a brief illustrative summary of the calculation progression. The simulation begins by first setting up the base conditions of the partially loaded core state under consideration, with core isotopics being read from the output of the time evolution simulations where needed. Next, ORIGEN calculates the energy-dependent neutron emission rates of every material region in the core due to decay, spontaneous fission, and reactions, effectively capturing the neutron source term from burned fuel.
Fig. 4. Flowchart of VERA SRD response calculation
The SSA neutron source term, being predominantly driven by photoneutron reactions, cannot currently be directly modeled using VERA. To address this, a user input is provided wherein the user can specify a material’s energy-dependent neutron emission rates and have this emission rate scale in each independent depletion zone of the material based on the abundance of select isotopes in the depletion zone. With this input, a user may provide approximate material-wise neutron source terms derived from other references, such as other coupled neutron-gamma simulations. For this specific calculation, MCNP simulations were used to approximate the emission rates of the SSA with respect to the concentration of 124Sb in the Sb-Be material (see Sec. IV.A). This user-specified neutron source is then added to the ORIGEN-calculated sources to make combined fixed neutron emission source for performing a source-driven fixed-source system calculation to determine the fission source.
Though Shift is capable of determining a fission source distribution given a fixed source, current limitations in Shift prevent its use of the depleted core isotopics. This is due to Shift not currently supporting the domain decomposition of isotopic data, which is necessary to spread the large memory footprint of the isotopic data across multiple processes. Therefore, MPACT was used to calculate the fission source distribution. The MPACT source-driven fixed-source solver leverages much of the same solver framework used for the typical eigenvalue system solver, but with the eigenvalue term and eigenvalue update excluded, focusing solely on the fission source update iterations and fixed-source solver, supplementing them with the additional source terms provided by the ORIGEN-calculated/user-defined sources.
To briefly summarize the underlying mechanics of the two-dimensional (2-D)/one-dimensional (1-D) fixed-source solver, the coarse-mesh finite-difference (CMFD) solver acts as the primary driver of the fixed-source solver with interactions between the 2-D radial method of characteristics (MOC) solvers and 1-D axial nodal expansion method (NEM)–P3 solvers being primarily communicated through a update based on the current terms
,
, and
, as well as the calculated scalar fluxes
. A full description of the solver interactions and iteration schemes are detailed in CitationRefs. 14 and Citation21.
Initial attempts were made to use the source-driven fixed-source solver with the traditional MPACT 2D-/1-D method, but only limited success was achieved.Citation22 Two-dimensional radial problems using MOC without CMFD acceleration exhibited good convergence with reasonably shaped flux solutions. However, using CMFD acceleration on partially loaded core models, even 2-D radial simulations exhibited unstable behavior. To address this, the update for CMFD coming from the 2-D radial MOC solvers and 1-D axial NEM–P3 solvers was disabled while still allowing CMFD to use the MOC-shielded cross sections. This effectively results in CMFD stably converging to a diffusion solution. Upon convergence, this pin-homogenized diffusion-based solution is still passed to the MOC solvers to obtain a final fine-mesh solution, an example of which is provided in .
Fig. 5. Example of fine-mesh thermal neutron flux solution with secondary sources at core midplane in n/cm2·s
As is shown in Sec. V, this approach, although not entirely ideal from the standpoint of high-fidelity simulations (i.e., using a diffusion-based solution as opposed to a true transport solution), has thus far proven sufficiently accurate for predicting relative detector response calculations. In the future, this approach may ultimately be replaced with a high-fidelity approach (e.g., SN or CE-MC).
III.C. Stage 3: Shift Detector Response Calculation
Upon convergence of the source-driven fixed-source flux solution, MPACT has calculated the material regionwise nuclide-dependent fission source distribution and passed this to Shift. Shift then sets up a CE-MC fixed-source transport calculation using in-core/ex-core geometries and tallies based on user input, as well as fission source distributions for each state from MPACT.
It should be noted that this Shift model, due to the aforementioned inability to use the depleted isotopics of the fuel, only uses the fresh (i.e., undepleted/activated) isotopics of the core materials. It was assumed that this approximation would have a negligible effect on the fixed-source transport of the fission source to the detector, being that detector response is primarily driven by the fast-neutron emissions. Transport of these fast neutrons to the detector is mostly determined by moderator and heavy nuclide densities (i.e., 238U) that do not substantially change with burnup. The larger resonances and lower-energy cross sections of fission products are assumed to have little influence on the fast-neutron transport.
Shift uses the energy-integrated MPACT fission sources of 235U, 238U, 239Pu, and 241Pu to obtain a source rate spatial distribution for each of these isotopes and samples each isotope’s respective Watt spectrum to obtain the energy distribution.
Users may specify Shift to run either with standard particle tracking (i.e., forward mode) or with Consistent Adjoint-Driven Importance Sampling (CADIS) to greatly reduce computation time and the statistical uncertainty of tallies (between approximately 165 and 170 times reduction in required computational resources depending on the model).Citation23 In CADIS mode, the Denovo deterministic transport codeCitation24 is used to calculate the adjoint function that is used to create space- and energy-dependent variance reduction parameters (weight windows, see CitationRef. 25). The source used for the adjoint calculation determines the response that the generated variance reduction parameters will optimize, which in these models were provided by the detector tally locations. Additionally, a new separable weight windows methodology that uses a singular value decomposition to separate the importance function into independent energy and spatial vectors was applied to reduce memory consumption during the calculations.Citation26
The SRDs were modeled as axis-symmetric void regions about the core midplane, with 235U fission tallies in these regions being used to calculate the relative detector response. At the conclusion of the Shift run, detector tallies are finalized, the VERA simulation terminated, and the tally results postprocessed outside VERA to obtain SRD response values.
IV. MODELS
To assess the efficacy of this SRD response modeling approach, simulations were performed on multiple cycles of WBN1, specifically cycles 8 through 15, for the first few fuel loading maneuvers during a core reload. Core geometry details used to create these models are based on the specifications in CitationRef. 9, the SSA description in CitationRef. 1, and the detector models in CitationRef. 27. Publicly available details pertaining to the fuel assembly specifications and core loadings for cycles 1 and 2 are available in CitationRef. 10, but as of the time of this writing, all other cycles beyond these were proprietary and except for some details provided herein could not be fully presented in this paper. The MPACT model domain considers only the region of space inside the reactor vessel, which has been demonstrated to be an accurate approximation of the full domain when calculating the in-core fission distribution.Citation28 The Shift model, illustrated in , consists of eight power range detectors (top and bottom), two SRDs, two dual surveillance capsules with no coupons in the northeast and southwest quadrants, two single surveillance capsules in the northwest and southeast quadrants, and a cylindrical concrete shield with detector wells. The reactor geometry from the center of the core to the barrel’s outer radius in the radial direction and from the lower to upper core plates in the axial direction is extracted from the VERA common input. The geometry and material compositions outside the barrel are explicitly defined with a Shift General Geometry input. For the calculations presented in this paper, 235U(n,fission) response tallies in the SRDs located at the north and south faces of the reactor vessel are set up in the Omnibus input to calculate the detector response as the fuel is being loaded. The SRDs are approximately half the height of the active fuel and are axially centered in the core midplane.
The depletion of all fuel and SSA materials was tracked from cycle 1 to cycle 15 using the procedure outlined in for every cycle. To accelerate these simulations, quarter rotational symmetry was applied for cycles 1 through 6 where such symmetry in core loading and SSA placement was present. Cycles 7 through 15 were run with no rotational symmetry (i.e., full-core geometry) to capture the nonsymmetric activation histories of the SSAs induced by prior nonsymmetric loading. It should also be noted that in quarter-symmetric models, the in-core detector thimbles were not explicitly included because of their lack of symmetry; however, this has been consistently shown to have negligible impact on core depletion behavior.Citation10
After achieving the detailed activation history of the fuel and SSAs for each of the considered cycles, SRD response calculations were performed for each loading step of the first nine assemblies on each side of the core (north and south) nearest the SRDs. The typical refueling process steps for these fuel moves are as follows (see also ):
Fig. 6. Example core loading sequence for south SRD response
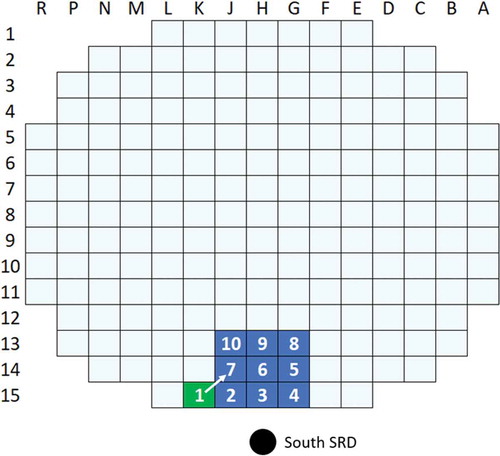
Step 1: The first assembly containing the SSA is placed on the core periphery near the SRD. This was typically locations K-1 for the north SRD and K-15 for the south SRD.
Steps 2, 3, and 4: The next three assemblies are placed in their core design locations on the core periphery. (Core design refers to the core locations where assemblies will be located for normal operation.)
Steps 5 and 6: The next two assemblies are placed on the next row away from the detector behind those on the periphery in their core design locations.
Step 7: The SSA-bearing assembly from step 1 is moved to its final core design location in the second row, away from the SRD. This results in a significant drop in the SRD signal.
Steps 8, 9 and 10: The next three assemblies are loaded on the third row, forming a 3 × 3 arrangement of the fuel assemblies.
It should be noted that this procedure is only representative and sometimes varies from cycle to cycle. In some cycles, the final location of the SSA-bearing assembly is on the third row rather than the second, which changes the sequence slightly. Variations in core design result in different configurations of fresh and burned fuel assemblies and burnable poisons in each configuration. Control rods are included in each calculation as fully inserted in their corresponding locations. Empty core locations were simulated as containing borated water (concentration of 3000 ppm) with reactor conditions at room temperature and atmospheric pressure. North- and south-side simulations were run independently (i.e., no north assemblies were present when simulating south SRD response and vice versa). This assumes that the nine assemblies of one side have a negligible influence on the response of the opposite-side SRD.
IV.A. SSA Source Term
As stated in Sec. III, the SSA neutron source term cannot be directly calculated using ORIGEN under VERA and must be defined per source specification in input. Specifications of this source term were obtained by first approximating a characteristic gamma field that a representative Sb-Be rodlet would experience, approximating from this field the rate and energy spectrum of photoneutrons produced from 9Be and translating these approximate photoneutron emissions into a corresponding user-defined source term.
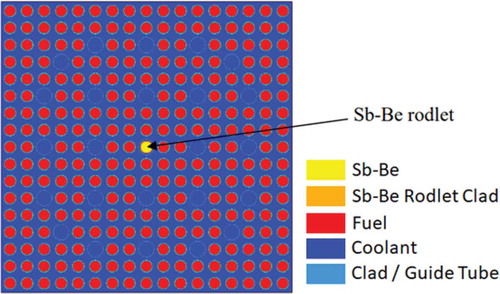
Two sources of gammas were considered for analysis of the Sb-Be rods. First, gammas emitted from decay of 124Sb, followed by gammas emitted by depleted fuel. Gammas from 122Sb, which is produced by the activation of 121S present in the Sb-Be material, were excluded because their energies are below the threshold energy of the 9Be photonuclear reaction. A series of 2-D infinite lattice depletions were performed with MPACT using the simplified model shown in . This is a typical 17 × 17 fuel lattice from WBN1 but is assumed to have a single SSA Sb-Be rodlet at its center. Unlike the actual SSA geometry that has six rodlets, a single rod is used in this case to create quarter-assembly symmetry. These models were used to develop characteristic isotopics for the Sb-Be rodlet and the depleted fuel for a variety of enrichments and burnups.
Fig. 7. Single 2-D fuel lattice example for generation of isotopics
The resulting 124Sb concentrations and fuel isotopics from the 2-D infinite lattice depletions were then input into a standalone ORIGEN simulation to determine the gamma strength and energy spectrum from the activated materials (fuel and Sb-Be) as a function of time. Refueling outage lengths of 10 to 30 days were considered, spanning the typical range of core empty lengths for WBN prior to fuel being loaded back into the core.
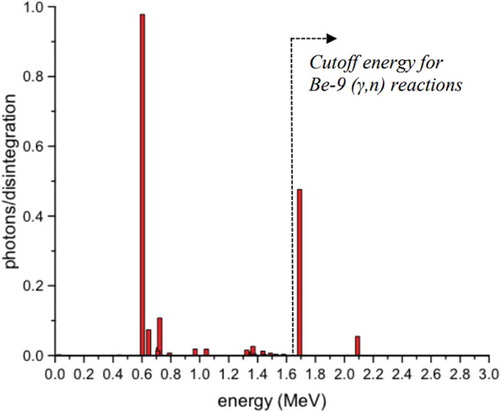
The gamma spectrum for 124Sb is illustrated in . Two main gammas are observed in this spectrum: a primary gamma at 1.69 MeV (0.48 yield) and a secondary gamma at 2.09 MeV (0.05 yield). There is also a high-yield gamma at 0.6 MeV, however, as the 9Be photoneutron has a reaction threshold energy of 1.67 MeV, this gamma is not relevant to the neutron production here.
Fig. 8. Gamma emission spectrum of 124Sb
The gamma field from burned fuel was determined by extracting the assembly-average fuel isotopics at 20, 35, and 50 GWd/tonne U burnup and decaying them over the range of considered outage times. The spectrum for 35 GWd/tonne U fuel after a 30-day outage is compared with that from the Sb-Be in , for example. When considering the various burnup and outage time results, the following conclusions were made:
Fig. 9. Gamma emissions from 35 GWd/tonne U fuel and Sb-Be rodlet at 30-day outage length
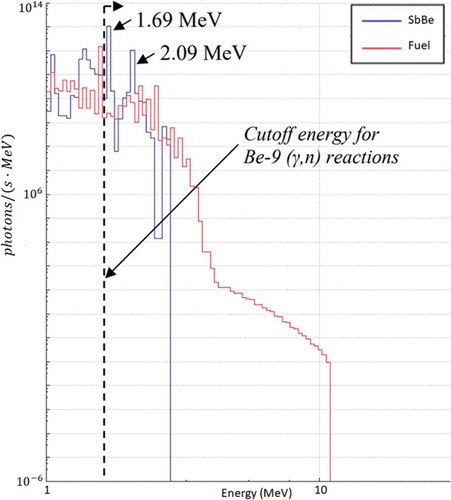
The gamma emission strength from depleted fuel decreases quickly in the first 10 days after reactor shutdown. Since core-empty periods are usually longer than 10 days, this period prior to 10 days can be ignored.
The gamma emissions that have higher frequencies than the 124Sb emissions happen at energies smaller than the 9Be photoneutron reaction threshold of 1.67 MeV.
The gammas emitted in fuel at energies greater than 1.67 MeV occur at intensities of more than two orders of magnitude less than that of 124Sb gammas.
Based on the ORIGEN results from these analyses, it appears that the vast majority of photoneutrons from 9Be will be produced by 1.69-MeV gammas emitted from 124Sb in the Sb-Be rods. Follow-on MCNP6 (CitationRef. 29) coupled neutron and gamma fixed-source transport calculations were performed using the ORIGEN-calculated gamma emission spectra of both the Sb-Be and fuel to evaluate the neutron emission strength and relative spectrum. It should be noted that MCNP was used instead of Shift for these calculations because of familiarity using MCNP for such calculations and readily available models for this purpose. Gamma sources corresponding to the decay of 124Sb were placed in Sb-Be rods, and gamma sources with representative energy spectra from depleted fuel were placed in fuel rods. The effects of the Sb-Be and depleted fuel gammas were determined independently by tallying the 9Be reactions for each rod type. The MCNP model is shown in and includes a 2-D 5 × 5 fuel lattice with the Sb-Be rodlet at the center. This model is sufficiently large to capture the effects of delayed gamma emissions from the fuel on the Sb-Be rodlet while being sufficiently small to ensure good photonuclear reaction statistics. The problems were run at room temperature (293 K) and atmospheric pressure conditions, and 3000 ppm boron concentration in the coolant to simulate refueling conditions.
Fig. 10. MCNP6 model of 5 × 5 fuel rods surrounding a single Sb-Be rodlet
From these analyses, it was concluded that the 9Be photoneutron production can be assumed to be entirely from the decay of 124Sb in the Sb-Be rodlet and is not significantly impacted by the isotopic concentrations in the nearby fuel rods of the host assembly, both in terms of 124Sb gamma and fission product gamma emissions.
Using the 5 × 5 MCNP-coupled neutron-gamma model, photoneutron emissions were approximated with respect to the gamma source, which itself can be correlated to 124Sb decay using the yields of 124Sb 1.69 and 2.09-MeV gammas and the amount that these 124Sb gammas comprise the full MCNP gamma source definition. This was then scaled with respect to 124Sb decay using the 124Sb half-life to arrive at a rather simple specification of the Sb-Be neutron source in terms of a 124Sb isotopic scaling factor based on a 700 000 n/s/Ci multiplier and a relative emission spectra shown in . This scaling factor is directly dependent on the 9Be concentration and geometry used in the MCNP model, but 9Be has been shown to deplete by less than 1% over the SSA lifetime; therefore, the scaling factor assumption is considered adequate.
TABLE I Neutron Flux Spectrum of Photoneutrons Produced in Sb-Be
Given the approximate nature of this SSA source emission term, along with other uncertainties in factors that would affect actual plant detector response magnitude (electronics calibrations, detector burnup, etc.), this study has limited its analysis to the relative changes in ex-core detector response rather than absolute magnitude predictions of signals or interactions.
V. RESULTS
The SRD responses for cycles 8 to 15 were calculated using VERA and were compared against the measured SRD signals provided by TVA. Cycles 8 and 9 only include the south SRD results due to an incomplete activation history in the model for the SSA in the north location. All others cycle models had complete SSA activation histories. The data provided by TVA were raw signals in counts per second (cps) and required a small amount of preprocessing to remove spurious data. The raw signal and calculated results are provided in with comparisons summarized in . EquationEquations (2)(2)
(2) through (Equation7
(7)
(7) ) define the terms presented in :
Fig. 11. SRD detector signal (cps) versus measurement time plots (h) for (a) cycle 8-south SRD and (b) cycle 9-south SRD
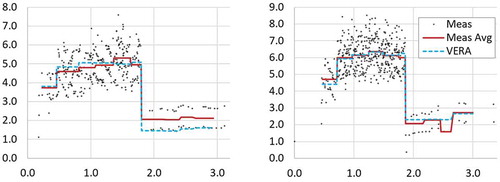
Fig. 12. SRD detector signal (cps) versus measurement time plots (h) for (a) cycle 10-south SRD and (b) cycle 10-north SRD
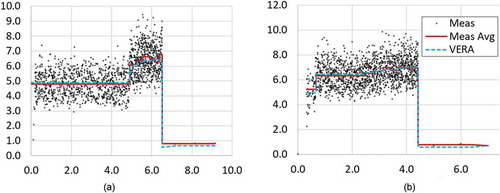
Fig. 13. SRD detector signal (cps) versus measurement time plots (h) for (a) cycle 11-south SRD and (b) cycle 11-north SRD
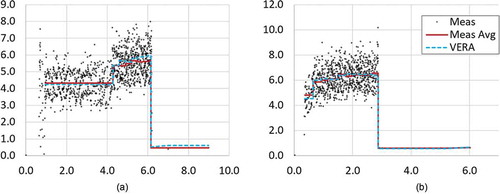
Fig. 14. SRD detector signal (cps) versus measurement time plots (h) for (a) cycle 12-south SRD and (b) cycle 12-north SRD
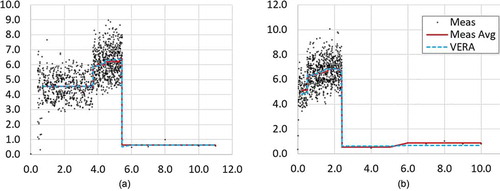
Fig. 15. SRD detector signal (cps) versus measurement time plots (h) for (a) cycle 13-south SRD and (b) cycle 13-north SRD
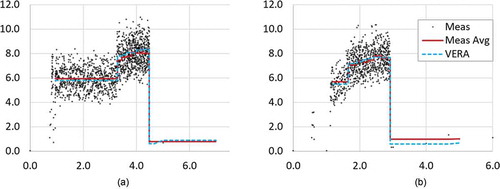
Fig. 16. SRD detector signal (cps) versus measurement time plots (h) for (a) cycle 14-south SRD and (b) cycle 14-north SRD
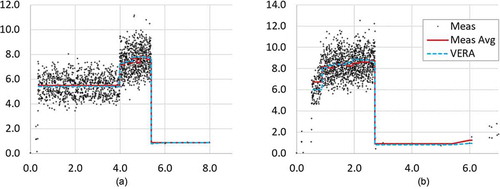
Fig. 17. SRD detector signal (cps) versus measurement time plots (h) for (a) cycle 15-south SRD and (b) cycle 15-north SRD
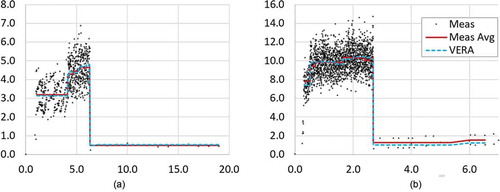
TABLE II Summary of Measured Versus Calculated SRD Response Results
St. Dev. of Error in Avgs.
and
where
| = | individual time points | |
| n = | = | total number of evaluated points |
| j = | = | fuel loading steps, which include all time points between completed fuel movements |
| N = | = | total number of fuel steps |
| = | measured SRD response at time step | |
| = | average measured SRD response | |
| = | VERA-calculated responses corresponding to time steps | |
| = | number of recorded measurements for fuel loading step | |
| RMSE = | = | root-mean-squared error |
| RSD = | = | relative standard deviation. |
Notable in each plot is a significant decrease in the measured signal when the secondary-source-bearing fuel assembly is relocated away from the core periphery to its final core design location. From an operations and design perspective, the loading of the fuel and SSA must be such that the requisite minimum level of counts is maintained during refueling activities. Therefore, accurate prediction of this drop in detector signal is highly important when performing core design.
Significant scatter can be observed in the data near any specific time, with some cases exhibiting significant up and down fluctuations due to the neutron detection logic settings in the instrumentation system. The number of data points varies as a function of time, with some of the fuel moves being represented by hundreds or thousands of data points, while others may have only a few. This is also due to the instrumentation system, which may not store successive data points with similar values. This variation in measured points was taken into account when performing averaging through weighting.
Because of the significant scatter in the measured data, an alternate approach to direct comparison was developed for evaluating the VERA-calculated results. For comparison to VERA, the measured data for a particular fuel move is averaged over the time window of the fuel move. This averaging removes a significant portion (90%) of the measurement variation for each fuel move. The average signal is calculated using the times logged in fuel movement logs provided by TVA. The time endpoints are assumed to be representative of the moment the loaded fuel is placed in position in the core to the nearest minute. Changes in the measured signals due to fuel movement or the time required for the neutron flux level to reach equilibrium are ignored. This means that measured data resulting from intermediate conditions between moves are implicitly included in the averages over that time period. This method results in an equivalent average measurement for each of the ten fuel movement steps described in Sec. IV that are compared with the normalized VERA-calculated detector signals for those ten steps.
To calculate the SRD response from VERA, the detector responses and relative standard errors (RSEs) from Shift were normalized to the average measurement signal for each SRD and cycle via a cycle- and detector-dependent scaling factor:
This average is the unweighted average of all the measured signals taken between the insertion of the first assembly in the core and a short time after the ninth assembly was inserted. This allows comparison of relative changes in SRD response due to changes in the reactor core without the influence of other factors that might affect the strength of the signal (differences in detectors, electrical signals, 9Be photonuclear cross sections, etc.).
The results in show excellent agreement between the measured and calculated detector responses, with the RMSEs being approximately 1.02 cps or 15.5% compared with the RSD of the measured signals within each time interval of 14.7%. This indicates that the vast majority of the response differences are associated with variation in the measurement signal within the time periods between fuel moves. Comparison of the VERA-normalized SRD responses to the average measurement signal over each interval produces much better agreement of 0.16 cps, or −0.2% 3.1% relative error. Based on these data sets, the error in the VERA response compared with average measurements (3.1%) is much smaller than the RSD of the raw measurement points themselves (14.7%).
The run times for these VERA cases varied depending on the number of fuel assemblies in the core and the flux convergence, which can be exacerbated with strong secondary-source assemblies and strong neutron absorbers (i.e., control rods). Detailed run times for each set of calculations are shown in . MPACT calculations required approximately 34 min on 1920 cores. Using CADIS, Shift calculations required 10 min on 400 cores, producing an average of 1.3% RSE with only 100 million particles simulated per state point. One outlier in Shift run-time lengths was observed in a 13-north model. This was caused by a known issue with a single particle having a long history due to variance reduction splitting, but such extended run times are rarely observed in Shift depending on the model being simulated. Ignoring this outlier, the total average run time was typically about 44 min on 2320 cores. These calculations were performed on an Oak Ridge National Laboratory compute cluster with Intel® Xeon® CPU E5-2698 v3 at 2.30-GHz cores and approximately 4 GB/core of memory. It should be noted that though not explicitly compared in this paper, the use of the CADIS method in Shift resulted in several orders of magnitude in improvement in terms of computation required to obtained a desired level of solution uncertainty.
TABLE III VERA Computational Performance*
VI. CONCLUSIONS
Core loading of some nuclear power plants involves the use of nonfuel neutron emission sources, such as SSA, to assist with accurately measuring core criticality and to ensure the operability of ex-core SRDs. Several capabilities have been recently added to the CASL simulator VERA that have enabled high-fidelity simulations of the ex-core detector response during core loading:
activation and shuffling of secondary-source assemblies
implementation of a low-order deterministic transport method for subcritical source-driven systems with neutron multiplication
use of delayed neutron emission data from ORIGEN to MPACT for burned fuel assemblies
ability for users to define neutron sources to account for sources outside the direct modeling envelope (e.g., Sb-Be photoneutron production)
development of an effective source strength factor and spectrum for the secondary-source rods using ORIGEN and MCNP
Shift CADIS modeling of detector responses using the direct fission source from MPACT.
VERA simulations of the SRD response during the startup of cycles 8 to 15 were performed and compared with measured data. Results from this comparison demonstrate validations of the VERA models and methods for simulating SRD responses during subcritical core loading procedures at WBN1. They show that the current VERA modeling capabilities can accurately predict the detector signals of core loading sequences and can be used to ensure that a give core design, considering both fuel and SSA loading, preserves the minimum requisite detector count rate.
Although this has been a successful benchmarking exercise for VERA’s SRD response capabilities, future work in the following areas may improve VERA’s accuracy and expand its current capabilities:
Improve MPACT calculation method of the fission source distribution or improve Shift to perform this calculation.
Add capability to include burned fuel isotopics in Shift detector response simulation.
Implement an in-line gamma-neutron calculation of the Sb-Be neutron source via Shift rather than an approximate user-specified source term.
Conduct a sensitivity study of the importance of delayed neutrons and/or secondary-source neutrons to the detector response (rather than just fission neutrons).
Demonstrate and validate the capability to predict ICRR curves for reactor startup.
Acknowledgments
This research was supported by CASL (www.casl.gov), an Energy Innovation Hub for Modeling and Simulation of Nuclear Reactors (http://www.energy.gov/hubs) under the U.S. Department of Energy (DOE) contract number DE-AC05-00OR22725.
This research made use of the resources of the High Performance Computing Center at Idaho National Laboratory, which is supported by the DOE Office of Nuclear Energy under contract number DE-AC07-05ID14517.
This research also used resources of CADES at Oak Ridge National Laboratory, which is supported by the DOE Office of Science under contract number DE-AC05-00OR22725.
Notice: This manuscript has been authored by UT-Battelle, LLC, under contract DE-AC05-00OR22725 with the DOE. The U.S. government retains and the publisher, by accepting the article for publication, acknowledges that the U.S. government retains a nonexclusive, paid-up, irrevocable, worldwide license to publish or reproduce the published form of this manuscript, or allow others to do so, for U.S. government purposes. DOE will provide public access to these results of federally sponsored research in accordance with the DOE Public Access Plan (http://energy.gov/downloads/doe-public-access-plan).
Notes
a For this calculation, fuel temperatures were calculated based on Bison-generated.Citation19,Citation20 temperature tables with the coolant-to-fuel ΔT functionalized with respect to power and fuel burnup.
References
- “Watts Bar Nuclear Plant Unit —Amendment 99 to Final Safety Analysis Report (FSAR),” Watts Bar Unit 2 Final Safety Analysis Report, Tennessee Valley Authority (2010); https://www.nrc.gov/docs/ML1016/ML101610356.pdf ( current as of May 2, 2020).
- “Neutron Monitoring System,” Westinghouse Technology Systems Manual, Chap. 9, Westinghouse Electric Co. (2002); https://www.nrc.gov/docs/ML0230/ML023040050.pdf ( current as of May 2, 2020).
- W. BOJDUJ, “Source Range Detector Response During Boron Dilution Accident at Shutdown,” Trans. Am. Nucl. Soc., 103, 517 (2010).
- A. FORD, “Modeling a Source Range Channel Response During a PWR Core Onload Sequence,” Trans. Am. Nucl. Soc., 103, 639 (2010).
- M. SARTIN, “Virginia Electric and Power Company Surry Power Station Units 1 and 2 Proposed License Amendment Request Expansion of Primary Grade Water Lockout Requirements in TS 3.2.E Response to Request for Additional Information,” Letter from Dominion Generation to the Nuclear Regulatory Commission (2016); https://www.nrc.gov/docs/ML1629/ML16295A335.pdf ( current as of May 2, 2020).
- J. SUN, M. YAHYA, and Y. KIM, “A Study on the Optimal Position for the Secondary Neutron Source in Pressurized Water Reactors,” Nucl. Eng. Technol., 48, 6, 1291 (2016); https://doi.org/10.1016/j.net.2016.05.002.
- T. BAHADIR, M. GIFFEN, and C. WELLS, “Fixed-Source and Ex-Core Detector Calculations with SIMULATE5,” presented at the Int. Conf. on Mathematics Computational Methods Applied to Nuclear Science & Engineering (M&C 2017), Jeju Island, South Korea, April 16-20 2017. (2017).
- J. TURNER et al., “The Virtual Environment for Reactor Applications (VERA): Design and Architecture,” J. Comput. Phys., 326, 544 (2016); https://doi.org/10.1016/j.jcp.2016.09.003.
- A. GODFREY, “VERA Core Physics Benchmark Progression Problem Specifications,” CASL-U-2012-0131-004, Consortium for Advanced Simulation of Light Water Reactors (2014).
- A. GODFREY et al., “VERA Benchmarking Results for Watts Bar Nuclear Plant Unit 1 Cycles 1-12,” CASL-U-2015-0206-000, Consortium for Advanced Simulation of Light Water Reactors (2015).
- H. TOCHIHARA, E. OCHIAI, and T. HASEGAWA, “Reevaluation of Spatial Weighting Factors for Ex-Core Neutron Detectors,” Nucl. Technol., 58, 2, 310 (1982); https://doi.org/10.13182/NT82-A32939.
- J. AHN, N. CHO, and J. KUH, “Generation of Spatial Weighting Functions for Ex-Core Detectors by Adjoint Transport Calculation,” Nucl. Technol., 103, 1, 114 (1993); https://doi.org/10.13182/NT93-A34834.
- M. PECCHIA et al., “A Methodology for Evaluating Weighting Functions Using MCNP and Its Application to PWR Ex-Core Analyses,” Ann. Nucl. Energy, 105, 121 (2017); https://doi.org/10.1016/j.anucene.2017.03.008.
- B. COLLINS et al., “Stability and Accuracy of 3D Neutron Transport Simulations Using the 2D/1D Method in MPACT,” J. Comput. Phys., 326, 612 (2016); https://doi.org/10.1016/j.jcp.2016.08.022.
- T. PANDYA et al., “Implementation, Capabilities, and Benchmarking of Shift, a Massively Parallel Monte Carlo Radiation Transport Code,” J. Comput. Phys., 308, 239 (2016); https://doi.org/10.1016/j.jcp.2015.12.037.
- B. REARDEN and M. JESSEE, “SCALE Code System,” ORNL/TM-2005/39, Version 6.2, Oak Ridge National Laboratory (2016).
- W. WIESELQUIST, “The SCALE 6.2 ORIGEN API for High Performance Depletion,” Proceedings of Joint International Conference on Mathematics and Computation (M&C), Supercomputing in Nuclear Applications (SNA) and the Monte Carlo (MC) Method, Nashville, TN April 19-23 (2015).
- M. AVRAMOVA, CTF: A Thermal Hydraulic Sub-Channel Code for LWR Transient Analyses, User’s Manual, Pennsylvania State University, Department of Nuclear Engineering (2009).
- S. STIMPSON et al., “Pellet-Clad Mechanical Interaction Screening with VERA in Watts Bar Unit 1, Cycles 1–3,” Nucl. Eng. Des., 327, 172 (2018); https://doi.org/10.1016/j.nucengdes.2017.12.015.
- “Automation and Assessment of Fuel Temperature Tables Used by VERA-CS,” CASL-X-2016-1203-000, Oak Ridge National Laboratory and University of Michigan (2016).
- “MPACT Theory Manual, Version 2.2.0,” CASL-U-2016-1107-000, Oak Ridge National Laboratory and University of Michigan (2016).
- C. GENTRY, B. COLLINS, and A. GODFREY, “Modeling of Subcritical PWR with Fixed Neutron Source Using MPACT,” Trans. Am. Nucl. Soc., 117, 1227 (2017).
- J. WAGNER and A. HAGHIGHAT, “Automated Variance Reduction of Monte Carlo Shielding Calculations Using the Discrete Ordinates Adjoint Function,” Nucl. Sci. Eng., 128, 2, 186 (1998); https://doi.org/10.13182/NSE98-2.
- T. EVANS et al., “Denovo—A New Three-Dimensional Parallel Discrete Ordinates Code in SCALE,” Nucl. Technol., 171, 2, 171 (2010); https://doi.org/10.13182/NT171-171.
- T. E. BOOTH, “A Sample Problem for Variance Reduction in MCNP,” LA-10363-MS, Los Alamos National Laboratory (1985).
- E. BIONDO et al., “Singular Value Decomposition of Adjoint Flux Distributions for Monte Carlo Variance Reduction,” Ann. Nucl. Energy, 141, 107327 (2019); https://doi.org/10.1016/j.anucene.2020.107327
- E. DAVIDSON et al., “Testing of Omnibus General Geometry Models for Ex-Core Applications in VERA,” CASL-U-2018-1561-000, Consortium for Advanced Simulation of Light Water Reactors (2018).
- S. STIMPSON et al., “Higher Resolution Radial Reflector Modeling Capabilities in MPACT,” presented at PHYSOR 2018: Reactor Physics Paving the Way towards More Efficient Systems, Cancun, Mexico, April 22-26 (2018).
- MCNP Team, “MCNP6 Users Manual—Code Version 6.1.1beta,” LA-CP-14-00745, Los Alamos National Laboratory (2014).