
 ?Mathematical formulae have been encoded as MathML and are displayed in this HTML version using MathJax in order to improve their display. Uncheck the box to turn MathJax off. This feature requires Javascript. Click on a formula to zoom.
Abstract
The operation of many nuclear pressurized water reactors is being extended beyond their design lifetime threshold. From the perspective of possible further lifetime extension, satisfying safety requirements is a priority. Characterization of the structural integrity of the reactor pressure vessel (RPV) is an important issue as it is a guiding parameter that influences the reactor lifetime. Embrittlement of RPV material is primarily induced by the bombardment of fast neutrons (with energies greater than 1 MeV). Consequently, fast neutron fluence is one of the quantities used by safety authorities to characterize the structural integrity of RPV. However, future RPV aging assessments might lean on new variables with respect to current laws, such as neutron fluence considering the whole neutron spectrum or displacements per atom (dpa) since the latter is more representative of overall damage generated in the RPV. In order to meet these challenges, a versatile calculation scheme for RPV aging assessments is proposed in this paper. The developed methodology allows one to compute (fast and non-fast) neutron fluence as well as dpa rate, using the Norgett-Robinson-Torrens dpa model and the Athermal Recombination Corrected dpa model, for a wide azimuthal and axial range on the RPV and in the capsules of the aging monitoring program (which contain dosimeters and vessel material samples). This methodology is based on a coupling between deterministic (CASMO5 and SIMULATE5) and Monte Carlo (MCNP6) numerical approaches. First, the deterministic approach is used to evaluate the full-core fission neutron source term. Second, Monte Carlo modeling is used to perform the neutron attenuation from the core to sites of interest, such as the RPV. The computational efficiency, accuracy, and potential benefits of the methodology are presented. Moreover, the frequency at which neutron transport calculations should be performed in order to obtain sufficiently accurate time-integrated data over a reactor cycle is discussed. Finally, the validity of the fast neutron fluence as an indicator of RPV aging is compared against the use of dpa.
I. INTRODUCTION
The lifespan of nuclear power plants and their extension are strongly related to the aging of the reactor pressure vessel (RPV) due to neutronic irradiation. Indeed, irradiation-induced displacement damage causes the reactor vessel to embrittle throughout its operating lifetime. This embrittlement is primarily induced by the bombardment of fast neutrons (i.e., with energies greater than 1 MeV) (CitationRef. 1), which displaces atoms from their lattice site. To monitor this embrittlement, the majority of RPVs have an individual irradiation surveillance program.Citation2,Citation3 These surveillance programs include so-called capsules that are usually composed of vessel material specimens for mechanical tests of strength and toughness as well as dosimeters. These capsules are usually attached to the core barrel or the thermal neutron shield, so the specimens receive a neutron flux higher than the neutron flux at the vessel. Thus, their state of embrittlement is more advanced with respect to the RPV inner wall. These capsules are withdrawn during plant outages, when predefined fast neutron fluence (fast neutron flux integrated over time) levels have been reached. The mechanical tests performed on the specimens allow—in conjunction with the data provided by the dosimeters—one to establish an empirical correlation between the accumulated fast neutron fluence and the structural integrity of the vessel.
Estimations of the fast neutron fluence in the vessel can be carried out by numerical simulations, and various approaches have been developed worldwide to perform such estimations.Citation4–7 However, fast neutron fluence estimations by numerical simulations are subject to large uncertainties [between 10% and 20% (CitationRefs. 8, Citation9, and Citation10), which can represent about 5 to 15 years of operating time]. These uncertainties are due to nuclear data,Citation11 approximations in the modeling,Citation12 geometrical uncertainties, etc. Moreover, as reactors are aging, the fast neutron fluence accumulated at the RPV may approach the safety limit value evaluated by the surveillance program, and the reactor operation may be modified. Such modifications of operation may result in various spatial and energetic neutron fluence distributions at the RPV. For these reasons, there is a need to better quantify the uncertainty of aging estimations. Furthermore, the validity of the surveillance programs for every reactor configuration/management and positions on the vessel can be questioned. Consequently, the issues related to possible further extensions of reactor lifetime are challenging, and the question of the development of a precise and accurate method for RPV aging assessments is relevant. Such development requires in-depth analysis of the parameters that may influence vessel aging (fuel management variability, core power history, etc.), and other quantities such as displacements per atom (dpa) could be considered in further approaches. All these issues imply a need for innovative and versatile calculation methods.
To meet these needs, an effort has been undertaken toward the development of a versatile, best-estimate calculation scheme for fast neutron flux as well as dpa rate estimations. In particular, the authors are focusing on estimating these quantities over a wide azimuthal and axial range in the RPV of pressurized water reactors (PWRs) and in the capsules of the surveillance program.
First, the adopted calculation scheme is presented in Sec. II along with the expected precision and computational efficiency. Second, the developed methodology is used to assess, for a particular reactor cycle, the best time-integration method. The corresponding study is featured in Sec. III. Third, an example of a research question that can be addressed using the developed methodology is presented in Sec. IV. This study aims at comparing the use of fast neutron fluence against dpa for aging assessments. Finally, conclusions are drawn in Sec. V.
II. METHODOLOGY FOR AGING ASSESSMENTS
The methodology relies on a two-step approach, coupling deterministic and Monte Carlo calculations. The first step estimates the full-core fission neutron source term, and the second step consists of the transport of neutrons from the core to the RPV using the fission neutron distribution determined in the previous step. This methodology aims at evaluating various quantities (neutron flux, dpa, lead factors, etc.) for a wide axial and azimuthal range in the RPV (and in the capsules), with a high level of precision, accuracy, and efficiency.
II.A. Evaluation of the Fission Neutron Source Term
As outlined previously, the first step of the calculation is to evaluate the fission neutron source term. Besides the angular dependency, the number of fission neutrons emitted per second at time , per unit volume around point
in space, and per unit energy around energy
can be defined as
where for an isotope ,
| = | fission rate | |
| = | number of neutrons emitted per fission | |
| = | fission spectrum ( | |
| = | energy of the neutron inducing the fission | |
| = | energy of the emitted neutron |
The product represents the spatial distribution of fission neutrons whereas
describes the energetic distribution of these neutrons.
In general, the neutrons generated in the process of nuclear fission can be broadly classified as prompt neutrons and delayed neutrons. These neutrons differ in energies and timescale of generation. However, the present study considers that both the prompt neutron energy spectra and the delayed neutron energy spectra can be sufficiently modeled by an average neutron spectrum. Moreover, fission neutrons are considered to be emitted isotropically. The authors consider that this modeling is acceptable to carry out aging analysis while avoiding the complexities involved by the use of two different neutron spectra and by a detailed angular treatment of fission reactions.
In the present case, the spatial dependency of the fission neutron source term ( product) is evaluated by means of core-following calculations performed by a deterministic approach, coupling the CASMO5 codeCitation13 and the SIMULATE5 code.Citation14 The CASMO5 code is used to generate fuel assembly homogenized eight-group macroscopic cross-section data. Then, the SIMULATE5 code uses these data as a multiparametric database (since the energy group cross sections depend on moderator density, boron concentration, etc.) to compute the full-core fission neutron source term.
On the CASMO5 side, the two-dimensional (2-D) stationary transport equation (the axial dimension being considered as infinite) is solved for assemblies in an infinite lattice, using a 586-group data library based on ENDF/B-VII.1 nuclear data.Citation15 First, the collision probability methodCitation16 is used with 586 energy groups, on a coarse spatial mesh. Second, the method of characteristicsCitation16 is used on a refined spatial mesh with 19 energy groups for uranium oxide (UOX) assemblies and 35 energy groups for mixed oxide (MOX) assemblies.
On the SIMULATE5 side, the diffusion equation is solved with 8 energy groups on 4 radial nodes and 20 axial divisions in each assembly. SIMULATE5 evaluates the total fission neutron emission rate distribution () in the reactor core, at an assembly scale, at multiple burnup steps throughout the reactor cycle. Then, fuel pin level fission neutron emission rate distributions are reconstructed from the assembly level using the three-dimensional (3-D) form factors of the pin power reconstruction of SIMULATE5 (CitationRef. 17). These are multiplicative coefficients that specify how the power of an assembly is distributed among the different pins.
In addition to its low computational time (about 8 min.cpu/burnup step), this methodology has several benefits. First, deterministic codes, such as SIMULATE5, include a module that takes into account simplified thermal-hydraulic feedbacks. Second, nuclide concentrations are automatically updated, for 16 actinides and about 40 fission products and burnable absorbers, by solving their buildup and decay chains (Bateman equations).Citation18,Citation19 Third, this methodology has the ability to model reactor core power variations and the associated control rod insertions. This may be needed for reactors operating, on average, below their nominal power.Citation12 Finally, boron concentration is automatically adjusted by SIMULATE5 to reach criticality.
The fission neutron emission rates calculated by SIMULATE5 are then used to compute the average fission neutron spectra of each fuel assembly (which correspond to the energetic distribution of fission neutrons), according to formula Equation(2)
(2)
(2) :
where for isotope i and fuel assembly m at time t,
| = | space-energy–integrated fission rate | |
| = | average number of neutrons emitted per fission | |
| = | fission spectrum ( | |
| = | energy of the emitted neutron |
In EquationEq. (2(2)
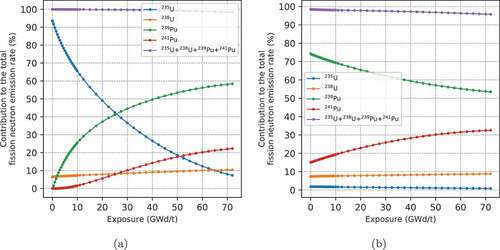
(2) ), the fission neutron spectrum of each isotope is weighted by the probability for a neutron to come from the fission of a particular isotope. Here, only 235U, 238U, 239Pu, and 241Pu are accounted for in the fission spectrum reconstruction since it was observed (in a study performed with CASMO5 on assemblies in an infinite medium) that these isotopes account for at least 98.4% and 95.8% of the total fission neutron emission rate of UOX and MOX assemblies, respectively, for exposures up to 72 GWd/ton (see ).
Fig. 1. Contribution of 235U, 238U, 239Pu, and 241Pu to the total fission neutron emission rate as a function of time in the case of (a) UOX assemblies and (b) MOX assemblies.
The fission spectrum of the above-mentioned isotopes 235U, 238U, 239Pu, and 241Pu is pre-evaluated on the basis either of a Watt spectrum [see EquationEq. (3(3)
(3) )] or a Maxwell spectrum [see EquationEq. (4
(4)
(4) )] using
and
spectrum coefficients indicated in :
TABLE I Data for Fission Neutron Spectrum Modeling
and
where
| = | energy of the emitted neutron | |
| = | spectrum coefficients indicated in (MeV, MeV−1, respectively) | |
| = | normalization constant. |
In , the 235U, 239Pu, and 241Pu coefficients are taken from the MCNP6 manual,Citation20 and the 238U coefficients are taken from CitationRef. 5 in which a PWR is considered. It has been observed that the spectrum of neutrons produced by 238U does not vary significantly between UOX and MOX assemblies. Therefore, 238U coefficients are considered as the same for both types of assemblies.
As a result, this approach induces some additional approximations, leading to the following fission neutron source term description:
where for isotope and fuel pin
within fuel assembly
at time
,
| = | space-energy–integrated fission rate over the assembly | |
| = | average number of neutrons emitted per fission | |
| = | average fission spectrum of the assembly | |
| = | energy of the emitted neutron | |
| = | form factor of the pin power reconstruction of SIMULATE5. |
With respect to EquationEq. (1(1)
(1) ), EquationEq. (5)
(5)
(5) implies that the fission neutron emission rate (
product) is integrated over all energies of incident neutrons. The dependence of fission spectrum
on the incident neutron energy was treated separately (and is therefore also considered as integrated over these energies). Moreover, spatial discretizations were introduced, and the neutron fission emission rates are considered as radially flat in each fuel pin while the same neutron fission spectrum is attributed to each fuel pin of an assembly. Furthermore, fuel pin fission neutron emission rates were reconstructed from the assembly level using the form factors from the pin power reconstruction of SIMULATE5. This implies that the average energy and the average number of neutrons emitted per fission are identical in each fuel pin of an assembly. This hypothesis is likely to have little impact for UOX fuel assemblies that are composed of only one type of fuel rod. However, since MOX fuel assemblies are composed of three types of fuel rods (with different enrichments), a greater impact of this hypothesis is expected for these assemblies. However, the impact of this assumption is expected to be small compared to other assumptions such as the diffusion approximation.
Finally, the fission neutron source term is automatically converted by a linking tool into a spatial and energetic source description for the MCNP6 (CitationRef. 21) model that performs the neutron transport from the core to the vessel. The spatial representation is treated by using 200 axial divisions in each fuel pin, with values interpolated from the 3-D fission neutron emission rate distribution evaluated by SIMULATE5. As for the energy, the fission neutron spectra of each assembly are described over 2000 energy bins distributed logarithmically between and 20 MeV. The precision of the generated fission neutron source term is discussed in Sec. II.D.1.
II.B. Transport of Source Neutrons to Sites of Interest
The second step of the methodology deals with the transport of neutrons from the core to the sites of interest (RPV, capsules, etc.) using the fission neutron distribution determined in the previous step. To carry out this step, a detailed MCNP6 PWR model was developed ().
Fig. 2. Radial cut of the MCNP6 reactor modeling with tallies indicated by black and white sections. (1) Fuel assemblies; (2) core baffle; (3) moderator bypass; (4) core barrel; (5) thermal neutron shield; (6) downcomer; (7) RPV; (8) capsules of the French surveillance program.
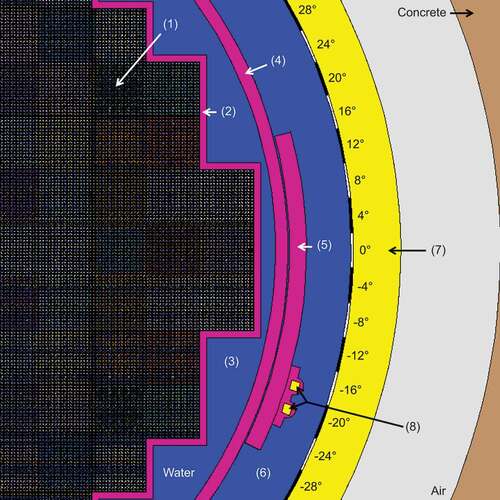
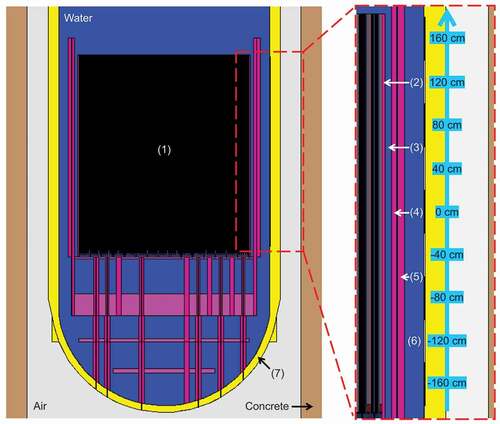
Fig. 3. Axial cut of the MCNP6 reactor modeling and axial segmentation of the considered tallies indicated by black and white sections. (1) Fuel assemblies; (2) core baffle; (3) moderator bypass; (4) core barrel; (5) thermal neutron shield; (6) downcomer; (7) RPV.
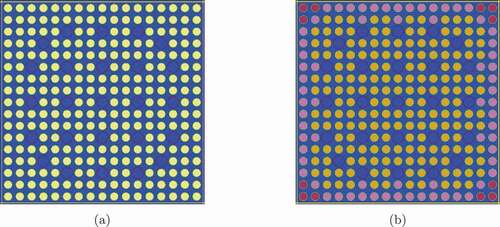
The MCNP6 model geometry and materials are representative of a French 900-MW(electric) PWR type of reactor with hybrid UOX/MOX fuel loading. The reactor core is quarter-symmetric and described at a pin level. The UOX and MOX assemblies contain 264 pins plus 24 guide tubes for control rod insertion and an additional central instrumentation tube. In the case of MOX assemblies, three zones are modeled, with higher enrichment at the center and lower enrichment at the periphery of the assemblies. A pictorial representation of the fuel pin arrangements of both types of assemblies is presented in . Fuel compositions are defined at a pin level and are representative of the beginning of the reactor cycle detailed in Sec. III.A. These are kept identical for every attenuation calculation since it was observed that fuel compositions do not significantly affect neutron transport from the core to the RPV (see Sec. II.D.2).
Fig. 4. Radial cut of the MCNP6 (a) UOX assembly and (b) MOX assembly modeling. For MOX assemblies, three different types of fuel pins are modeled with high (orange), medium (pink), and low (red) Pu content.
The fuel temperature is uniform over the entire reactor core and is set to 900 K. Similarly, the moderator temperature inside the reactor core is set to 577.75 K. This temperature corresponds to the reference reactor outlet temperature, and this approach is therefore conservative since it tends to overestimate the fast neutron flux at the RPV. In the same manner, in the absence of precise data on the temperature of the moderator in the bypass (between the baffle and the barrel), a conservative approach was chosen, and the moderator temperature was also uniformly set to the reference reactor outlet temperature (577.75 K) in this region. The potential impact of these last two assumptions on vessel aging assessments is discussed in Sec. II.D.2.
Moreover, the moderator temperature in the downcomer (between the barrel and the RPV) is set to the reference reactor core inlet temperature, equal to 558.15 K. Finally, the boron concentration in the moderator is uniform inside and outside the reactor core and is adjusted to match the critical concentration calculated by SIMULATE5 for every burnup step. These last two modeling points are considered realistic. However, analysis showed that the boron concentration is not likely to have a significant impact on the fast neutron flux and dpa rate estimates. Indeed, boron acts only as a thermal poison and thus does not affect either fast flux or epithermal neutron flux, which are the most important contributors to the dpa rate (see ). Therefore, the authors believe that this model complexity is not required in order to perform accurate aging assessments.
The geometry outside the core was modeled accurately. The core is surrounded by the baffle, the moderator bypass, the barrel, the asymmetric radiation shielding, the downcomer, and the RPV as show. The capsules used in the French surveillance program have been finely described to distinguish the two capsules located at −17 and −20 deg, as displayed in . The capsules are modeled as 1 m in height and have the same composition as the RPV steel. They are located axially at the center of the active part of the core.
MCNP6 F4 cell flux talliesCitation20 are specified at the inner wall of the RPV and inside the capsules. These tallies allow one to quantify the energy-dependent neutron flux and dpa rates [using the Norgett-Robinson-Torrens dpa (NRT-dpa) model or the Athermal Recombination Corrected dpa (ARC-dpa) model] for 111 groups of incident neutron energies with energy bounds between and 20 MeV. For the RPV, the model includes 15 azimuthal tallies that are 4 deg wide and 1 cm deep. Each of these tallies includes nine axial divisions that are 40 cm high and distributed over the active height of the core. The azimuthal and axial segmentation is represented in where tallies are indicated by black and white sections. For the capsule, the model includes one tally per capsule (located at −17 and −20 deg, respectively), and each of these tallies includes three axial divisions (each measuring 33.33 cm) distributed along the capsule’s height.
The lead factorCitation22 (also called anticipation factor) of each capsule is derived from the acquired data. Usually, this quantity is defined as the ratio between the fast neutron flux in the capsule and the fast neutron flux at the most exposed azimuthal location of the RPV. The lead factor is used to translate the irradiation sample damage into RPV damage.
Despite its original definition, an alternative formulation of the lead factor (called fast neutron lead factor in this paper) is proposed and consists of calculating the lead factor in every section of the studied azimuthal and axial range on the RPV. This choice was motivated by the interest in studying the axial and azimuthal variability of this quantity. Therefore, the fast neutron lead factor at time is defined by EquationEq. (6)
(6)
(6) :
where is the fast neutron flux in units of cm−2·s−1.
In addition to the classical fast neutron lead factor, the dpa lead factor is introduced and serves the same purpose as the fast neutron lead factor but uses the dpa observable. The dpa lead factor at time is defined by EquationEq. (7)
(7)
(7) :
where is the dpa rate in units of inverse seconds.
To improve the calculational efficiency, the weight-window variance reduction methodCitation20 is used. The weight-window parameters are optimized for 47 neutron energy bins covering the range ( MeV to 17.3 MeV). This evaluation was performed using the ADVANTG 3.0 toolCitation23 and is based on the Forward Weighted Cadis method,Citation24 which uses the DENOVO deterministic code.Citation25 One set of weight windows was generated for tallies located in the capsules, and another one was generated for those in the RPV. Therefore, neutron transport calculations are performed separately for the capsules and for the RPV.
Finally, neutrons are simulated for each MCNP6 calculation leading to a statistical uncertainty
of about 0.3% to 0.4% on fast neutron flux and dpa rate estimates. These calculations are performed using the JEFF-3.3 nuclear cross-section data library.Citation26
II.C. Displacement Damage Evaluation
Radiation damage can be estimated considering various aspects such as displacement damage induced by projectiles, stability and mobility of the defects produced, etc.Citation27 Among the aspects discussed above, particle-induced displacement damage is a versatile option that provides better understanding of radiation damage in materials. In particular, neutron-induced displacement damage constitutes a basis for comparison of the embrittlement state at the different locations in the vessel and the capsules. To perform neutron-induced displacement damage evaluations, one needs an accurate model, which is presented Sec. II.C.1.
II.C.1. Theoretical Background
Irradiation-induced displacement damage is usually quantified in terms of dpa. This quantity includes information about the material response (number of displaced atoms) and the neutron fluence (magnitude and spectrum) that the material had undergone. The dpa quantifies the number of atoms permanently displaced from their initial site to an interstitial position. Assuming that no point defects are lost to a surface or other defect sink, the dpa can be considered as an estimator of the concentration of primary damage (vacancy-interstitial pairs, also called Frenkel defects) in the material.
Various methods allow one to quantify the number of Frenkel defects generated by neutron irradiation, such as the molecular dynamics method,Citation28 the binary collision approximation (BCA) method,Citation29 etc. However, the international standard for quantifying dpa in irradiated materials is the NRT-dpa model,Citation30 which is based on BCA simulations of ion collisions in a solid. According to this model, the number of atomic displacements created by an incident ion [i.e., the primary knocked atom (PKA)] can be estimated according to the following:
where
| = | number of atomic displacements | |
| = | average threshold displacement energy | |
| = | damage energy (i.e., the kinetic energy of the incident ion available to create atomic displacements) (eV) | |
| 0.8 = | = | factor introduced to take into account the probability of instantaneous recombination of the defect due to ballistic processes. |
Once the damage energy is calculated, this model allows one to compute the number of displaced atoms by an incident ion in any material for which
is known. However, one limitation of the NRT-dpa model is its inability to take into account atomic replacements that happen after the collision cascade. This leads to significant overestimates of the total number of displaced atoms. This overestimation can be of the order of three for some metals.Citation31 Therefore, Nordlund et al. proposed the ARC-dpa model,Citation31 which provides a more realistic description of primary defect creation in materials:
with the efficiency function given by
where in the same way as for the NRT-dpa model,
| = | number of atomic displacements | |
| = | average threshold displacement energy | |
| = | damage energy (eV). |
In addition, and
are material-related constants and are given for several metals (Fe, Cu, Ni, Pd, Pt, and W) in CitationRef. 31.
The NRT-dpa and ARC-dpa formulations can be used to address the number of atoms displaced in a given volume of material. Finally, by dividing the number of displaced atoms by the total number of atoms in the same volume, one obtains dpa.
II.C.2. Displacements per Atom Calculations
The dpa rate in the vessel material at a time can be calculated as
where for an energy of incident neutron (in units of electron volt),
represents the energy-dependent neutron flux (in units of
and
represents the atomic displacement cross section (in units of
The atomic displacement cross section is determined by weighing the result of three different processesCitation27:
nuclear reaction between the incident neutron and the nucleus and the induced energy transfer from neutron to nucleus (recoil energy)
loss of the acquired energy by the nucleus due to interactions with the electrons of the system (
= recoil energy − electronic losses)
actual production of atomic displacements based on EquationEq. (8)
For instance, the NJOY nuclear data processing codeCitation32 allows one to compute atomic displacement cross sections, which can be used by Monte Carlo codes such as MCNP6 to perform dpa evaluations. In the standard version of NJOY2016, the number of atomic displacements created by an incident ion is defined asCitation33
where
| = | average threshold displacement energy | |
| = | damage energy (i.e., the kinetic energy of the incident ion available to create atomic displacements) (eV). |
In the HEATR module of NJOY, the damage energy is calculated as
if the recoil energy of the PKA is greater than
and 0 otherwise. Terms appearing in EquationEq. (13)
(13)
(13) are defined in CitationRef. 33.
EquationEquations (12)(12)
(12) and (Equation13
(13)
(13) ) induce that the LEGACY-NJOY model is not consistent with the NRT-dpa model in the region where
. In the present study, the NRT-dpa model and the ARC-dpa model have been implemented in NJOY2016. This matter is discussed in detail in Sec. II.C.3.
II.C.3. Implementation of NRT-dpa and ARC-dpa Models in NJOY2016
The HEATR module of NJOY2016 (CitationRef. 32) has been updated in order to implement the NRT-dpa and the ARC-dpa models as specified in EquationEqs. (8)(8)
(8) and (Equation9
(9)
(9) ). Similar work was performed by the Karlsruhe Institute of TechnologyCitation34–36 (KIT) in NJOY2012. In order to validate the developments, the authors compared the dpa rates obtained with the developments carried out in this paper to those obtained using the cross sections generated by KIT (CitationRef. 36) (with the NRT-dpa and the ARC-dpa models). A good agreement was observed between the two developments. However, it was found out that
is very sensitive to
,
and
. Literature suggests that these constants vary depending on the molecular modeling simulations. For instance, in CitationRef. 31,
for Cu is equal to 30 eV whereas in CitationRef. 35, 33 eV is indicated. This difference in
leads to a difference of 9% on the NRT-dpa estimates. Therefore, careful estimations of these parameters is needed.
It is important to demonstrate at this point the differences that one may encounter in the damage cross sections based on the NRT-dpa model or the ARC-dpa model. compares the NRT-dpa model and the ARC-dpa model in the displacement cross section evaluations of 56Fe processed at 300 K from the JEFF-3.3 nuclear data library. As can be seen in , the relative differences between the NRT-dpa model and the ARC-dpa model are significant, especially for incident energies of neutrons above 104 eV. These neutrons contribute a minimum of 97% of the generated displacements in the RPV (see ). Therefore, a large reduction of the dpa estimates is expected using the ARC-dpa model compared to the NRT-dpa model.
Fig. 5. Atomic displacement cross section of 56Fe processed at 300 K from the JEFF-3.3 nuclear data library and comparison between the NRT-dpa model and the ARC-dpa model.
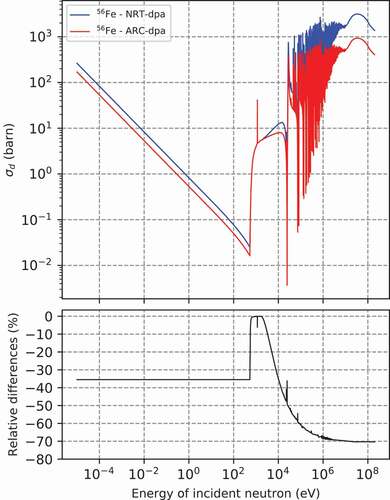
Based on the observed differences mentioned above, it was important to quantify the impact on the dpa rates of using the NRT-dpa model or the ARC-dpa model. To perform this test, a benchmark was set up that consisted of a sphere having natural material (Fe, Cu, or Ni). The radius of this sphere was equal to the thickness of the vessel (20 cm), and the calculations were performed imposing an emission spectrum representative of the neutron spectrum that the RPV undergoes. The dpa rates in this sphere of natural material were calculated using the NRT-dpa and the ARC-dpa models. A significant decrease in dpa rates was observed when switching from the NRT-dpa model to the ARC-dpa model, induced by the consideration of recombination processes. This decrease is of the order of a factor of 3 for Fe, 5 for Cu, and 4 for Ni. Since Fe is the principal material used in RPVs, the decrease in dpa estimates in the RPV when switching from the NRT-dpa model to the ARC-dpa model is expected to be a factor of about 3.
As mentioned before, the ARC-dpa model acts as a correction to the NRT-dpa model. However, it is worth mentioning here that the accuracy of this correction is contingent upon the estimated parameters (,
and
).
II.C.4. Atomic Displacement Cross Section Generated for the Present Work
In the present work, the atomic displacement cross sections were computed at 300 K and 600 K from the JEFF-3.3 nuclear data library using the NRT-dpa model [see EquationEq. (8
(8)
(8) )] and the ARC-dpa model [see EquationEq. (9)
(9)
(9) ]. However, the
generation was limited to stable isotopes of Fe (54Fe, 56Fe, 57Fe, and 58Fe), Cu (63Cu and 65Cu), and Ni (58Ni, 60Ni, 61Ni, 62Ni, and 64Ni). This choice was motivated by a lack of available data regarding the
and
constants of the other nuclides composing the RPV steel (see ). The stable isotopes of Fe, Cu, and Ni account for 96.7% of the RPV nuclides, and the potential bias induced by this modeling approximation of the dpa rate estimates is discussed in Sec. II.D.3.
TABLE II Composition of RPV Steel*
The values of the material constants (,
and
) used in the
generation are specified in . Although the material constants specified in were evaluated for natural materials, these were kept identical to compute the
of all the isotopes of a given material. This assumption was made to model the RPV steel composition as accurately as possible considering the available data in the literature. In the present scope, the above hypothesis has no impact on the objectives and results of this work since dpa are currently of interest only in relative terms. Precise estimation of
,
and
is a matter for further studies.
TABLE III Material Constants*
II.D. Accuracy of the Methodology
The biases induced by the assumptions made at the different stages of the calculation (see Secs. II.A, II.B, and II.C) on the neutron flux or dpa estimates were assessed in specific studies.
II.D.1. Accuracy of the Fission Neutron Source Term
In order to assess the accuracy of the fission neutron source term evaluation (see Sec. II.A), a comparison to a full Monte Carlo methodology is proposed. However, in order to have a more detailed analysis of the origins of potential biases, the accuracy of the spatial and energetic dependencies of the fission neutron source term was analyzed in two separate studies.
First, the accuracy of the spatial description of the fission neutron source term was estimated. To do so, the 2-D fuel pin fission neutron emission rate distribution computed by the developed methodology (using SIMULATE5) was compared to one obtained by averaging the results of 70 MCNP6 criticality source calculationsCitation20 with different random seeds. This study was carried out on a “zero power state” with fresh fuel where the Monte Carlo methodology is expected to be more precise. Therefore, the Monte Carlo methodology is considered there to be the reference. For the full Monte Carlo methodology, the 1
uncertainty of the fission neutron emission rate of each fuel pin is about
1% to 3% based on the analysis of the variance of the independent calculations. presents assembly and pin level fission neutron emission rates relative differences between the developed methodology and the reference one in the case of a French 900-MW(electric) reactor loaded with UOX and MOX fresh assemblies.
Fig. 6. Relative fission neutron emission rate distribution differences (%) between the developed and the reference methodologies at (a) fuel assembly level and at (b) fuel pin level .
According to , differences (up to about 3% at the assembly scale) between the fission neutron emission rate distributions predicted by SIMULATE5 and MCNP6 are observed and are most likely induced by the diffusion approximation. These differences are up to 10% at the pin scale, which is significant considering the uncertainties of the Monte Carlo methodology on the fission neutron emission rate fuel pins. However, the full Monte Carlo methodology requires about 500 000 times more computational time in order to evaluate the fission neutron source term. It was also observed that these differences in fission neutron emission rates do not induce a significant variation in the fission spectra of the assemblies.
The source term deviations (spatial and energetic) were propagated to the evaluation of the fast neutron flux and dpa rate at the vessel, and results are presented in . The results show that the developed methodology induces a maximal bias between −2% and +2% with regard to the Monte Carlo methodology, depending on the azimuthal position considered on the vessel. The observed biases are of the same order of magnitude for the fast neutron flux and dpa rate estimates. These bias are not expected to increase for other PWR configurations since the study case was chosen to maximize flux discontinuities. The evaluated biases are therefore considered to be conservative.
Fig. 7. (a) Fast neutron flux and (b) ARC-dpa axially integrated azimuthal distributions and relative differences between using the SIMULATE5 and MCNP6 fission neutron source terms.
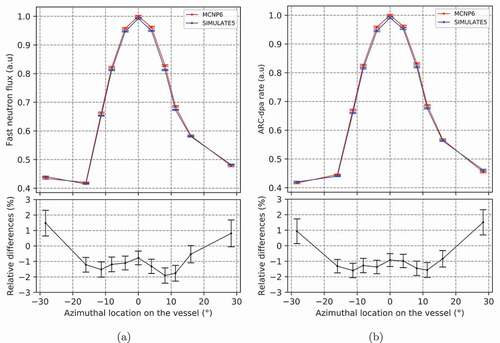
The authors consider the evaluated bias range to be acceptable given the global uncertainty of fast neutron fluence estimations (which is about 10% to 20% according to CitationRefs. 8, Citation9, and Citation10). Furthermore, the versatility of SIMULATE5 (modeling of thermohydraulic feedbacks, possibility to take into account the power history of the reactor and the associated control rod insertions, etc.) and its low computational cost (about 500 000 times lower than the MCNP6 reference methodology) makes it a suitable methodology for vessel aging assessments.
A separate study, detailed in CitationRef. 38, was performed in order to test the accuracy of the fission neutron spectrum modeling considering a French PWR with UOX/MOX loading. This study consisted of comparing the neutron flux responses in the RPV obtained by using the fission spectrum modeling (see Sec. II.A) and those obtained by means of an eigenvalue Monte Carlo calculation. The eigenvalue Monte Carlo calculations are considered here as reference. The observed discrepancies in the neutron flux responses between the two methodologies were mostly contained within the 2σ statistical uncertainty of the calculated relative differences (
). Therefore, the authors believe that this fission spectrum modeling does not induce any significant bias in the neutron flux estimates.
Finally, the modeling approximations of the methodology developed to compute the fission neutron source term (see Sec. II.A) induce a maximum bias of about 2%. In first instance, the uncertainty/bias induced in the dpa rate estimates is considered to be of the same order of magnitude. As a result, the authors consider that the precision of the generated fission neutron source term is sufficiently accurate given the other sources of uncertainty.
II.D.2. Accuracy of the Attenuation Modeling
This section aims at quantifying the potential bias induced by the modeling approximations performed in the MCNP6 neutron attenuation model (see Sec. II.B).
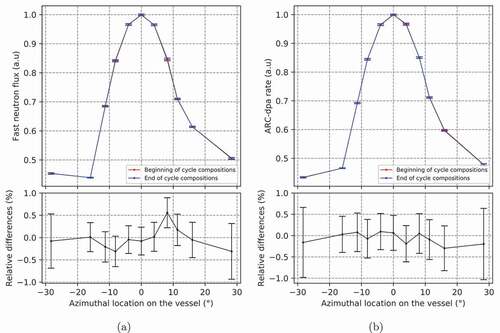
First, the specified fuel compositions in the MCNP6 model are representative of the beginning of an equilibrium cycle and are kept identical for every attenuation calculation. In order to test this hypothesis, the authors performed the same MCNP6 fixed source calculation twice (using the same fission neutron source term), one time using beginning-of-cycle compositions and the other time using end-of-cycle compositions. The evaluated 2-D azimuthal distributions of fast neutron flux and dpa rates at the RPV are presented in . The observed differences of the fast neutron flux and dpa estimates between the two cases are mostly contained in the 1
uncertainty of the calculated relative differences (
). Therefore, the hypothesis of keeping the fuel compositions identical in the MCNP6 model for every attenuation calculation within a cycle is considered as not inducing any significant bias on the fast neutron flux and dpa estimates.
Fig. 8. (a) Fast neutron flux and (b) ARC-dpa axially integrated azimuthal distributions and relative differences between the use of beginning-of-cycle and end-of-cycle fuel compositions in the MCNP6 fixed source calculation.
Second, the axial moderator density gradients that exist in the reactor core (see ) were not taken into account in the MCNP6 model. Instead, the moderator temperature was uniformly set to the reference core outlet temperature (577.75 K) inside the reactor core. To assess the potential impact of this hypothesis on the fast neutron flux estimates at the RPV, the sensitivity coefficients provided in CitationRefs. 5 and Citation10 were used in conjunction with the temperature gradients calculated by SIMULATE5. According to this analysis, this assumption may lead to an overestimation between 2% and 3% of the fast neutron flux at the vessel, depending on the axial location on the RPV.
Third, in the absence of precise data on the axial variation of the temperature of the moderator in the bypass (between the baffle and the barrel; see ), the moderator temperature was also uniformly set to the reference core outlet temperature (577.75 K) in this region. The most penalizing option for assessing the potential bias of this hypothesis is that there is no moderator heating in this region of the reactor since this case maximizes the moderating density difference between the developed model and reality. Considering this option in conjunction with the sensitivity coefficients of CitationRef. 10, this hypothesis induces an additional overestimation of the fast neutron flux at the RPV, about +8%.
In the end, the current MCNP6 model used to perform neutron attenuation calculations could induce a maximum overestimation between [+10%; +11%] of the fast neutron fluence at the RPV (and of the dpa rate estimates, as a first approach). This bias is induced exclusively by the absence of modeling of the moderating density gradient. However, these modeling approximations result from conservative choices that were made by the authors in order to enhance safety. Nonetheless, future works will aim at improving the MCNP6 model in order to improve the best-estimate capabilities of the calculation scheme.
II.D.3. Accuracy of the Atomic Displacement Cross-Section Modeling
As explained in Sec. II.C, only the natural isotopes of Fe, Cu, and Ni are considered in dpa assessments while using the NRT-dpa and the ARC-dpa models because of a lack of available data in the literature of ,
and
for the remaining nuclides. The natural isotopes of Fe, Cu, and Ni represent 96.7% of the nuclides composing the RPV steel. At this point, it is necessary to quantify the amount of dpa that one would miss by not taking into account the remaining nuclides. To do so, an analysis was performed in which two dpa evaluations were carried out for the reactor cycle considered in Sec. III.A: one using a detailed description of the RPV material and another using a simplified composition considering only the natural isotopes of Fe, Cu, and Ni. Such work is possible only using the LEGACY-NJOY dpa model [see EquationEq. (12)
(12)
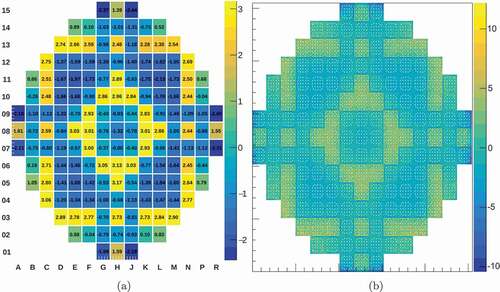
(12) ]. The results are presented for the whole studied axial/azimuthal range on the RPV in .
Fig. 9. Relative differences (%) in the cycle-averaged dpa rate distribution on the RPV between the use of a detailed vessel material and the use of a simplified vessel material .
As can be seen in , the isotopes of Fe, Cu, and Ni account for between 99.1% and 99.6% of the generated dpa in the RPV. The same study was conducted for the capsules, and it was observed that the isotopes of these three materials account for approximately of 98.5% of the generated dpa in the steel samples. As a reminder, the 1
statistical uncertainty the evaluated dpa rates is about 0.3% to 0.4%. Therefore, the maximum observed differences are of the order of the
3
uncertainty for the RPV and a little above for the capsules. Considering these differences as significant enough, the use of the simplified vessel steel composition leads to a maximum underestimation of about 0.9% of the dpa rate in the vessel and of approximately 1.5% in the steel samples of the capsules, which is fairly low.
II.D.4. Summary of Evaluated Biases
The biases associated with the modeling approximation of the developed methodology are evaluated in the Secs. II.D.1, II.D.2, and II.D.3. summarizes the quantified bias range of the fast neutron flux and the dpa rate
at the RPV induced by the modeling approximations at each step of the methodology.
TABLE IV Summary of Methodological Biases on RPV Aging Estimates
In the end, it is possible to notice that the great majority of the quantified methodological biases come from the modeling of the moderator density in the MCNP6 attenuation calculation. However, as explained previously (see Sec. II.D.2), this modeling consisted of a conservative approach that was chosen in order to enhance safety. Nonetheless, future works could be performed to refine the moderator density gradient in the MCNP6 model in order to improve the best-estimate capabilities of the calculation scheme.
It is not the intention of the present paper to fully explore the impact of uncertainty in the results. Rather, efforts have been made to determine and understand some of the biases in connection with the proposed methodology. A detailed estimation of the bias and uncertainty for RPV aging estimations performed with the developed methodology is a matter for future work.
II.E. Computational Efficiency
In Secs. II.A, II.B, II.C and II.D the developed methodology and its accuracy were detailed. Another important point of such a methodology is the amount of computational power needed to perform the calculations. Therefore, this section aims at highlighting the computational efficiency of the two steps of the methodology.
On one hand, evaluation of the neutron fission source term (the first step of the methodology; see Sec. II.A) is performed by the SIMULATE5 code and requires, on average, 8 min·cpu/burnup step. On the other hand, the transport of the source neutrons to the RPV or the capsules (the second step of the methodology; see Sec. II.B) is performed by means of a fixed source MCNP6 calculation and requires, despite the use of a variance reduction method, about 1 050 000 min·cpu.
Up to this point in the paper, only static calculations have been discussed whereas the aging quantities (vessel fluence, dpa) are time-integrated quantities. The numbers in the previous paragraph show that in order to improve the calculational efficiency of the methodology, it is of great importance to limit the number of MCNP6 neutron transport calculations per reactor cycle to what is strictly necessary to achieve sufficiently accurate time-integrated data.
III. TIME INTEGRATION OF AGING VARIABLES
In order to perform RPV aging assessments, the quantities of interest are those integrated over time. In order to reduce the computational time, it is required to limit the number of MCNP6 attenuation calculations per cycle to what is strictly necessary to achieve sufficiently accurate time-integrated data (see Sec. III). Therefore, this section features the studies that were conducted by the authors to assess the best time-integration method. However, before presenting these studies, it seems important to highlight the reactor cycle on which they were conducted and to detail how the aging quantities (fast neutron flux, dpa rates) evolve during this cycle.
III.A. Considered Reactor Cycle
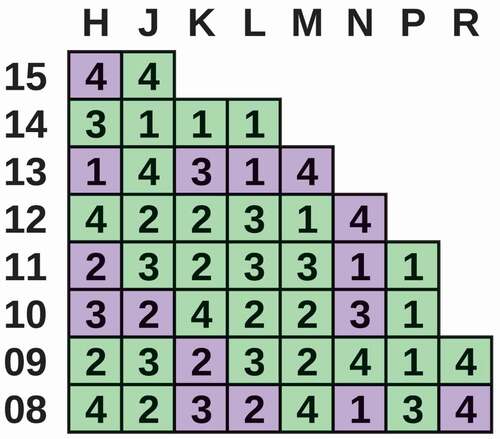
The reactor core geometry has been presented in . In addition, the quarter-symmetric fuel loading is presented in .
Fig. 10. Number of irradiation cycles of each fuel assembly for the considered fuel loading (UOX assemblies are indicated in green, and MOX assemblies are indicated in purple). For symmetry reasons, only a quarter of the core is represented.
In the current study, the reactor operates at nominal power, with all the control rods fully withdrawn. Fission neutron source terms were generated for the following burnup steps along the cycle: 0, 0.05, 0.1, 0.15, 0.2, 0.25, 0.5, 1, 1.5, 2, 2.5, 3, 3.5, 4, 4.5, 5, 5.5, 6, 6.5, 7, 7.5, 8, 8.5, 9, 9.5, 10, 10.5, and 11 GWd/ton.
III.A.1. Aging Accumulation During the Cycle
A first study was carried out to analyze how the fast neutron flux and dpa rate evolve during the considered reactor cycle. presents this evolution for the fast neutron flux.
Fig. 11. Evolution along the cycle of (a) the azimuthal fast neutron flux distribution on the RPV (axially integrated) and (b) the axial distribution for azimuthal position 0 deg on the RPV.
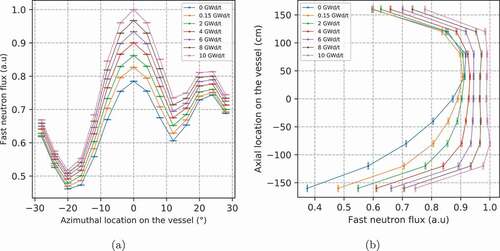
shows that the fast neutron fluence is not accumulated linearly over the reactor cycle since the fast neutron flux incident on the RPV increases with fuel exposure. This behavior is induced by the fact that the power distribution inside the reactor core flattens out as fuel burnup increases, leading to an increase of the relative power of the assemblies located at the border of the core. However, it is interesting to note that the azimuthal distribution of the fast neutron flux on the vessel does not vary significantly during the cycle. Moreover, the axial shape of the fast neutron flux, initially peaked toward the top of the core (due to the initial axial distribution of burnup in border assemblies) flattens as the cycle progresses. This evolution occurs first as a result of the 135Xe transient and then under the effect of fuel depletion. Similar behavior as that described in was observed for NRT-dpa and ARC-dpa rates.
From the above discussion, one may conclude that performing an accurate time integration with reasonable computational time is not straightforward. Indeed, strong fast neutron flux (or dpa rate) variations during the cycle imply the need for a very accurate time integration. Therefore, a large number of attenuation calculations may be required in order to compute sufficiently accurate time-integrated data. However, as highlighted in Sec. II.E, in order to improve the computational efficiency of the methodology, it is important to limit the number of MCNP6 attenuation calculations per cycle to the minimum amount that is required to perform accurate time integration. Therefore, a study has been conducted to assess the required number of neutron transport calculations per cycle.
III.A.2. Number of Neutron Transport Calculations per Active Cycle
A study was conducted to assess if a single MCNP6 attenuation calculation per cycle, using a cycle-averaged fission neutron source term, is sufficient to compute accurate time-integrated data. In this instance, two different time-integration methodologies are compared:
Method 1: The first method consists of performing MCNP6 neutron transport calculations for the following burnup steps: 0, 0.15, 2, 4, 6, 8, 10, and 11 GWd/ton.
Method 2: The second method consists of computing a cycle-averaged neutron source term (based on the energy-spatial distributions of fission neutron sources of the burnup steps used in method 1) and performing a single neutron transport calculation, representative of the whole reactor cycle.
In both cases, the time integration was performed according to EquationEq. (14(14)
(14) ), which indicates that quantities (fission neutron source term, fast neutron flux, dpa rate, etc.) are considered constant between two burnup steps:
where for burnup step and total number of burnup steps
,
is the quantity to be integrated and
is the reactor core exposure. EquationEquation (14)
(14)
(14) means that the
quantity computed at the final burnup step
is not used in the time-integration process. In the current study
corresponds to 11 GWd/ton.
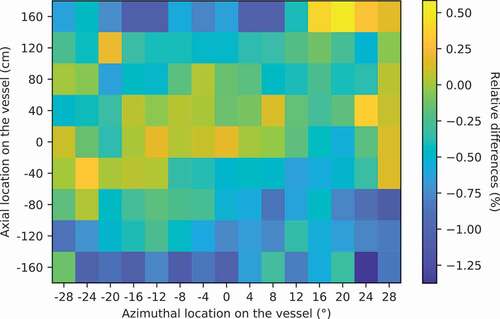
Method 1 is much more time-consuming than method 2, but it is also more precise. Therefore, method 1 will be used in this study as a reference to evaluate the accuracy of method 2, which is much faster. presents the relative differences between these two methods of the cycle-averaged ARC-dpa distribution on the RPV.
Fig. 12. Relative differences (%) in the cycle-averaged ARC-dpa rate distribution on the RPV between integration methods 1 and 2 .
The results show that method 2 accurately reproduces the cycle-averaged ARC-dpa distribution computed by method 1, with differences mostly inferior to the 2
uncertainty of the calculated relative differences (
~ 0.3% to 0.4%; see Sec. II.B). Similar behavior has been observed for the cycle-averaged NRT-dpa and fast neutron flux distributions. Therefore, performing a single neutron transport calculation per cycle using a fission neutron source term representative of the average cycle conditions is sufficient to accurately evaluate cycle-integrated data.
The use of EquationEq. (14)(14)
(14) implies that the fission neutron source term (and therefore the fast neutron flux and dpa rates) is constant between two burnup steps. However, shows that the fast neutron flux (and thus the dpa rates) varies significantly from one burnup step to another. Therefore, the temporal mesh used in SIMULATE5 to calculate the cycle-averaged fission neutron source term is likely to have a significant impact on the neutron flux and dpa estimates.
III.A.3. Impact of the SIMULATE5 Temporal Mesh on the Aging Estimates
In order to assess the potential impact of the temporal mesh used in SIMULATE5 to calculate the cycle-averaged fission neutron source term, the authors performed a dedicated study. In this study, three SIMULATE5 temporal meshes are compared:
mesh a: 0, 0.05, 0.1, 0.15, 0.2, 0.25, 0.5, 1, 1.5, 2, 2.5, 3, 3.5, 4, 4.5, 5, 5.5, 6, 6.5, 7, 7.5, 8, 8.5, 9, 9.5, 10, 10.5, and 11 GWd/ton
mesh b: 0, 0.05, 0.1, 0.15, 0.5, 1, 2, 3, 4, 5, 6, 7, 8, 9, 10, and 11 GWd/ton
mesh c: 0, 0.15, 2, 4, 6, 8, 10, and 11 GWd/ton.
For all these meshes, the time integration is performed according to EquationEq. (14)(14)
(14) . Mesh a is expected to be the most accurate of the three meshes indicated above (and also the most time-consuming). Therefore, mesh a will be used in this study as a reference to evaluate the accuracy of meshes b and c. presents the relative differences obtained between mesh a and mesh b on the cycle-averaged ARC-dpa distribution on the RPV.
Fig. 13. Relative differences (%) in the cycle-averaged ARC-dpa distribution on the RPV between the temporal mesh a and the temporal mesh b .
The results showed that mesh b induces a significant bias in the estimation of the cycle-integrated ARC-dpa distributions compared to mesh a. These differences are mostly located at the bottom of the RPV where the bias reaches values up to about −1.3%. This behavior is observed because the axial distribution of the ARC-dpa rate is peaked on the top of the RPV at the beginning of the reactor cycle and flattens out as fuel exposure increases. In the same manner, presents the relative differences obtained between mesh a and mesh b on the cycle-averaged ARC-dpa distribution on the RPV.
Fig. 14. Relative differences (%) in the cycle-averaged ARC-dpa distribution on the RPV between the temporal mesh a and the temporal mesh c .
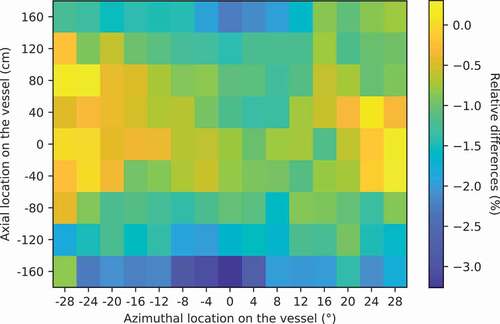
shows that mesh c induces an even greater bias than mesh b with regard to mesh a (about −3% at the bottom of the RPV). Consequently, the authors believe that special care must be paid to the temporal mesh chosen to calculate the average fission neutron source term. Indeed, this temporal mesh has to be fine enough in order not to bias the evaluated integrated quantities.
As a result, the authors recommend the use of refined temporal meshes (about 30 burnup steps or more) in order to perform accurate RPV aging studies. In the case of the methodology discussed here, computing the source term with fine time discretization over a cycle is not a concern since the computational cost of the SIMULATE5 calculations is fairly low (about 240 min·cpu for 30 burnup steps). However, in the case of a full Monte Carlo methodology such as the one considered as reference in Sec. II.D.1, the computational cost of such a temporal mesh would be prohibitive (about min·cpu).
In the end, temporal mesh a was used in a study that aimed at discussing the use of the fast neutron fluence with regard to dpa for aging assessments.
IV. VALIDITY OF THE FAST NEUTRON FLUENCE WITH RESPECT TO dpa
Now that the developed methodology has been presented and discussed, this section aims to highlight an example of study that can be conducted using this methodology.
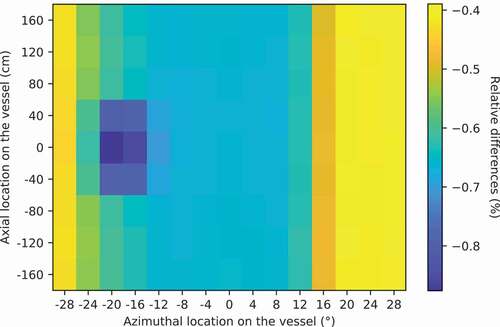
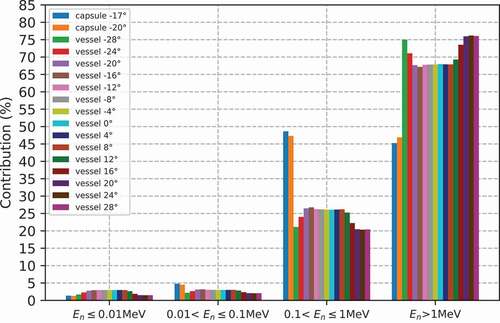
As explained previously, most surveillance programs are based on the establishment of an empirical correlation between the fast neutron fluence and the structural integrity of the vessel. This correlation is derived from experimental data obtained from measurements on irradiated capsules, containing dosimeters and vessel material samples. Since these capsules are closer to the reactor core than the RPV, the vessel steel samples placed inside undergo accelerated aging with respect to the RPV. However, the neutron spectrum incident on these capsules largely differs from the one at the RPV, inducing large ARC-dpa spectrum discrepancies between the capsules and the RPV (see ). Moreover, the ARC-dpa spectrum at the RPV varies significantly as a function of the location position on the vessel (see ).
Fig. 15. Contributions of neutron energies to the cycle-averaged, axially integrated, ARC-dpa rate in the capsules and at several azimuthal locations in the RPV, for the reactor cycle described in Sec. III.A.
As a consequence, for the same accumulated fast neutron fluence, the total amount of dpa produced in the steel samples of the capsules may differ significantly from that in the RPV material. Henceforth, as reactors are aging, the representativeness of the irradiation damage created in the capsules with respect to the RPV, for the same measured fast neutron irradiation, can be questioned. This type of issue is a good example of research that can be addressed using the developed methodology. Therefore, this study proposes to assess if the use of the fast neutron fluence is an accurate approach with respect to ARC-dpa, which is more representative of irradiation damage since it considers the damage induced by the whole neutron spectrum. In order to answer this matter, the authors introduced the relative dpa per fast neutron factor of the capsules , which is defined as
where is the fast neutron flux (
) and
is the dpa rate (
).
According to EquationEq. (15(15)
(15) ), the new
is an indicator comparing, for the same accumulated fast neutron irradiation, the amount of dpa generated in the capsules and in the vessel. As an example,
equal to 1.2 indicates that for the same measured fast neutron fluence, 20% more dpa was generated in the capsules than in the RPV.
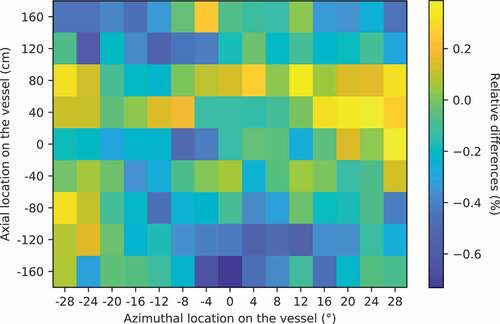
The study was carried out for the reactor cycle described in Sec. III.A. The corresponding cycle-averaged distribution of on the RPV is presented in .
Fig. 16. Cycle-averaged distribution on the vessel for the reactor cycle described in Sec. III.A.
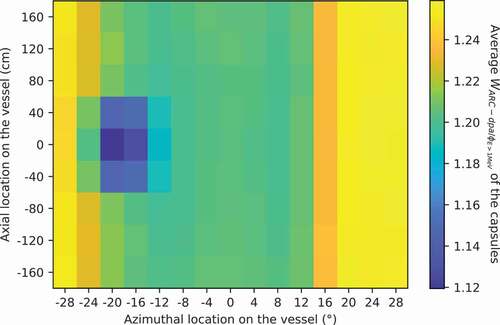
shows that for the same accumulated fast neutron irradiation, between 12% and 26% more dpa are generated in the capsules than in the RPV. The cycle-averaged mainly varies as a function of the azimuthal position on the vessel. However, a local decrease in the value of this factor is observed in the axial-azimuthal region were the capsules and the structures that support them are located (azimuthal positions between −16 and −20 deg and axial positions between −50 and +50 cm). This decrease is of the order of 8% compared to values of
at the same azimuthal position but at a different axial position. Therefore, the presence of the caspules and their support structures modifies the neutron spectrum incident on the vessel and thus induces a variation of the amount of dpa generated per measured fast neutron.
As explained above, the data acquired on the capsules are used in the surveillance programs in order to derive an empirical correlation between fast neutron irradiation and embrittlement of RPV steel. However, the obtained results show that for the same measured fast neutron fluence, more irradiation damage is created in the capsules than in the RPV. Therefore, relying on the capsule steel sample data to predict vessel aging under irradiation means that the prediction is likely to overestimate the embrittlement of the RPV relative to its true embrittled state. As a result, the use of fast neutron fluence is an approach that, although less accurate, is conservative (from the safety point of view) compared to dpa. However, the use of the fast neutron fluence to quantify the aging of the RPV is not equally conservative everywhere on the RPV. Indeed, the factor varies up to 12.5% as a function of the position on the RPV, as observed in . For instance, this variability induces that the fast neutron fluence approach is more conservative for azimuthal position 28 deg than for azimuthal position 0 deg.
A limitation to this study could have been that the calculated factors could be biased by model approximations. Most of the bias on the fast neutron flux and dpa rate estimates is induced by the perfectible modeling of the moderator density gradient in the MCNP6 attenuation calculation (see ). However, fast neutron flux and dpa rate estimates in the RPV are likely to be biased the same way by this modeling. The authors believe that this hypothesis is also valid for the capsules. Therefore, the values of
should not be overly impacted by the assumptions performed in the modeling of the moderator density gradient.
Another limitation of this study is that the dpa are only an indicator of primary radiation damage induced by neutrons. This means that many other aspects of radiation damage (damage induced by other projectiles, stability and mobility of the defects produced, etc.) were left out. Moreover, the performed study was limited to the comparison of the total damage induced by neutrons without considering the speed of irradiation or other types of particles. Taking into account all these other processes could lead to significantly different results. However, this was well beyond the scope of the present study.
V. CONCLUSION
The issues related to possible extensions of operation of nuclear power plants are becoming more and more challenging. Such concerns require in-depth analysis of the parameters that may influence vessel aging (fuel management variability, core power history, etc.). In addition, the ability of surveillance programs to accurately quantify the aging of the RPV needs to be verified for each position on the vessel. This question is relevant since reactor configurations and managements may vary as reactors are getting closer to the safety limit. For these reasons, it is necessary to have precise, accurate, and flexible tools.
This paper presented a two-step methodology that was developed to address these needs. The calculation scheme couples a deterministic approach (CASMO5 and SIMULATE5 codes) to evaluate the full-core fission neutron source term and Monte Carlo modeling (MCNP6 code) to perform the neutron attenuation from the core to the vessel and the capsules of surveillance programs. This methodology allows one to evaluate fast neutron fluence, dpa (using either the NRT-dpa or the ARC-dpa models), and lead factors of the capsules as well as neutron and dpa spectra for a wide azimuthal and axial range on the RPV. Another aspect was to generate all these parameters within reasonable computational time.
Moreover, studies aiming at evaluating the biases induced by the assumptions made within the methodology were featured. The results showed that the adopted conservative modeling of the moderator density gradient in the MCNP6 model may induce the majority of the biases on the estimates of the quantities of interest. Therefore, future works will aim at improving this model in order to improve the best-estimate capabilities of the calculation scheme.
Then, the best methodology to compute cycle-integrated data (fast neutron fluence, dpa) was assessed. The results showed that only one attenuation calculation is required per cycle in order to compute accurate time-integrated data. However, the authors found that the temporal mesh used to compute the cycle-averaged fission neutron source term must be fine enough (about 30 burnup steps or more) in order to not bias the computed fast neutron fluence and dpa estimates.
Finally, this paper highlighted an example of a research question that can be adressed using the methodology. In this study the authors discussed the validity of using the fast neutron fluence in surveillance programs. To do so, the amount of dpa generated in the capsule steel samples of surveillance programs was compared to the amount generated in the vessel, for the same accumulated fast neutron irradiation. The results showed that for the same measured fast neutron fluence, between 16% and 26% additional dpa are generated in the steel samples compared to the RPV. Therefore, relying on the steel sample data to predict vessel aging under irradiation means that the prediction may overestimate the embrittlement of the RPV with respect to its true embrittled state. However, there is no existing formula that links the total amount of dpa generated to the degradation of the mechanical properties of the RPV. Establishing a formula linking dpa and RPV steel embrittlement is a state-of-the-art research question. Therefore, scientific projects such as ENTENTEFootnotea have been created to address this matter.
Further studies may use the ability of the methodology to compute fast neutron fluence and dpa over a wide axial and azimuthal range to explore reactor core cycles that differ from the considered one (various fuel managements, reactors operating in load-following mode, insertion of hafnium rods in assemblies at the periphery of the core, etc.). Moreover, other timescales such as the entire lifetime of nuclear PWRs could be considered.
Acknowledgments
The authors would like to thank P. C. Camprini and K. W. Burn from ENEA (Italian National Agency for New Technologies, Energy and Sustainable Economic Development) for their help in the development of a customized version of MCNP6 to take into account assembly-scale fission spectra. In addition, the authors also thank S. P. Simakov and A. Yu. Konobeyev from the KIT for fruitful discussions related to the the NRT-dpa model and ARC-dpa model.
Notes
a ENTENTE: European Database for Multiscale Modelling of Radiation Damage project website: https://snetp.eu/portfolio-items/entente/.
References
- C. PICHON et al., “Neutron Spectrum Effect and Damage Analysis on Pressure Vessel Steel Irradiation Behaviour,” Proc. 19th Int. Symp. Effects of Radiation on Materials, p. 87, M. HAMILTON et al., Eds., ASTM International (2000); https://doi.org/https://doi.org/10.1520/STP12384S.
- “Integrity of Reactor Pressure Vessels in Nuclear Power Plants: Assessment of Irradiation Embrittlement Effects in Reactor Pressure Vessel Steels,” Nuclear Energy Series, NP-T-3.11, International Atomic Energy Agency (2009).
- M. TOMIMATSU et al., “Embrittlement of Reactor Pressure Vessels (RPVs) in Pressurized Water Reactors (PWRs),” Woodhead Publishing Series in Energy, p. 57, N. SONEDA, Ed., Woodhead Publishing; https://doi.org/https://doi.org/10.1533/9780857096470.2.57.
- J. C. WAGNER, A. HAGHIGHAT, and B. G. PETROVIC, “Monte Carlo Transport Calculations and Analysis for Reactor Pressure Vessel Neutron Fluence,” Nucl. Technol., 114, 3, 373 (1996); https://doi.org/https://doi.org/10.13182/NT96-A35241.
- A. VASILIEV et al., “Development of a CASMO-4/SIMULATE-3/MCNPX Calculation Scheme for PWR Fast Neutron Fluence Analysis and Validation Against RPV Scraping Test Data,” Ann. Nucl. Energy, 34, 8, 615 (2007); https://doi.org/https://doi.org/10.1016/j.anucene.2007.02.020.
- K. MATSUSHITA and M. KUROSAWA, “Neutron Fluence Analyses Around the Reactor Pressure Vessel of BWR Using MCNP with a Heterogeneous and Homogeneous Mixed Core Model,” Prog. Nucl. Sci. Technol., 4, 463 (2014); https://doi.org/https://doi.org/10.15669/pnst.4.463.
- S. BOURGANEL, O. PETIT, and C. DIOP, “Three-Dimensional Particle Transport Using Greens Functions in TRIPOLI-4 Monte Carlo Code: Application to PWR Neutron Fluence and Ex-Core Response Studies,” Nucl. Technol., 184, 1, 29 (2013); https://doi.org/https://doi.org/10.13182/NT13-A19866.
- E. LIPPINCOTT, “Assessment of Uncertainty in Reactor Vessel Fluence Determination,” STP1228, Reactor Dosimetry, p. 85, H. FARRAR et al., Eds., ASTM International, West Conshohocken, Pennsylvania (1994); https://doi.org/https://doi.org/10.1520/STP15100S.
- L. BERGE, “Contribution to the Prompt Fission Neutron Spectrum Modeling. Uncertainty Propagation on a Vessel Fluence Calculation,” Thesis, Université Grenoble Alpes (2015); https://tel.archives-ouvertes.fr/tel-01224477 (current as of May 28, 2021).
- A. DUPRE et al., “Towards Modeling and Validation Enhancements of the PSI MCNPX Fast Neutron Fluence Computational Scheme Based on Recent PWR Experimental Data,” Ann. Nucl. Energy, 85, 820 (2015); https://doi.org/https://doi.org/10.1016/j.anucene.2015.06.040.
- L. CLOUVEL et al., “Shapley and Johnson Values for Sensitivity Analysis of PWR Power Distribution in Fast Flux Calculation,” Proc. Int. Conf. Mathematics and Computational Methods Applied to Nuclear Science and Engineering (M&C 2019), Portland, Oregon, August 25–29, 2019, American Nuclear Society (2019).
- R. VUIART, M. BROVCHENKO, and J. TAFOREAU, “Impact of Core Power Variations on the Fast Neutron Flux Incident on Pressurized Water Reactor Vessels,” Proc. Int. Congress Advances in Nuclear Power Plants (ICAPP 2019), Juan-les-Pins, France, May 12–15, 2019; https://hal.archives-ouvertes.fr/hal-02463775 (current as of May 28, 2021).
- J. D. RHODES, J. M. HYKES, and R. M. FERRER, “CASMO5. A Fuel Assembly Burnup Program User’s Manual,” Rev. 12, Studsvik Scandpower (2017).
- T. BAHADIR and S. O. LINDAHL, “Studsvik’s Next Generation Nodal Code SIMULATE-5,” Studsvik Scandpower and Studsvik Scandpower AB (2009).
- M. CHADWICK et al., “ENDF/B-VII.1 Nuclear Data for Science and Technology: Cross Sections, Covariances, Fission Product Yields and Decay Data,” Nucl. Data Sheets, 112, 12, 2887 (2011); https://doi.org/https://doi.org/10.1016/j.nds.2011.11.002.
- A. HEBERT, Applied Reactor Physics, Presses internationales Polytechnique (2009).
- T. BAHADIR and S. LINDAHL, “SIMULATE-4 Pin Power Calculations,” Proc. Topl. Mtg. Reactor Physics, Vancouver, British Columbia, Canada, September 10–14, 2006.
- J. D. RHODES, J. M. HYKES, and R. M. FERRER, “CASMO5 Methods and Validation Report,” Rev. 9, Studsvik Scandpower (2018).
- J. D. RHODES, J. M. HYKES, and R. M. FERRER, “SIMULATE5—Advanced Three- Dimensional Multigroup Reactor Analysis Code,” Rev. 9, Studsvik Scandpower (2018).
- D. PELOWITZ et al., “MCNP6 User’s Manual,” LA-CP-13-00634, Los Alamos National Laboratory (2013).
- T. GOORLEY et al., “Initial MCNP6 Release Overview—MCNP6 Version 1.0,” LA-UR-13-22934, Los Alamos National Laboratory (2013); https://doi.org/https://doi.org/10.2172/1086758.
- “Computing Radiation Dose to Reactor Pressure Vessel and Internals,” NEA/NSC/DOC(96)5, Organisation for Economic Co-operation and Development, Nuclear Energy Agency, Nuclear Science Committee (1997).
- S. MOSHER et al., “ADVANTG—An Automated Variance Reduction Parameter Generator, Rev. 1,” ORNL/TM-2013/416, Oak Ridge National Laboratory (2015).
- J. C. WAGNER and A. HAGHIGHAT, “Automated Variance Reduction of Monte Carlo Shielding Calculations Using the Discrete Ordinates Adjoint Function,” Nucl. Sci. Eng., 128, 2, 186 (1998); https://doi.org/https://doi.org/10.13182/NSE98-2.
- T. M. EVANS et al., “Denovo: A New Three-Dimensional Parallel Discrete Ordinates Code in SCALE,” Nucl. Technol., 171, 2, 171 (2010); https://doi.org/https://doi.org/10.13182/NT171-171.
- A. PLOMPEN et al., “The Joint Evaluated Fission and Fusion Nuclear Data Library, JEFF-3.3,” Eur. Phys. J. A, 56, Article 181 (2020); https://doi.org/https://doi.org/10.1140/epja/s10050-020-00141-9.
- K. NORDLUND et al., “Primary Radiation Damage,” NEA/NSC/DOC(2015)9, Organisation for Economic Co-operation and Development, Nuclear Energy Agency, Nuclear Science Committee.
- W. CAI et al., “1.18 - Molecular Dynamics,” Comprehensive Nuclear Materials, 2nd ed., p. 573, R. J. KONINGS and R. E. STOLLER, Eds., Elsevier, Oxford; https://doi.org/https://doi.org/10.1016/B978-0-12-803581-8.11724-2.
- C. J. ORTIZ, L. LUNEVILLE, and D. SIMEONE, “1.19 - Binary Collision Approximation,” Comprehensive Nuclear Materials, 2nd ed., p. 595, R. J. KONINGS and R. E. STOLLER, Eds., Elsevier, Oxford; https://doi.org/https://doi.org/10.1016/B978-0-12-803581-8.11649-2.
- M. NORGETT, M. ROBINSON, and I. TORRENS, “A Proposed Method of Calculating Displacement Dose Rates,” Nucl. Eng. Des., 33, 1, 50 (1975); https://doi.org/https://doi.org/10.1016/0029-5493(75)90035-7.
- K. NORDLUND et al., “Improving Atomic Displacement and Replacement Calculations with Physically Realistic Damage Models,” Nat. Commun., 9, 1 (2018); https://doi.org/https://doi.org/10.1038/s41467-018-03415-5.
- R. MacFARLANE et al., “The NJOY Nuclear Data Processing System, Version 2016,” LA-UR-17-20093, Los Alamos National Laboratory (2017); https://doi.org/https://doi.org/10.2172/1338791.
- A. KAHLER, “NJOY/HEATR: What it Calculates Now, What Should it Calculate?” LA-UR-12-25531, Los Alamos National Laboratory (2012).
- S. P. SIMAKOV et al., “Iron NRT- and Arc-Displacement Cross Sections and Their Covariances,” Nucl. Mater. Energy, 15, 244 (2018); https://doi.org/https://doi.org/10.1016/j.nme.2018.05.006.
- A. KONOBEYEV et al., “Evaluation of Effective Threshold Displacement Energies and Other Data Required for the Calculation of Advanced Atomic Displacement Cross-Sections,” Nucl. Energy Technol., 3, 3, 169 (2017); https://doi.org/https://doi.org/10.1016/j.nucet.2017.08.007.
- A. YU KONOBEYEV et al., “ARC-dpa Cross-Sections for High Priority Elements,” Karlsruhe Institute of Technology (2017); https://doi.org/https://doi.org/10.13140/RG.2.2.32203.08486.
- B. VEILLARD-BARON and Y. MEYZAUD, “Structure des racteurs nuclaires - Aciers spciaux,” Techniques de l’ingnieur, bn3730 (1998).
- R. VUIART et al., “Impact of Fission Spectrum Modeling on Aging Estimations of Pressurized Water Reactor Vessels,” Trans. Am. Nucl. Soc., 125, 1106 (2021); https://doi.org/https://doi.org/10.13182/T125-36557.