
 ?Mathematical formulae have been encoded as MathML and are displayed in this HTML version using MathJax in order to improve their display. Uncheck the box to turn MathJax off. This feature requires Javascript. Click on a formula to zoom.
Abstract
Vibration of nuclear power plant components can cause fretting wear and fatigue that can eventually lead to component failure. Flexible, high-aspect-ratio components under flow, such as the wire-wrapped cylindrical fuel elements in a liquid metal-cooled fast reactor core, are particularly susceptible to vibration due to their low natural frequencies. The flow-induced vibrations experienced by such components tend to be random and of low amplitude and frequency; however, at critical flow velocities these components can experience self-excited, fluid-elastic instabilities that can lead to immediate failure. Such failures of critical reactor components, particularly those that act as fission product barriers, can lead to prolonged shutdowns of nuclear power plants and even to their permanent closure. Thus, a better understanding of the vibration response of wire-wrapped cylinders in axial flow is needed. This study details the development of a theoretical model that incorporates the effects of a helical wire wrap along a cylinder to understand its impact on the dynamic response of the cylinder under flow. This theoretical model is compared against experimental vibration data of varying geometries of solitary wire-wrapped cylinders in confined axial flow. The results of this study provide an improved knowledge of how a helical wire wrap can affect the dynamic response of a cylinder under flow.
I. INTRODUCTION
Since the commercialization of nuclear power plants, a substantial amount of effort has been devoted to eliminating or suppressing structural vibrations of reactor components that are detrimental to the safety and operation of a reactor. Flexible, high-aspect-ratio components under flow, such as the wire-wrapped cylindrical fuel elements in a liquid metal-cooled fast reactor core, are particularly susceptible to vibration damage through collisions with adjacent structures (fretting wear) and cyclic loading (fatigue). At critical flow velocities these components can experience self-excited, fluid-elastic instabilities that can lead to immediate structural failure. It is therefore important to understand the dynamics of these components under operational flow conditions in order to prevent such failures.
Research studies on axial flow–induced vibration of cylindrical fuel elements began in the late 1950s with Burgreen et al. reporting the first experimental parametric study on the vibration of bundled cylinders in axial flow.Citation1 In the 1960s, PaïdoussisCitation2–6 derived a more comprehensive equation of motion for small lateral motions of a horizontal slender cylinder immersed in axial flow. By the early 1970s, several studies had attempted to develop a subcritical vibration amplitude correlation for cylinders in axial flow.Citation7,Citation8 In the mid-1970s, ChenCitation9 developed the first model for coupled vibration of bundled cylindrical fuel elements in square and hexagonal arrays. This was the first study to include the impact of a helical wire spacer on the vibration of a fuel pin. However, only the mass of the wire spacer was included in the calculations; the stiffness of the wire spacer and the effect the wire spacer has on fluid flow were neglected. However, none of these analytical models were as inclusive as that of Païdoussis, who in 1973 (CitationRef. 7) improved upon the equation of motion of a cylinder in axial flow by introducing gravitational and pressure drop effects for cases where the cylinder was oriented vertically and immersed in confined flow (i.e., within a channel or adjacent to immobile cylinders). Païdoussis demonstrated that this equation of motion could be nondimensionalized and solved for the dimensionless complex frequency to determine the stability of the cylinder under axial flow conditions.
Flow-induced vibration of cylinders in axial flow have been extensively studied. While some of these studies are based upon understanding the vibration response of wire-wrapped fuel pins, no studies to date have accounted for the total effect that the wire wrap has on the dynamic motion of the cylinder (e.g., stiffness and added mass), as well as the effects on the fluid flowing across the cylinder (e.g., friction and drag losses) and how the combination of these elements could affect the stability of the cylinder under axial flow.
In this study a new model is developed and presented based on Païdoussis’ model for axial flow of a cylinder and includes the effects (hydraulic and mechanical) of a helical wire wrap representative of a liquid metal fuel reactor (LMFR) fuel-pin geometry. This model’s results are verified against reference solutions. Finally, a new set of experiments is presented and compared against the model to validate its applicability and representation of the physics related to a LMFR-like fuel-pin geometry and axial flow–induced vibration.
II. WIRE-WRAPPED CYLINDER MODEL
The development of a theoretical model for a wire-wrapped cylinder under confined axial flow is presented herein. First, a review of Païdoussis’ equation of motion for a bare cylinder in axial flow is presented. Then, the modifications and expansion to this equation of motion to account for the effects of a helical wire wrap are detailed. The section concludes with the method for solving the equation of motion along with the verification of the wire-wrapped cylinder model.
II.A. Bare Cylinder Model Review
Recalling Païdoussis’ general formulation in CitationRef. 10, the linear equation of motion for small lateral deformations of a pinned-pinned cylinder in axial flow may be derived through a Newtonian approach. A schematic of a bare, slender (i.e., L/D > 10) cylinder of length L, outer diameter D, cross-sectional area Ac, mass per unit length M, and flexural rigidity EI is shown in .
Fig. 1. Free-body diagram of a pinned-pinned cylinder.
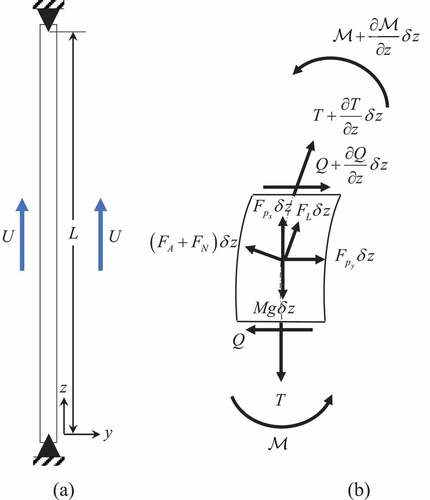
The fluid flowing along the cylinder is assumed to be incompressible with a density of ρf and uniform axial velocity U. shows the free-body diagram of the forces and moments acting on a small section δz of the cylinder. These forces include the shear force Q, the axial tension T, the bending moment ℳ, the weight of the section Mgδz, the hydrostatic forces in the z-direction and y-direction Fp,z,yδz, the viscous forces in the longitudinal and normal directions FLδz and FNδz, and the inviscid hydrodynamic force in the normal direction FAδz. Balancing these forces results in
and
Following the method outlined in CitationRef. 10, the pressure-gradient forces are defined as
and
Inserting EquationEq. (3)(3)
(3) into EquationEq. (1)
(1)
(1) gives
and inputting EquationEq. (4)(4)
(4) into EquationEq. (2)
yields
Euler-Bernoulli (thin beam) theory defines the shear force asCitation11
where the bending moment is
The viscous forces acting on the cylinder are
where CT is the tangential friction drag coefficient, and
and CN is the normal friction drag coefficient. The inviscid hydrodynamic force acting on the cylinder is
where the confinement parameter is defined as
The force from the pressure drop along the section δz may take the form
The expression (T + pAc) may be determined by combining EquationEqs. (5)(5)
(5) , (Equation9
(9)
(9) ), and (Equation13
(13)
(13) ); integrating from z to L results inCitation10
where
Combining EquationEqs. (6) through (Equation15
(15)
(15) ) gives the linear equation of motion of a bare cylinder in axial flow:
The boundary conditions for a pinned-pinned cylinder (z = 0, L) are
and
The equation of motion can be converted into dimensionless form by implementing the following three dimensionless parameters as detailed in CitationRef. 10 as
and
Substituting them into EquationEqs. (16), (Equation17
(17)
(17) ), and (Equation18
(18)
(18) ) results in
where
and
Furthermore, the boundary conditions for a pinned-pinned cylinder (ξ = 0, 1) become
and
Modifications to the linear mass density and rigidity of the cylinder, as well as the drag along it due to the addition of a helically wrapped wire spacer, are presented in Sec. II.B. These modifications will be incorporated into their respective parameters within the bare cylinder model to maintain the current form of the dimensionless equation of motion.
The addition of a wire, wrapped helically along a cylinder, contributes both mass and rigidity to the cylinder and increases the drag along the cylinder. These modifications will be incorporated into their respective parameters within the bare cylinder model to maintain the current form of the dimensionless equation of motion. The geometry of the helical wire along the cylinder is defined by its axial pitch H, which is the axial length in which the wire completes a single revolution around the cylinder ().
Fig. 2. Wire-wrapped pin and bundle geometry.
Additionally, the array pitch P is defined as the center-to-center distance between adjacent pins within a bundle. For tightly compact wire-wrapped pin bundles (), the array pitched is assumed to be
and will be the definition of the array pitch used hereinafter, where Dco and Ds are the outer diameters of the cylinder and wire, respectively.
II.B. Wire-Wrap Mass
The mass of a cylinder is typically accounted for through the linear mass density term, which is the mass per unit length of the cylinder. For a helically wire-wrapped cylinder (or pin), the linear mass density is the sum of the cylinder and wire components:
where the linear mass density of the wire spacer can be determined by the product of its material density ρs with its cross-sectional area As with respect to the longitudinal axis of the cylinder:
Because of the angle of the helical wire wrap, the cross-sectional area of the wire is elliptical in shape () and can be determined by
Fig. 3. Elliptical cross-sectional area of a helically wrapped wire spacer.
where ϕs is the axial pitch (or lead) angle of the wire defined as
and P/D is the pitch–to–cylinder diameter ratio with H/D being the axial pitch–to–cylinder diameter ratio.
Likewise, the added linear mass density of a helical wire spacer is
and thus, the added linear mass density of a wire-wrapped cylinder is
The effect that the pitch-to-diameter and axial pitch–to–diameter ratios have on the cross-sectional area of a wire-wrapped cylinder, and thereby the linear mass density (if the cylinder and wire spacer are of the same material), is shown in .
Fig. 4. Wire added cross-sectional area as a function of P/D and H/D.
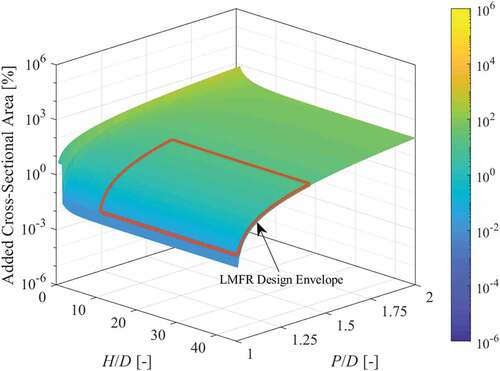
presents the added cross-sectional area in percent that a helical wire wrap would contribute to a cylinder as a function of both the pitch-to-diameter ratio and axial pitch–to–diameter ratio. The values for the pitch-to-diameter ratios shown span from P/D = 1, which represents a bare cylinder with no wire, to P/D = 2, which represents a wire diameter equal to the cylinder diameter. The values for the axial pitch to the diameter span from the lower physical limit of H/D = P/D – 1, which represents a wire wrap that covers the entire surface of the cylinder, to H/D = 45, which represents the upper limit of the LMFR fuel pin wire geometries. The axial pitch cannot be less than the diameter of the wire spacer and therefore sets the lower limit on the axial pitch–to–diameter ratio. The cross section of the wire spacer for the lower bound essentially completes an annular ring around the cylinder and is approximated as such.
The added area, and thus the linear mass density, is largely dependent on the wire diameter with the axial pitch becoming a factor only at very small (H/D < 10) values. Also, at large axial pitch values (H/D > 20), the added cross-sectional area approaches 100% when P/D = 2 (i.e., when the wire diameter is equal to the cylinder diameter). This is expected since the cross-sectional area of the wire becomes less elliptical and more circular as H/D goes to infinity, while for the lower bound limit, the added cross-sectional area approaches 800% when P/D = 2. This is expected because the annular cross section would have an outer diameter three times that of its inner diameter (or in this case the diameter of the cylinder) since the wire diameter is equal to the cylinder diameter. Typical LMFR wire-wrap geometries (shown by the red box in ) contribute up to ~50% in additional cross-sectional area to the cylinder.
II.C. Wire-Wrap Rigidity
Since the wire spacer is not physically bonded to the cylinder, the area moment of inertia, which represents the second moment of inertia of the area about an axis, can be determined through the summation of the cylinder and wire components. The area moment of inertia of the wire spacer is
However, since the wire spacer rotates around the cylinder and therefore its area moment of inertia with respect to the cylinder will change due to its polar position on the cylinder, it is more accurate to use the mean area moment of inertia per axial pitch, which decreases EquationEq. (39)(39)
(39) by a factor of 2:
Thus, the rigidity of a wire-wrapped cylinder is
The effect that the pitch-to-diameter and axial pitch–to–diameter ratios have on the area moment of inertia of a wire-wrapped cylinder, and thereby the rigidity (if the cylinder and wire spacer are of the same material), is shown in .
Fig. 5. Wire added area moment of inertia as a function of P/D and H/D.
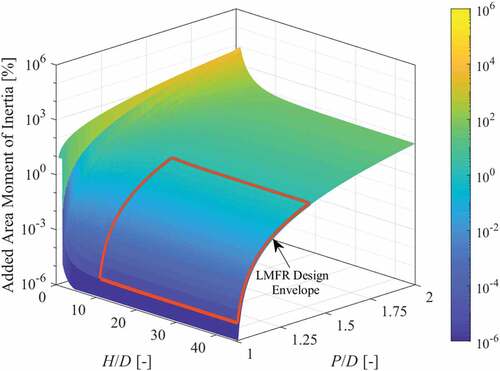
shows the added area moment of inertia in percent that a helical wire wrap would contribute to a cylinder as a function of pitch-to-diameter ratio and axial pitch–to–diameter ratio. The added area moment of inertia for the lower bound axial pitch–to–diameter ratio is nearly two orders of magnitude larger than the upper bound. This is due to the annulus approximation discussed above, which has a significantly larger area moment of inertia than the slightly elliptical cross section of the wire spacer at larger axial pitches. Since the area moment of inertia is a function of the diameter to the fourth power, the added area moment of inertia for the lower bound ends up being an order of magnitude greater than the added cross-sectional area.
Like the linear mass density, the added area moment of inertia, and thus the rigidity, is primarily dependent on the wire diameter for large (P/D > 1.4) values with the axial pitch becoming a factor only at very small (H/D < 20) values. Additionally, at large axial pitch values (H/D > 20), the added area moment of inertia approaches 50% when P/D = 2. The added area moment of inertia approaches 50% and not 100% like the added cross-sectional area as H/D goes to infinity because the mean area moment of inertia is used due to the rotation of the wire about the cylinder. Hence, the decrease of EquationEq. (39)(39)
(39) by a factor of 2 is observed here.
II.D. Wire-Wrap Drag
The mechanical energy loss over the length of a wire-wrapped cylinder in a confined channel comprises friction losses caused by the cylinder and channel surfaces, as well as the drag loss caused by the angled projection of the wire. The general equation for this energy loss (or pressure drop) along the length of a wire-wrapped cylinder is given by
where the friction factor can be determined by
where Cf is the friction factor constant and m is equal to unity for the laminar region and 0.18 for the turbulent region.Citation12 shows a cross section of a single wire-wrapped cylinder within a square channel. The square channel geometry permits the use of friction factor constants (presented in CitationRef. 12) for bare cylinder corner subchannels in a square array. These constants will be used to determine the values for the friction factor constant in EquationEq. (43)(43)
(43) .
Fig. 6. Square channel cross-section geometry.
The geometry of the square channel with respect to the wire-wrapped cylinder is defined by the edge pitch parameter
where Dgap is the space between the cylinder and the channel wall. Accordingly, W/D is the edge pitch–to–diameter ratio and is used to select the appropriate friction factor constants for any edge boundary subchannels. Cheng and Todreas formulated a pressure loss equation that included both the frictional and drag lossesCitation12:
where the friction factor for a bare cylinder is given by
where Cf,b is the friction factor constant from the bare cylinder results. The wetted perimeter for the bare cylinder and channel is determined by
where Sch is the side length of the channel. Likewise, the wetted perimeter of the wire is given by
The drag coefficient for the wire is determined byCitation12
where the wire drag constant is defined as
for the turbulent region and
for the laminar region. The wire projected area is defined as
and the flow area around a bare cylinder is determined by
Equating EquationEqs. (42)(42)
(42) and (Equation45
(45)
(45) ), and substituting EquationEqs. (43)
(43)
(43) , (Equation46
(46)
(46) ), and (Equation49
(49)
(49) ), the friction factor constant may be determined by
For a bare cylinder, the wetted perimeter ratio goes to unity, and the projected wire area goes to zero, reducing EquationEq. (54)(54)
(54) to the friction factor constant for a bare cylinder.
The effect that the pitch-to-diameter and axial pitch–to–diameter ratios have on the turbulent friction factor constant of a wire-wrapped cylinder within a square channel of W/D = 2.5 is shown in .
Fig. 7. Wire added friction factor as a function of P/D and H/D.
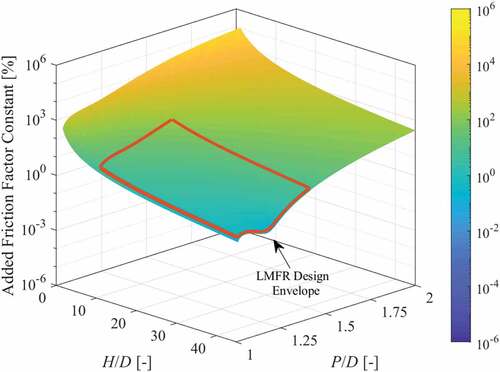
shows the percent added friction factor constant that would result from the addition of a helically wrapped wire along a cylinder as a function of pitch-to-diameter ratio and axial pitch–to–diameter ratio. Out of the three parameters, the friction factor constant is affected the most by the addition of a wire wrap. As the projected area of the wire increases from increasing wire diameter and decreasing axial pitch, so too does the friction factor constant until the wire wrap can be approximated as an annulus around the cylinder.
In summary, the added linear mass density and area moment of inertia of a helical wire spacer to a cylinder are primarily dependent on the pitch-to-diameter ratio for large axial pitch–to–diameter ratios. However, the axial pitch–to–diameter ratio dominates as it approaches its lower bound, and the helical wire wrap assumes an annulus around the cylinder. At large pitch-to-diameter ratios (P/D > 1.4), the effect that axial pitch–to–diameter ratios have on these parameters begins to appear. However, the magnitudes of these added parameters are over an order of magnitude less than the added friction factor constant resulting from the wire drag for those geometries within the wire-wrapped fuel pin range. The added friction factor constant due to the wire drag becomes significant as the pitch-to-diameter ratio increases and the axial pitch–to–diameter ratio decreases. Thus, the addition of a thick wire spacer wrapped in a tight axial pitch around a cylinder will have a significant effect on the stability of the cylinder, potentially leading to instabilities at lower dimensionless flow velocities.
II.E. Method of Solution
As presented in CitationRef. 13, the Galerkin method can be used to discretize a continuous system in order to approximate its eigenvalues and thereby its natural frequencies. The dimensionless form of the equation of motion for a cylinder with pinned-pinned boundary conditions, EquationEq. (22)(22)
(22) , can be discretized by
where ϕr (ξ) are the appropriate comparison functions that must satisfy all the geometrical and natural (i.e., forces or moments) boundary conditions and qr (τ) are generalized coordinates of the discretized system. The eigenfunctions (or modal shapes) of a pinned-pinned cylinder can be used as the comparison functions in EquationEq. (55)(55)
(55) and are defined as
where the eigenvalues are
Following the discretization through the Galerkin procedure, the equation of motion becomes
and can be written in compact matrix form:
where
and the matrices are
and
Additionally, δsr is Kronecker’s delta, and the constants bsr, csr, and dsr have been previously defined for pinned-pinned, fixed-fixed, and cantilevered beams in CitationRef. 13. The constants for a pinned-pinned beam, where s = r, are
and
For s ≠ r, the constants are
and
Likewise, for a fixed-fixed beam, the constants for when s = r are
and
For s ≠ r, the constants are
and
Furthermore, for a fixed-free beam, the constants for when s = r are
and
For s ≠ r, the constants are
and
The dimensionless natural frequency λ and mode shape σ parameters for the first five modes are tabulated in for pinned-pinned, fixed-fixed, and fixed-free boundary conditions.
TABLE I Beam Dimensionless Frequency and Mode Shape Parameters*
Since the equation of motion includes viscous damping, the system is nonconservative and must be converted to state space in order to solve analytically. As detailed in CitationRef. 15, the matrix form of the state equations for free vibration are
where the system matrix is
The eigenvalues and eigenvectors of the system matrix may be determined through the use of the eigenvalue MATLAB function. The eigenvalues, and thus the eigenfrequencies, are complex, containing both real and imaginary components and can be plotted in an Argand diagram as a function of the dimensionless velocity ().
Fig. 8. Argand diagram for a bare pinned-pinned cylinder.
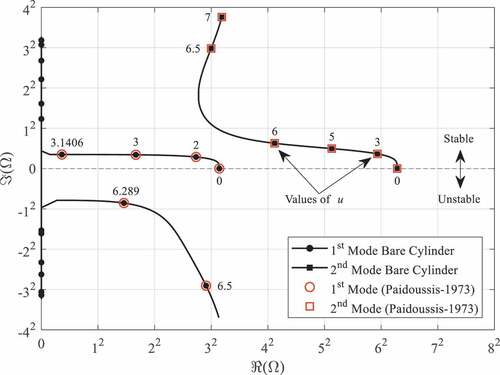
shows the Argand diagram for a bare cylinder of the same geometry as that of in CitationRef. 7 (with β = 0.48, ϵcf = 0.25, δ = χ = 1, and c = α = h = γ = Π = Γ = 0) and obtained using the wire-wrapped cylinder model developed with a five-mode Galerkin approximation. Recall that buckling (divergence) occurs when ℜ(Ωr) = 0 and ℑ(Ωr) < 0, while oscillatory instabilities (flutter) occur when ℜ(Ωr) ≠ 0 and ℑ(Ωr) < 0. Hence, buckling in the first mode occurs at u > π, and first mode oscillations occur at u > 2π, while the second mode is stable up to u = 7 and experiences only damped oscillations. Note that this model has been developed using linear theory and therefore can predict only the onset of these instabilities. Furthermore, convergence of the critical dimensionless velocities for the onset of divergence ucd and flutter ucf in the first mode is shown in , which validates the five-mode Galerkin approximation used to obtain the results in .
TABLE II Galerkin Approximation Convergence of Critical Dimensionless Velocities
shows how the boundary conditions can affect the stability of a cylinder by only changing the pinned-pinned supports in to fixed-fixed. The fixed-fixed boundary conditions significantly increase the stability of the cylinder as buckling in the first mode occurs at a dimensionless velocity over twice that of the pinned-pinned cylinder. Additionally, the fixed-fixed cylinder does not experience flutter over the same range of dimensionless flow velocities. In addition to the increased stability of the system, the fixed-fixed cylinder oscillates at higher frequencies in both the first and second modes.
Fig. 9. Argand diagram for bare (a) fixed-fixed, (b) fixed-free, and (c) pinned-pinned cylinders.
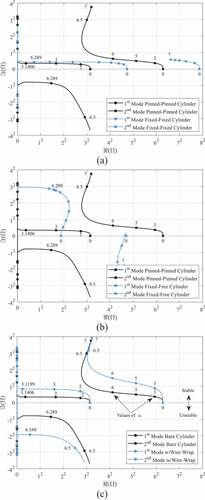
shows the effect of removing one of the fixed supports from and compares the resulting fixed-free cylinder to the original pinned-pinned cylinder from . The fixed-free boundary conditions increase the stability of the cylinder in the first mode with respect to buckling, which is predicted to occur at higher dimensionless velocities than both the pinned-pinned and fixed-fixed cylinders. However, the second mode becomes unstable and experiences flutter at very low dimensionless velocities. , and show how significantly the boundary conditions impact the stability of a cylinder.
A wire with geometry of P/D = 1.5 and H/D = 10 was added to the pinned-pinned bare cylinder defined in to observe its potential effects on the stability of the cylinder. This wire geometry resulted in an ~28% increase in the cross-sectional area, ~4.3% increase in the area moment of inertia, and ~468% increase in the friction factor constant. The Argand diagram for such a cylinder is presented in .
It can be observed that the addition of the helical wire to the cylinder led to a slight decrease in the dimensionless flow velocity required for first mode buckling (u > 3.1199). However, the onset of flutter requires a slightly higher dimensionless flow velocity (u > 6.349). As with the geometry of the bare cylinder in , the second mode remains stable over a dimensionless flow velocity range of 0 to 7.
Païdoussis’ equation of motion for a pinned-pinned bare cylinder in axial flow was reviewed and used as the foundation for developing a wire-wrapped cylinder model. The addition of a helically wrapped wire spacer along a bare cylinder increased the linear mass density and rigidity of the cylinder. The additional drag effects from the wire spacer were also accounted for within the model. The Galerkin method was used to discretize the equation of motion in order to analyze the stability of particular geometric configurations. This model will be used to predict the stability of solitary wire-wrapped cylinders used in the experimental portion of this study.
III. EXPERIMENTAL SETUP
This study leverages a recently developed and demonstrated experimental technique for measuring flow-induced vibration. This method utilizes an instrument referred to as a distributed strain sensorCitation16,Citation17 (DSS). This technique leverages an ODiSI-B sensing system procured by LUNA®. It comprises a sensing module and a fiber optic line that is bonded to a structure.Citation18 The technique was further extended in demonstrating the ability to measure the interaction of pins vibrating and mechanically interacting with one another.Citation19,Citation20
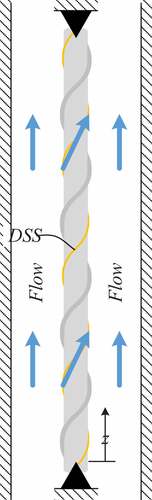
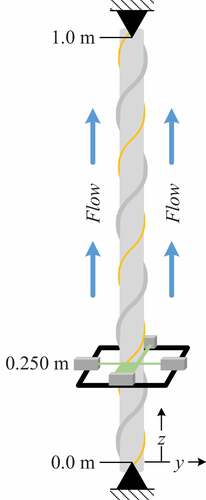
For all tests performed in this study, the simply supported test pin was oriented in a vertical configuration confined within a square flow channel and subjected to fluid (i.e., water) flow in the upward direction as depicted in .
Fig. 10. Single-pin flow test schematic.
To subject the test pin to axial flow, the test section was placed into a leg of a circulating closed-loop thermal-hydraulic system. The test loop utilizes a variable speed drive to control a Goulds e-SV series 33SV vertical multistage turbine pump capable of providing flow rates up to 225 gallons per minute (gpm) with a maximum dynamic head of 205 ft of H2O.
The test section leg shown in consisted of a tube-type flow straightener and vortex flowmeter positioned directly upstream of the test section. The flow straightener provided uniform fully developed flow into the vortex flowmeter. Once it is in the vortex flowmeter, the fluid passes around a bluff body that extends across the pipe cross section and is perpendicular to the pipe axis. At sufficiently high flow rates (~18 gpm), this bluff body produces periodic vortex shedding that alternates around the body. The vortex flowmeter determines the flow rate of the fluid by measuring the frequency of the pressure fluctuations generated from these alternating vortices that are proportional to the flow velocity. In addition to flow rate, the state properties of the fluid are to be determined from the temperature and pressure measurements that are collected at the inlet and outlet of the test section. The two pairs of optical micrometers were positioned around the test section and attached to a linear stage that extends along the length of the test section.
Fig. 11. Single-pin flow test experimental setup.
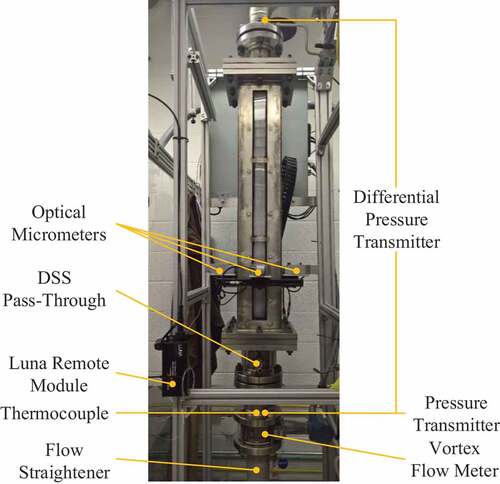
A stack of acrylic blocks was placed into the test section to reduce the flow area around test pin down to a 22.0 × 22.0-mm square cross section. The purpose of reducing the flow area was to produce higher bulk flow velocities to induce vibration of the test pin. The blocks were made of acrylic to maintain visual access to the test pin, which permits continued use of the optical micrometers as the validation measurement technique.
III.A. Test Specimens
The test pins used for experimental testing were 1-m-long, polyether ether ketone (PEEK) rods helically wrapped with metallic wire. The test pin geometry was constrained by the test section described herein. This required the test pins to be 1 m in length, from pin rail hole center-to-center. Additionally, the minimum test pin diameter was limited to 0.25 in. by the pin rails that support the test pin at both ends of the test section, as the pin diameter had to be wide enough to accommodate the machining of the pin rail slots. Such geometric constraints, combined with the limited flow capacity of the experimental loop’s pump, precluded the use of test pins made of materials with high moduli of elasticity (e.g., stainless steel, aluminum, etc.). PEEK rods were selected as the cylindrical component of the test pin because of PEEK’s low modulus of elasticity, which is nearly 50 times less than Type 304 stainless steel (304SS), and the ability to utilize the same bonding process to secure a DSS to the test pins.
To maximize the potential for test pin vibration, the diameter of the test pins was set to the minimum of 6.35 mm (0.25 in.). Utilizing a small-diameter pin reduced the rigidity and allowed for larger vibration amplitudes. The wire geometries were selected based on the typical geometries of wire-wrapped fuel pins in LMFR systems,Citation12 that is, 1.025 ≤ P/D ≤ 1.42 and 8.0 ≤ H/D ≤ 50.0. The five test pins examined in this study () included a bare pin, a reference pin, two pins with varied pitch-to-diameter ratios, and one pin with a varied axial pitch–to–diameter ratio ().
TABLE III Test Pin Dimensionless Parameters
Fig. 12. Test pins 1 through 5 (from left to right) on a pin rail.
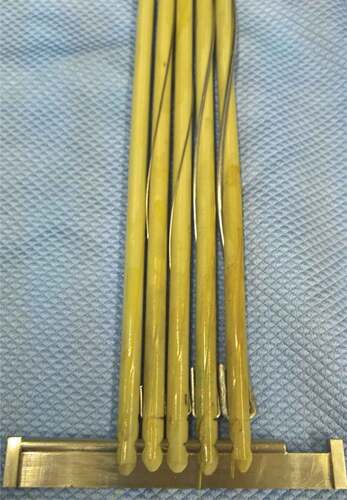
The geometric and material specifications of the test pins are presented in and , respectively. Aluminum wire was used for the larger-diameter wire spacers in Test Pin 4 (TP-4) and Test Pin 5 (TP-5) since it is softer than stainless steel and could be more readily wrapped along the PEEK rods.
TABLE IV Test Pin Geometric Specifications
TABLE V Test Pin Material Specifications
Utilizing the equations developed herein, the additional area, linear mass density, area moment of inertia, rigidity, and friction factor constants from the wires in Test Pin 2 (TP-2), Test Pin 3 (TP-3), TP-4, and TP-5 are tabulated in .
TABLE VI Effect of Wire on Test Pin Parameters
From , it is apparent that the wire geometries with P/D = 1.1 may have a very limited impact on the dynamics of the test pins. However, the increased drag from the larger-diameter wires could potentially have a significant impact on the flow-induced vibration of the test pins. Using the theoretical model developed herein, the potential effects of the four wire geometries on the test pin dynamics under flow are observed in the following Argand diagrams.
The Argand diagram for the bare cylinder test pin [Test Pin 1 (TP-1)] resulting from the model developed herein is shown in . The first three modes are plotted as a function of dimensionless velocity, which ranges from 0 to just under 3 for the expected flow test range. The model predicts that first mode buckling will occur at u = 1.8675 while the second and third modes will remain stable with damped oscillations over the flow rate range. This Argand diagram for the bare cylinder test pin is compared against the other wire-wrapped test pins in the following figures to demonstrate the potential effects that the wire wraps will have on the flow-induced vibration of the test pins.
Fig. 13. Argand diagram of TP-1 (bare cylinder).
shows the Argand diagram for TP-2 (P/D = 1.1 and H/D = 25.9) overlaid onto the results of TP-1 (bare) from . The addition of the wire wrap decreases the dimensionless velocity for which first mode buckling is predicted to occur from u = 1.8675 down to u = 1.8145. However, the second and third modes are essentially unchanged.
Fig. 14. Argand diagram comparison of bare and wire-wrapped cylinders.
shows the Argand diagram for TP-3 (P/D = 1.1 and H/D = 19.4) overlaid onto the results of TP-1 (bare) from . The decrease in axial pitch along the test pin leads to a slight increase in the dimensionless velocity for which first mode buckling is predicted to occur from u = 1.8145 up to u = 1.8159, which indicates that the slight increase in additional wire along the test pin may potentially help stabilize the test pin. Similar to the wire of TP-2, the wire of TP-3 has a limited effect on the second and third mode stability lines, with only a slight shift upward over the stability lines of the bare cylinder (TP-1).
shows the Argand diagram for TP-4 (P/D = 1.2 and H/D = 25.9) overlaid onto the results of TP-1 (bare) from . The approximately doubling of the diameter of the wire leads to an increase in the dimensionless velocity for which first mode buckling is predicted to occur from u = 1.8145 up to u = 1.8226. Similar to what was observed in , the addition of more wire material along the length of the test pin increases the stability of the test pin in regard to first mode buckling. However, the wire wrap of TP-4 is still predicted to lower the dimensionless velocity required for first mode buckling when compared to the bare cylinder (TP-1). As with the wire wraps of TP-2 and TP-3, the second and third mode stability lines are not significantly affected by the wire wrap of TP-4.
shows the Argand diagram for TP-5 (P/D = 1.3 and H/D = 25.9) overlaid onto the results of TP-1 (bare) from . The further increase in wire diameter appears to have crossed a threshold in which the additional drag generated by the wire outweighs the impact that the additional wire material has on increasing the stability of the test pin. Compared to the slight increases in the dimensionless velocities required for first mode buckling from the increase in wire material along the test pin in TP-3 and TP-4, the wire configuration of TP-5 leads to a significant decrease in the critical dimensionless velocity for first mode buckling to occur from u = 1.8145 (for TP-2) down to u = 1.7549. Furthermore, the stability lines for the second and third modes are noticeably shifted upward while remaining stable over the flow rate range.
The test pins were each instrumented with standard, 2-m-long high-definition DSSs. The DSSs were bonded to the test pins in a helical configuration matching that of each test pin’s wire-wrap configuration. For the bare test pin, the DSS was bonded in a helical configuration consisting of five revolutions. Bonding of the DSSs onto the test pins followed the procedure outlined by Nixon.Citation18 The Touch-to-Locate function of the ODiSI software was used to identify the start and end points of each DSS to facilitate the mapping of the DSS along each test pin. Assembly of each test pin followed the same procedure outlined in the single-pin flow tests.Citation18 In addition to the DSSs, optical micrometers were set up to collect test pin displacement data halfway between the bottom end and midpoint of the test pin ().
Fig. 15. Experimental flow test schematic.
Each flow test that was followed progressed with an incremental increase in flow of approximately 3 gpm and was held for a minimum period of 2 min. Flow was then adjusted via control of the circulating pump’s rpm through a variable speed drive at the next flow rate and held for an additional 2 min. This process was repeated until the entire operable range of the pump was encompassed. Data were acquired on the DSSs and optical micrometers for 10-s intervals at the midpoint of each flow rate stair step. Acquisition rates were 250 Hz and 1.2 kHz for the DSSs and optical micrometers, respectively. The experimental flow loop continuously recorded test section inlet temperature and pressure, pressure drop across the test section, and flow rate into the test section at a rate of 1 Hz throughout the duration of each flow test.
IV. RESULTS
This section includes a presentation of experimental results starting with the hydraulic characteristics of the test section around the pins tested, a presentation of the test pin amplitudes under various reduced velocities, a presentation and discussion of the trend on modal response as a function of flow rate, and last a comparison of the model’s results against experimental data under a variety of conditions.
IV.A. Hydraulic Characterization of Flow Channel
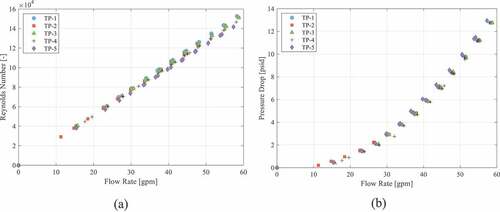
The Reynolds number and pressure drop through the test section for these flow rate intervals are presented in and , respectively, with the temperature held near 25°C for all tests and a system pressure of ~193 kPa (28 psig). These plots show that the flow conditions remain nearly constant for each flow test.
Fig. 16. (a) Reynolds number and (b) pressure drop as a function of flow rate into the test section.
IV.B. Test Pin Vibration Characteristics
This section presents the vibration amplitude and frequency results for each test pin as a function of the dimensionless velocity u. The DSS frequency data are presented as the mean of all the sensing locations along the test pins while the optical micrometer amplitude and frequency data represent the motion of the test pins at 0.25 m above the bottom of the pin.
The root-mean-square (RMS) vibration amplitude results for all five test pins as a function of dimensionless flow velocity are presented in . The vibration amplitude for all test pins increased as the flow velocity increased. Furthermore, the vibration amplitudes increased with increasing wire diameter and decreasing axial pitch.
Fig. 17. Test pin RMS vibration amplitudes in (a) x-direction and (b) y-direction.
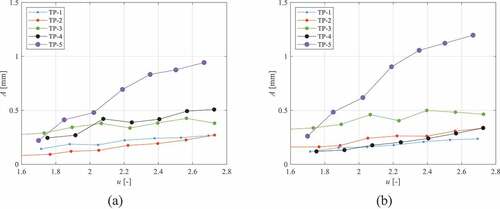
The wire-wrap geometries of TP-2, TP-3, and TP-4 were predicted to have little effect on the added mass, rigidity, and friction factor constant of the cylinder (as detailed in ), and this is confirmed by their vibration amplitudes as they are all within the 0.3-mm range and increase at a similar rate as the flow velocity increases. However, the wire-wrap geometry of TP-5 was determined to have an appreciable effect on the cylinder, and this too is confirmed in , where the amplitude of vibration is nearly twice that of the other test pins at the highest flow rate.
Recall that TP-1 was a bare 0.25-in. PEEK rod with no wire wrap. shows the vibration frequency results, obtained through fast Fourier transforms (FFTs) of the data, as a function of the dimensionless velocity. The first three modes are present () and grow in magnitude as the flow velocity increases.
Fig. 18. Optical micrometer frequency results for (a) TP-1 and (b) TP-2; modal frequencies for (c) TP-1 and (d) TP-2.
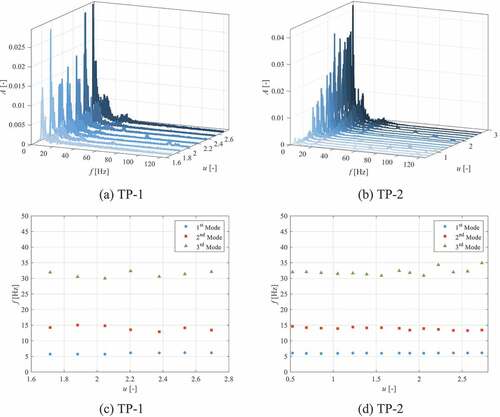
Test Pin 2 was a 0.25-in. PEEK rod with a 0.025-in. 304SS wire, wrapped six times around it (P/D = 1.1 and H/D = 25.9). shows the vibration frequency results as a function of the dimensionless velocity. Again, the first three modes are present () and grow in magnitude as the flow velocity increases.
Test Pin 3 was a 0.25-in. PEEK rod with a 0.025-in. 304SS wire, wrapped eight times around it (P/D = 1.1 and H/D = 19.4). shows the vibration frequency results as a function of the dimensionless velocity. Again, the first three modes are present and grow in magnitude as the flow velocity increases. However, as the amplitude of the first mode grows, the second mode and particularly the third mode become more difficult to distinguish in the plot. shows the mean frequency results of all the individual sensors within the DSSs along the test pin, where the first three modes can be observed as well. The second and third modes are more prominent in the DSS frequency plot since each spectrum is the mean of over 300 individual frequency spectrums along the test pin. shows the modal frequencies as a function of dimensionless velocity from both optical micrometer and DSS results.
Fig. 19. Optical micrometer frequency results for (a) TP-3, (b) TP-4, and (c) TP-5; DSS frequency results for (d) TP-3, (e) TP-4, and (f) TP-5; modal frequencies for (g) TP-3, (h) TP-4, and (i) TP-5.
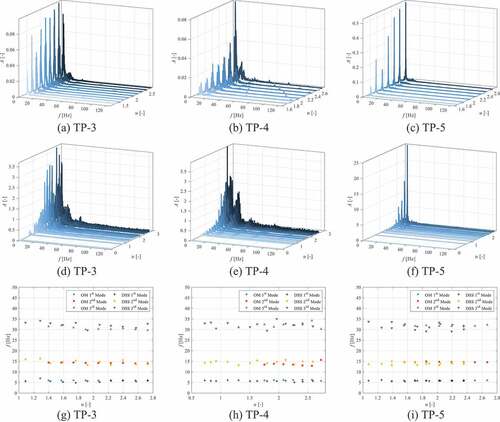
Test Pin 4 was a 0.25-in. PEEK rod with a 0.051-in. Aluminum 1100 (1100Al) wire, wrapped six times around it (P/D = 1.2 and H/D = 25.9). shows the vibration frequency results as a function of the dimensionless velocity. Consistent with the previous frequency plots, the first three modes are present and grow in magnitude as the flow velocity increases. shows the mean frequency results of all the individual sensors within the DSS along the test pin, where the first four modes can be observed. Again, the higher modes are more distinguishable in the DSS data than the optical micrometer data. shows the modal frequencies as a function of dimensionless velocity showing agreement between the optical micrometer and DSS results.
Test Pin 5 was a 0.25-in. PEEK rod with a 0.081-in. 1100Al wire, wrapped six times around it (P/D = 1.3 and H/D = 25.9). and show the vibration frequency results as a function of the dimensionless velocity. Here, the first mode vibration dominates the higher-order modes, with only the second mode observable from the plots. shows the modal frequencies as a function of dimensionless velocity showing agreement between the optical micrometer and DSS results, particularly for the first mode, while there is some slight variance between the higher-order modes.
In summary, the frequency results show that all five test pins vibrate at essentially the same frequency for the first, second, and third modes of vibration. This indicates that the additional mass and rigidity from the wire wraps is not significant enough to have a noticeable effect on the natural frequency of the PEEK cylinder.
IV.C. Comparison of Experimental Results to Theoretical Model Predictions
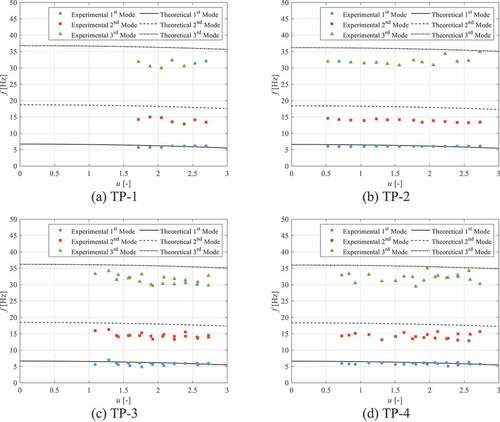
This section compares the predictions from the theoretical model to the experimental results presented in Sec. IV.B. compares the experimentally acquired modal frequencies (presented in ) for the bare test pin (TP-1) against the predicted modal frequencies from the theoretical model. The second and third mode experimental frequencies are about 20% higher than the frequencies predicted by the model while the first mode is approximately 50% higher. Furthermore, the first mode is predicted to have diverged at u = 1.55, in which linear theory predicts the stiffness to go to zero and thus the frequency as well. However, nonlinear effects prevent this from occurring, resulting in some residual oscillation frequency for the first mode.
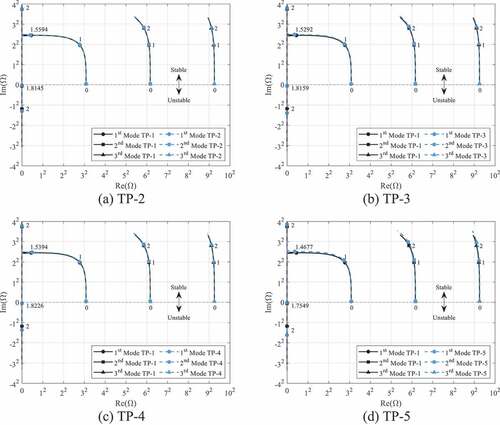
Fig. 20. Theoretical model comparison to (a) TP-1 (bare test pin), (b) TP-2, (c) TP-3, (d) TP-4, and (e) TP-5 results.
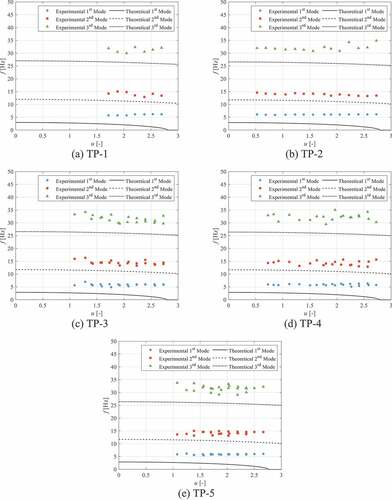
through compare the experimentally acquired modal frequencies for the other four wire-wrapped test pins against their predicted modal frequencies from the theoretical model. Similar to the bare test pin, all of the second and third mode experimental frequencies are approximately 20% greater than the predicted frequencies. Furthermore, all four of the wire-wrapped test pins were predicted to buckle at the highest dimensionless flow velocity, but this was not observed in the experimental results.
To better understand why the theoretical model underpredicted the experimentally acquired frequency results, several parameters within the model were individually adjusted to determine if inaccurate input parameters could be the cause. The oscillation frequencies of the test pins are driven primarily by their mass and stiffness parameters, where stiffness is a function of the rigidity of the test pin along with its supports or boundary conditions. shows the theoretical model predictions of TP-5 when the linear mass density parameter is tuned to predict the experimental frequency results. To achieve these predictions, the linear mass density of TP-5 was decreased by 40%. This is not a reasonable decrease in the linear mass density because each test pin mass was measured with an uncertainty of ±0.2%. Furthermore, this adjustment noticeably improves the predictions for only the second and third mode frequencies. The first mode frequency prediction is still approximately 50% off from the experimental results.
Fig. 21. Test Pin 5 with varying boundary conditions.
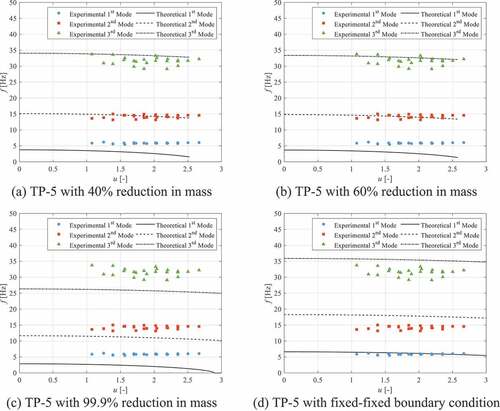
shows the theoretical model predictions of TP-5 when the rigidity parameter is tuned to predict the experimental frequency results. To achieve these predictions, the rigidity of TP-5 was increased by 60%. Like the reduction in mass, this increase in rigidity is too large to be the reason for the underprediction of the theoretical model.
shows the theoretical model predictions of TP-5 when the friction factor parameter is tuned to predict the experimental frequency results. While the friction factor does not have a direct influence on the natural frequency of the test pins, its value predicted from the Cheng and Todreas model may be inaccurate since the Cheng and Todreas model is primarily for bundle pins and not solitary pins. However, a 99.9% reduction in the friction factor had essentially zero effect on improving the theoretical model’s ability to predict the oscillation frequencies.
shows the theoretical model predictions of TP-5 when the pin rail supports are modeled as fixed-fixed boundary conditions instead of pinned-pinned boundary conditions. This change in boundary conditions raises the predicted oscillation frequencies for all three modes. Unlike the previous parameter changes, the change to fixed boundary conditions influences and accurately predicts the first mode oscillation frequency. Furthermore, the model now overpredicts the experimental frequency results in the second and third modes. However, these predictions are still within 20% of the experimental results. Therefore, the theoretical model can be improved by treating the pin rail supports as fixed boundaries. through show the effect of fixed-fixed boundary conditions for the other four test pins. These all show similar results with the first mode being accurately predicted and the second and third modes being overpredicted by approximately 20%. Thus, the pin rail is likely a combination of a pinned and fixed support. The first mode is more accurately predicted with fixed-fixed boundary conditions because this mode has the highest deflection amplitude, and thus, the flat rail portion of the pin rail will resist rotation most in this mode, creating a predominantly fixed boundary.
Fig. 22. Theoretical comparison to (a) TP-1, (b) TP-2, (c) TP-3, and (d) TP-4 with fixed-fixed boundary conditions.
V. SUMMARY
In summary, the objectives of this study have been satisfied. First, a theoretical model has been developed to incorporate, in both the solid and fluid domains, a helical wire wrap along a cylinder and its combined effect on the dynamic response and stability of a solitary cylinder in axial flow. Second, experimental flow-induced vibration tests were conducted on solitary wire-wrapped cylinders in axial flow to observe how the addition of a helical wire wrap along a cylinder affected the cylinder’s amplitude and frequency of vibration. These experimental data were acquired using the new measurement method and compared against the predictions of the theoretical model. The most significant observations resulting from this study include the following..
The influence of a helical wire wrap on a cylinder’s added mass and area moment of inertia is relatively small for the wire-wrap geometries typically used in LMFR fuel pin designs. However, the wire’s influence does become appreciable for large wire diameters (P/D ≥ 1.5) and small axial pitches (H/D ≤ 10).
The addition of a helical wire wrap does influence a cylinder’s amplitude of vibration when under axial flow. An increase in the helical wire-wrap’s influence on the linear mass density, area moment of inertia, and drag along the cylinder, typically through increased wire diameter and decreased axial pitch, results in an increased amplitude of vibration.
While the addition of a helical wire wrap affected the amplitude of vibration, it did not have any appreciable effect on the cylinder’s vibration frequencies. The added mass and area moment of inertia along the cylinder from the wire-wrap geometries tested were not significant enough to change the oscillation frequency of the cylinder.
The pin rail supports provide a semipinned/semifixed boundary condition, with the fixed boundary condition dominating at lower modes of vibration. For higher modes of vibration, the pinned boundary condition can be used to obtain a lower limit prediction in oscillation frequency, and the fixed boundary condition can be used to obtain an upper limit prediction.
While the DSS used in this study has a relatively low acquisition rate with respect to other typical vibration measurement techniques, the high number of sensing locations along a single fiber make it an ideal tool for measuring low-frequency vibrations, as the sensors can be averaged to give a highly resolved frequency spectrum. Thus, it is an ideal sensor for measuring the vibrations of long, slender cylinders in axial flow.
This work is particularly useful to entities currently developing LMFR systems with long-life cores that place an increased importance on fuel pin integrity. The model was validated selectively against a recently developed experimental method for acquiring strain-based measurement of structures. This may help to locate areas along fuel pin cladding that are potentially susceptible to fretting wear. Therefore, the completion of this work now permits the ability for entities developing LMFR systems to perform design-scoping testing for the first time in full-size LMFR fuel bundles.
Acknowledgments
The authors extend their gratitude to TerraPower, LLC, for its willingness to helically wrap the experimental rods. Additionally, thanks are due R. Brian Jackson, K. Michael Steer, Mathieu Martin, and Rob Corbin, who provided direct feedback on the conduct of the theoretical model’s development and its relation to the experimental data.
Disclosure Statement
No potential conflict of interest was reported by the author(s).
References
- D. BURGREEN, J. J. BYRNES, and D. M. BENFORADO, “Vibration of Rods Induced by Water in Parallel Flow,” Trans. ASME, 80, 5, 991 (1958).
- M. P. PAÏDOUSSIS, “The Amplitude of Fluid-Induced Vibration of Cylinders in Axial Flow,” Atomic Energy of Canada Limited (1965).
- M. P. PAÏDOUSSIS, “Dynamics of Flexible Slender Cylinders in Axial Flow Part 1. Theory,” J. Fluid Mech., 26, 4, 717 (1966); https://doi.org/10.1017/S0022112066001484.
- M. P. PAÏDOUSSIS, “Dynamics of Flexible Slender Cylinders in Axial Flow Part 2. Experiments,” J. Fluid Mech., 26, 4, 737 (1966); https://doi.org/10.1017/S0022112066001496.
- M. P. PAÏDOUSSIS, “Vibration of Flexible Cylinders with Supported Ends, Induced by Axial Flow,” Proc. Institution of Mechanical Engineers, 180, 10, 268 (1966).
- M. P. PAÏDOUSSIS, “An Experimental Study of Vibration of Flexible Cylinders Induced by Nominally Axial Flow,” Nucl. Sci. Eng., 35, 1, 127 (1969); https://doi.org/10.13182/NSE69-A21121.
- M. P. PAÏDOUSSIS, “Dynamics of Cylindrical Structures Subjected to Axial Flow,” J. Sound Vib., 29, 3, 365 (1973); https://doi.org/10.1016/S0022-460X(73)80291-3.
- M. P. PAÏDOUSSIS, “The Dynamical Behaviour of Cylindrical Structures in Axial Flow,” Ann. Nucl. Sci. Eng., 1, 2, 83 (1974); https://doi.org/10.1016/0302-2927(74)90055-5.
- S.-S. CHEN, “Vibration of Nuclear Fuel Bundles,” Nucl. Eng. Des., 35, 3, 399 (1975); https://doi.org/10.1016/0029-5493(75)90071-0.
- M. P. PAÏDOUSSIS, Fluid-Structure Interactions: Slender Structures and Axial Flow, Vol. 2, Academic Press, San Diego, California (2004).
- R. C. HIBBELER, Mechanics of Materials, 7th ed., Pearson Prentice Hall, Upper Saddle River, New Jersey (2008).
- S. K. CHENG and N. E. TODREAS, “Hydrodynamic Models and Correlations for Bare and Wire-Wrapped Hexagonal Rod Bundles—Bundle Friction Factors, Subchannel Friction Factors and Mixing Parameters,” Nucl. Eng. Des., 92, 2, 227 (1986); https://doi.org/10.1016/0029-5493(86)90249-9.
- M. P. PAÏDOUSSIS, Fluid-Structure Interactions: Slender Structures and Axial Flow, Vol. 1, Academic Press, San Diego, California (1998).
- R. D. BLEVINS, Formulas for Dynamics, Acoustics and Vibration, John Wiley & Sons, Chichester, United Kingdom (2016).
- L. MEIROVITCH, Fundamentals of Vibration, McGraw-Hill, New York (2001).
- C. A. NIXON et al., “A New Method for Experimentally Quantifying Dynamic Deflection of a Cylindrical Structure,” Exp. Mech., 58, 9, 1351 (2018); https://doi.org/10.1007/s11340-018-0425-0.
- C. A. NIXON et al., “The Dynamic Response of a Wire-Wrapped Pin—A New Expeirmental Method,” Trans. Am. Nucl. Soc., 115, 1692 (2016).
- C. A. NIXON, “On the Flow-Induced Vibration of Solitary Wire-Wrapped Cylinders in Axial Flow,” PhD Dissertation, p. 165, Oregon State University, School of Nuclear Science and Engineering (2018).
- C. A. NIXON et al., “On the Fluid Structure Interactions of a Wire-Wrapped Pin Bundle,” Nucl. Technol., 206, 2, 218 (2020); https://doi.org/10.1080/00295450.2019.1649583.
- C. A. NIXON et al., “On the Fluid Structure Interactions of a Wire-Wrapped Pin Bundle,” Proc. Int. Topl. Mtg. Advances in Thermal Hydraulics, Xian, China, November 11–15, 2018, American Nuclear Society (2018).