
 ?Mathematical formulae have been encoded as MathML and are displayed in this HTML version using MathJax in order to improve their display. Uncheck the box to turn MathJax off. This feature requires Javascript. Click on a formula to zoom.
Abstract
In this work, laser heating is used to experimentally investigate the high-temperature behavior of the U-Fe-Zr-O system using arc-melted samples with various nominal compositions. Three-phase transitions are observed in the vicinity of ~1100, ~1700, and ~2200 K. Principal component analysis of the phase transition temperatures in the course of laser-heating thermal cycling indicates that the phase transition around ~1100 K is driven by the interaction of stainless steel (SS) with metallic U, the phase transition around ~1700 K by the melting of stainless steel, and the phase transition above ~2000 K by the eutectic melting of UO2. The results also reveal two hitherto overlooked interactions in the U-Fe-Zr-O system, which could have severe consequences for the containment of corium inside the reactor pressure vessel (RPV). First, the phase transition temperatures of the samples varied extensively as a result of the laser-driven rapid thermal cycling. Variations of up to 390 K were observed in the phase transition temperatures, suggesting that depending on the initial conditions of corium formation, the corium-driven ablation of the RPV wall could commence significantly earlier than the current state-of-the-art severe accident codes would predict. Additionally, evidence of a large exothermic reaction between zirconium and molten steel was observed upon SS melting. Such phenomenon may also be driven by material segregation during fast heating and cooling. If such a mechanism is activated during a severe nuclear accident, it can have an important impact on the overall thermal balance of the RPV.
I. INTRODUCTION
Melting of the core materials in a nuclear light water–cooled reactor (LWR) is one of the harshest consequences of a loss-of-coolant accident (LOCA). As the temperature in the fuel rises in the absence of sufficient cooling, the structural and fuel elements progressively reach their melting points to form complex molten mixtures that contain an abundance of chemical elements. Because of gravity, these mixtures relocate, eventually finding their way to the lower head of the reactor pressure vessel (RPV) to form a molten pool referred to as in-vessel corium.Citation1
Once a severe nuclear accident has progressed to complete meltdown of the core, the melts of the fuel elements, primarily composed of UO2, ZrO2, Zr, the structural materials in the fuel elements, and the fission products (FPs), are incorporated into the molten pool. Because of the high radioactivity of the FPs, the corium generates an amount of heat large enough so that if reactor cooling is not restored, temperatures above 3000 K can be reached in the RPV (CitationRef. 2). Because such temperatures exceed by far the melting points of the structural components in contact with the corium—primarily the stainless steel (SS) that comprises the RPV walls—extensive care must be taken to prevent the corium from melting the RPV walls and escaping to the environment.
As a mitigation plan to prevent the consequences of corium formation, the in-vessel retention (IVR) strategyCitation3 relies on cooling the corium by reflooding the interior of the RPV or, when reflooding is not possible or suitable, by circulating an emergency coolant loop along the exterior of the wall. The objective of IVR is to prevent the melting of the RPV walls, which would lead to the release of the very hot and radioactive corium to the next containment and ultimately to the environment. By contrast, ex-vessel retention (EVR) strategies are focused on restraining the mobility of corium outside the core following an RPV breach.Citation4
To ensure the success of the IVR and EVR strategies, the thermodynamic behavior of the chemical systems that comprise the corium must be understood at temperatures as high as 3000 K. Although the complete composition of corium includes much of the periodic table, it primarily consists of uranium (and plutonium in specific reactors) from the fuel elements, zirconium from the fuel cladding, iron (along with small amounts of chromium and nickel) from the structures, and oxygen. The presence of oxygen in the corium leads to the segregation of the molten pool into two immiscible phases: the metallic phase, consisting of Zr, Fe, traces of Cr and Ni, and possibly some metallic U, and the oxide phase, consisting of UO2 and ZrO2. The immiscibility of the two liquid phases enforces the stratification of the corium, where one of the two phases occupies the top and the other the bottom of the pool. As it is denser, in most scenarios the metallic phase sinks to the bottom, leaving the oxide phase on the surface.Citation2,Citation5
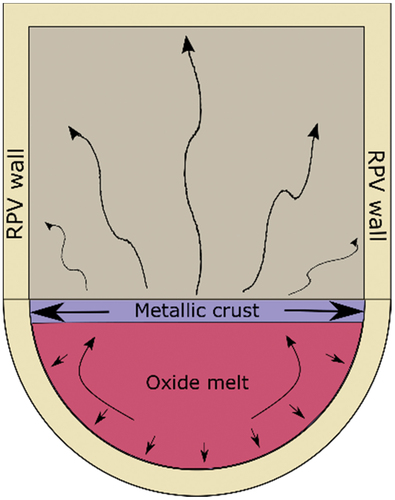
The ability of the molten pool to melt the RPV walls lies in the possibility to configure itself in such a way that it dissipates a critical amount of heat to a narrow region on the RPV wall, ablating the wall across its full thickness. Depending on the initial conditions of corium formation and the corium composition, the Zr in the metallic phase that is oxidized and enters the oxide phase can invert the weight balance between the two phases. Once the metallic phase becomes lighter than the oxide phase, it emerges to the top to form a thin metallic crust on the corium surface. This configuration is particularly threatening since it can lead to local degradation of the RPV. This risk results from the low thermal emissivity and high thermal conductivity of metallic phases. Once the metallic corium crust is formed, the majority of the heat released by the corium is dissipated by conduction to the RPV wall along the perimeter that surrounds the corium surface; this configuration is known as the focusing effectCitation2,Citation6,Citation7 (). In this scenario, the heat flux on the wall can exceed the critical heat flux of the RPV and cause local dryout on the exterior, where the IVR cooling efforts are focused. This dryout hinders cooling of the RPV and results in local melting of the wall, allowing the corium to escape.
Fig. 1. Representation of the stratification in corium in the lower head of the RPV that leads to the focusing effect. The majority of the dissipative heat flux by the metallic crust is by conduction to the perimeter of the RPV (after).Citation2
To best safeguard against the release of radioactive matter in the environment, large-scale multiphysics computer codes, such as MELCOR (CitationRef. 8) and ASTEC (CitationRef. 9), are used to predict the progression of severe nuclear accidents across multiple scenarios. To predict the possible failure modes of IVR and EVR, these codes incorporate multiple engineering and physics analysis frameworks, including thermal hydraulics, mechanical integrity, and radionuclide behavior, and thus require extensive experimental benchmarking to improve their accuracy. Particularly with regard to material degradation, knowledge of the thermodynamic behavior of the structural components and the corium from 1200 K up to 3000 K is needed. As the metallic corium crust is primarily composed of Fe, Zr, and possibly U, the thermodynamics of the U-Fe-Zr system can be used as a good approximation of the full corium crust system.Citation1,Citation2 However, knowledge of the behavior of the U-Fe-Zr system at temperatures above 1500 K is scarce.
In this work, we report the results of laser-heating experiments performed on samples containing U, Zr, nuclear-grade steel, and UO2 at 1000 to 2400 K, to investigate their high-temperature phase transitions, whose impact on the thermal equilibrium of the RPV is not yet fully investigated.
II. METHODS
II.A. Sample Fabrication
presents the chemical compositions of the samples used in this study to simulate, on a laboratory scale, the formation of corium. Samples with varying compositions were fabricated by adding to SS different fractions of iron, zirconium, uranium, and uranium dioxide to simulate the behavior of possible zirconium-, uranium-, and iron-rich regions in the metallic corium phase. The current compositions were conceived to encompass a broad spectrum of situations that may be produced during corium formation. The SS used in the present samples was directly extracted from a real specimen of reactor steel. Therefore, it has the same chemical composition and underwent the same heat treatments as the alloy structural SS used in the boiler and RPV of certain LWRs currently in operation. It includes a high concentration of the alloy elements Mn, Ni, Mo, Cr, C, Si, P, and S to achieve higher tensile strength and yield strength compared to carbon structural SS, as well as adequate toughness and plasticity.
TABLE I Nominal Chemical Compositions of Arc-Melted Samples
The samples were fabricated by argon arc-melting mixing of steel, metallic uranium, uranium dioxide, zirconium alloy, and iron. NF 18MND5 steel samples used for the sample fabrication were procured by Electricité de France within the Severe Accident Facilities for European Safety Targets (SAFEST) European Research Project. Such steel represents well the properties of the material commonly used for RPVs. Other metallic samples were directly bought or provided by the Joint Research Centre (JRC) Karlsruhe. Zirconium alloy samples were of standard purity; i.e., they contained around 2 mol % of Hf. Metallic U samples were taken from the JRC repository. All metal samples were stored under high-purity argon and electrolytically purified from oxygen impurities prior to arc melting. Metal balls were combined by arc melting in the ratios specified in . Secondary vacuum (from 10−Citation5 to 10−6 mbars) and pure argon (6 N) purging were performed at least two times to remove the oxygen from the furnace. A fragment of additional sacrificial zirconium was placed in the furnace to act, once melted, as an oxygen getter. The thus obtained mixed “button” was remelted a few times to ensure a good homogeneity. Samples were annealed at 1273 K for 3 weeks in sealed silica tubes, followed by quenching to room temperature. displays a backscattered electron (BSE) image of sample F after several arc-melting and resolidification cycles.
Fig. 2. SEM BSE image of arc-melted sample F. Uranium-rich and Zr-rich phases are brighter in the image. Different phases are immiscible at the solid state but become fully mixed when the sample is heated and liquified. Electron acceleration voltage: 20 kV.
After several repetitions of melting and mixing, the final material was cut into pellets of ~2 cm in diameter and a few millimeters in height. Details about the arc-melting procedure are reported in CitationRef. 10. This procedure was repeated for the fabrication of all samples used in the study. In the case of sample D, the uniform mixing of the components was only partially successful as the arc melting of UO2 resulted in explosive sputtering. In this case, the sample had to be further homogenized by some laser-melting cycles, although larger uncertainty on its composition remained. Conformity of the sample compositions obtained by arc melting with the nominal ones was checked with the help of scanning electron microscopy (SEM) and energy-dispersion X-ray (EDX) (SEM-EDX) analysis on local spots (see description of this method in Sec. II.B). The average compositions resulted in being the same as the nominal ones within a cumulative instrumental uncertainty of ±5%, also taking into account the mostly irregular sample surface geometry.
Although UO2 was present at high concentration only in sample D, Raman spectroscopy of the samples revealed a limited presence of UO2 in all samples as a result of the oxidation of uranium when exposed to air for a short period during the mounting in the laser-heating vessel before the latter was filled with inert gas.
II.B. Experimental Techniques
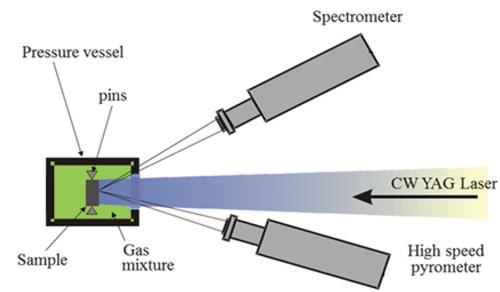
The samples were thermally treated with laser heating while their temperature evolution was followed with the help of fast radiance spectrometry, according to the laser-heating and spectral analysis (LHASA) technique.Citation11 In a typical LHASA experiment, the sample is placed in a pressure vessel that is first pumped down to 10−3 bars and then filled with argon [0.5 parts per million (ppm) O2] to a maximum pressure of 3 bars. The sample surface exposed to laser irradiation is then rapidly heated with the use of a 1064-nm, 4.5-kW continuous wave Nd:YAG laser, reaching temperatures above 2000 K within a few milliseconds. Following the end of the laser pulse, the sample is allowed to cool down to room temperature. The sample is held in place with graphite screws that minimize the dissipation of heat by conduction to any external containment so that the cooling of the sample can be approximated as being purely radiative. During both heating and cooling, the intensity of the radiation that is naturally emitted from the sample heated surface due to its elevated temperature is recorded with one fast, narrow-band radiation spectrometer and a second slower, wide-band radiation spectrometer. The experimental apparatus used in the present study is shown in .
Fig. 3. The experimental apparatus used in the present research. The sample is placed inside a pressure vessel under argon or a mixture of Ar and H2 at 3 bars, fixed in place with graphite screws that minimize heat dissipation by conduction. The 1064-nm, 4.5-kW Nd:YAG laser heats the sample while the pyrometer and the spectrometer measure the intensity of the sample’s spectral radiance. Schematic adapted from Pavlov et al.Citation32 with permission from the authors.
The present technique permits a thermal analysis of the material, which is near the sample surface, up to a depth of a few tens of micrometers, depending on the thermal and optical characteristics of the analyte. On such a length scale, a reasonable temperature homogeneity is predicted by thermal models, especially in essentially metallic, high-thermal-conductivity samples like the current ones. The background idea of such an approach is the self-containment of the melted material, which is thus protected from the contamination of any external support. What happens inside the sample bulk beyond the reported depth can be estimated only with the help of complex thermal models,Citation12 combined with ad hoc experiments aimed at measuring the surface temperature, for example, at various points of a regularly shaped sample. Such analysis is beyond the scope of the present investigation.
The thermal radiation emitted from the heated surface of the sample is measured in the form of the spectral radiance , that is, the flux of the emitted radiation in the direction normal to the surface, per unit wavelength, per unit surface. According to Planck’s law of blackbody radiation, the spectral radiance of a blackbody is related to its temperature according to the relation
where and
are the first and second radiation constants, respectively;
is the radiation wavelength; and T is the temperature of the blackbody.Citation13
The temperature of a real body can be measured by comparing its spectral radiance for wavelength , temperature T, and direction with respect to its surface, to the spectral radiance that a blackbody would emit for the same parameters. The Kirchhoff law relates the spectral radiance of a real body to that of a blackbody with the use of the spectral directional emissivity:
which can take values from 0 for a nonemitting body to 1 for an ideal blackbody.
At short wavelengths, Wien’s approximation can be applied to EquationEq. (1(1)
(1) ), such that
which can be rearranged as
By combining EquationEq. (4)(4)
(4) with EquationEq. (2
(2)
(2) ), the relation between the temperature of a real body
and that of a blackbody emitting an equal spectral radiance
becomes
The radiance of the sample is recorded as a function of time with high resolution with a fast pyrometer with 10-μs settling time operating at 655 nm, which was first calibrated against a National Institute of Standards and Technology–referenced tungsten filament lamp at temperatures up to 2400 K and a graphite blackbody up to 3300 K. Simultaneously, a multichannel spectrometer with 1-ms integration time, also calibrated against a blackbody, measured the radiance of the sample at 180 distinct wavelengths between 550 and 850 nm. By plotting the distribution of against
in the range 550 to 850 nm and applying a linear fit, the spectral emissivity
can be extracted using EquationEq. (5)
(5)
(5) . Although the spectral emissivity is not guaranteed to be independent of wavelength in the range 550 to 850 nm, the gray body approximation, which models the emissivity as independent of wavelength in this range, has been shown to be at least as accurate as a variety of empirical wavelength-dependent models.Citation14
Although the fitting procedure on the spectrometer measurements can also extract the true temperature of the sample, its time resolution is insufficient for accurate thermodynamic studies since the memory buffer of the spectrometer could only store up to 256 time steps. Instead, the gray body spectral emissivity extracted from the linear fit for each of the 256 time steps can be combined with the radiance measurements of the fast pyrometer to deduce the true temperature of the sample over an entire melting/freezing cycle as per EquationEqs. (4)(4)
(4) and (Equation5
(5)
(5) ).
Wien’s approximation is valid as long as (CitationRef. 13). As the sample surface temperature in typical LHASA experiments reaches 3000 K, the application of Wien’s approximation in LHASA is valid for wavelengths up to ~4800 nm. Therefore, the 550- to 850-nm operating range of the spectrometer falls well within the valid range of the approximation.
The most significant uncertainty sources related to the laser heating and multichannel pyrometry have been combined according to the independent error propagation law [EquationEq. (6(6)
(6) ))] and expanded to yield relative temperature uncertainty bands corresponding to 2 standard deviations (
coverage factor). These uncertainty components stem from our current temperature-scale definition
(i.e., the uncertainty in the pyrometer calibration), the spectral emissivity assessment
, and the experimental data scatter on the current phase transition (radiance) temperature data
, the latter being the main source of uncertainty:
The resulting cumulative uncertainty is of the order of ±20 K at 2000 K; thus, an uncertainty of ±1% has been used for the values of temperature in this work.
In addition, Raman spectra were measured on the investigated samples in order to quickly and effectively check the possible formation of oxides on the surface of the present metallic samples after exposure to air. Such Raman measurements were performed at room temperature with a Horiba Jobin-Yvon T64000 spectrometer using a 647-nm Kr+ laser excitation source. The spectral position was calibrated against the T2g excitation of a silicon single crystal, set at 520.5 cm−1 (CitationRef. 15), with an uncertainty of ±1 cm−1. A 50× objective was used to illuminate the sample and collect the backscattered light. Measurements were performed with 10 mW of incident laser power.
Moreover, SEM was the technique employed to record images of the in-vessel corium simulants. Such sample analysis was locally performed by means of SEM-EDX analysis in order to estimate the elemental composition of the formed phases. These analyses were carried out with a Philips XL 40 scanning electron microscope, equipped with tungsten filament, and a secondary electron (SE) and BSE detector or a Vega-Tescan scanning electron microscope equipped with an Oxford EDX and wavelength dispersive X-ray spectrometry system. Samples were mounted on metallic sample holders fixed by screws or with carbon tape (the conductivity of which helped avoid specimen charging). Both SE and BSE modes were employed to produce the SEM images. Particularly, the latter permits the distinction between darker areas or phases richer in lighter elements, in this case Zr-rich (ZZr = 40), and brighter regions richer in heavy elements, such as U (ZU = 92) areas. In addition, EDX measurements were used to specify the compositions of the materials at various spots (~5-µm-diameter point analyses), with a relative accuracy of ±5%.
The LHASA method is an established approach for the study of the very-high-temperature thermodynamics of materials with high melting pointsCitation16–19 while the rapid heating inherent to the technique can also be used to emulate thermal processes relevant to severe nuclear accidents.Citation11
By monitoring the surface temperature of the sample with high time resolution, a characteristic thermal arrest appears on the thermogram when the sample undergoes a thermodynamic phase transition at the spot monitored by the pyrometer during the thermal cycle.Citation20 Because the heating stage is driven by a high-power laser, the rate of change of temperature during heating is typically too rapid for thermal arrests to be resolved on the thermogram. Instead, the temperatures of the thermal arrests are more reliably identified during the radiative cooling stage. However, the cooling rate can often also be high. As a result, significant undercooling hinders the quantitative determination of the latent heat of phase transitions, although the thermal arrest temperatures can be identified. Therefore, only qualitative observations can be made regarding the relative magnitudes of latent heat for the phase transitions. Despite the undercooling effects, thermodynamic equilibrium thermal arrests have been confirmed with the current method in secondary reference materials, such as tungsten and molybdenum.Citation11
In the present study, the samples were subjected to rapid thermal cycling by a series of square laser pulses of a few hundreds of milliseconds in duration each, with a few seconds between successive pulses ().
Fig. 4. The temperature response of sample E following a sequence of laser-heating pulses, representative of the sequences applied to all samples in the current study. The temperature shown on the y-axis corresponds to in EquationEq. (5
(5)
(5) ), as it has not been corrected using the sample’s spectral emissivity.
The exact pulse duration and frequency were optimized for each sample to achieve maximum thermogram resolution—samples with lower emissivity require longer cooling periods; therefore, in such cases the interval between successive pulses was chosen to be longer; the chosen intervals were typically 2 to 5 s between pulses. Additionally, samples with high thermal conductivity require longer pulse duration to achieve higher maximum temperature at the laser spot; the chosen pulse durations were typically a few hundreds of milliseconds. The total number of laser pulses that each sample was subjected to was not constant, as each sample lost mechanical integrity at a different maximum number of thermal cycles. The first laser pulse acts somewhat as a fast and strong annealing process, in which the sample is homogenized and residual thermal stresses of the fabrication procedure are released. In several cases, the intervals between successive laser pulses were reduced in order for the sample to remain at an intermediate temperature (around 1500 K) between pulses. This feature reduced the risk of sample breaking during the heating and cooling cycles and allowed the repetition of up to several tens of laser pulses on the same sample. Thanks to these long series of pulses, a detailed study of the phase transition temperature evolution and stabilization could be realized.
To study the impact of hydrogen-rich gases in contact with the samples that are expected to form within the RPV during a severe nuclear accident, each sample was studied under two atmospheres: Ar (0.5 ppm O2) and Ar + 5% H2. To trace the impact of hydrogen availability in the hydrogen-rich atmosphere, tests were performed with freshly refilled Ar+H2, with Ar+H2 unreplenished for 10 laser pulses or more, and also under a constant flow of Ar+H2.
III. RESULTS AND DISCUSSION
III.A. Phase Transitions
In all samples except for sample B (which contained only SS and Zr), a medium-temperature transition at ~1700 K and a high-temperature transition in the vicinity of ~2200 K were observed. In samples C and E, also a (relatively) low-temperature transition at ~1100 K was observed. In sample D, which was the only sample containing a significant concentration of UO2, only the medium-temperature and an additional phase transition above 3100 K were observed; the very-high-temperature transition corresponded to the well-known melting point of UO2 at ~3140 K.
In sample B, only two phase transitions in the vicinity of the medium-temperature phase transition were observed. The absence of the low- and high-temperature phase transitions from sample B, containing neither U nor UO2, indicates that the chemical nature of those two transitions in the other samples is related to the presence of uranium.
III.A.1. Variations in the Phase Transition Temperatures
The most interesting observation on the phase transitions in the U-Fe-Zr-O system was the nonequilibrium behavior of the transition temperatures. In all samples except sample B, the absolute temperature at which each phase transition occurred varied in the course of the laser-pulse sequence. demonstrates this phenomenon for the medium-temperature phase transition of sample F, heated by a sequence of four laser pulses under argon and a hydrogen-rich atmosphere. A similar variation in temperature was observed for all phase transitions in all samples under both Ar and Ar+H2; the temperature evolution could not be observed in sample B, as the transition temperatures could not be reliably determined due to a large exothermic release (see Sec. III.B)
Fig. 5. Temperature variation of the medium-temperature phase transition in sample F, heated by four laser pulses under (a) Ar and (b) a mixture of Ar and H2. Both the absolute values of the transition temperatures and their variation during the pulse sequence vary as a result of the different atmosphere. The high-temperature phase transition is also visible as a smaller feature a few hundred degrees above the highlighted transition.
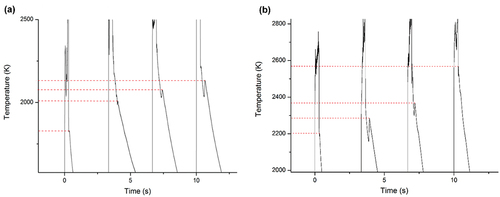
The difference between the maximum and the minimum temperatures was not common for all phase transitions in all samples. Within a single laser-heating cycle, the difference between the maximum and the minimum transition temperatures was only 15 K for the high-temperature phase transition in sample C under Ar+H2 while for the medium-temperature transition in sample E under the same atmosphere, it was 390 K (see ). To the knowledge of the authors, the variation in the phase transition temperatures of corium under rapid heating above 1000 K has not been considered so far in the large-scale scenario codes that are used to inform severe accident mitigation strategies. As a result, it is important that this nonequilibrium behavior be carefully studied. Inaccurate predictions of the phase transition temperatures by such a margin could have nontrivial implications for nuclear safety in the event of a core meltdown accident.
Fig. 6. Sample E under Ar+H2. (a) Complete thermogram in the course of the experiment. (b) Close-up view of the medium-temperature phase transition. The minimum temperature of the thermal arrest in the course of the laser-heating experiment is 1675 K while the maximum is 2065 K. A gray-body spectral emissivity of 0.43 was used to extract the true temperature of the sample, deduced according to the method described in Sec. II.B.
It must be noted that because accurate extraction of the true sample temperature using radiation thermometry relies on the spectral emissivity value that is assumed for the material (see Sec. II.B), it could seem credible that the apparent variations in the phase transition temperatures are in fact variations in the spectral emissivity of the samples that have been inadequately accounted for. However, by using EquationEq. (5(5)
(5) ), one can calculate that in order to account for temperature variations as high as 390 K in the vicinity of 1500 K, a difference of up to 30% in the emissivity of the samples would be required, in the current emissivity range. The present samples were insulated from dissipating heat by conduction with the use of graphite pins, and their convective heat flux can be assumed to remain constant and negligible. A difference of up to 30% in the emissivity of a material between two thermal cycles would result in the cycle with the lower emissivity to have a considerably longer cooling period. However, as demonstrated in , this was not the case; the heating-cooling cycles that showed a variation in the temperature of a phase transition still exhibited an approximately equal rate of cooling, which indicates that no significant change in the emissivity took place during the laser-pulse sequence. Additionally, the varying undercooling and latent heat of the phase transition indicate that the variation in temperature might be accompanied by a variation in other phase transition properties. Therefore, the observed transition temperature variations over successive thermal cycles cannot be ascribed to an artifact of varying emissivity. It can only be reasonably attributed to a thermodynamic process that needs to be understood.
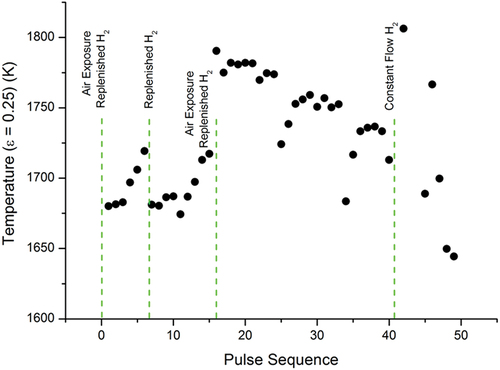
The impact of the hydrogen-rich atmosphere on the temperature evolution of the low- and medium-temperature phase transitions in sample E is shown in , respectively. They demonstrate how the temperatures of two different phase transitions evolve for consecutive rapid thermal cycles under a hydrogen-rich atmosphere. illustrate that there is only a limited correlation between the evolution of the two phase transitions, suggesting that the responses of the two phase transitions as a result of the thermal cycling and the atmosphere require extensive studies in order to be understood.
Fig. 7. Temperature evolution of the low-temperature phase transition in sample E under Ar+H2. Each dot represents the temperature at which the phase transition occurred. The total number of laser-heating thermal cycles that the sample had undergone up to the time of measurement for each dot is given on the x-axis. When the pressure vessel was vented and opened, the sample was exposed to air. At the H2-replenisment stages, the pressure vessel was brought down to vacuum and then refilled with Ar+H2 without exposure to air.
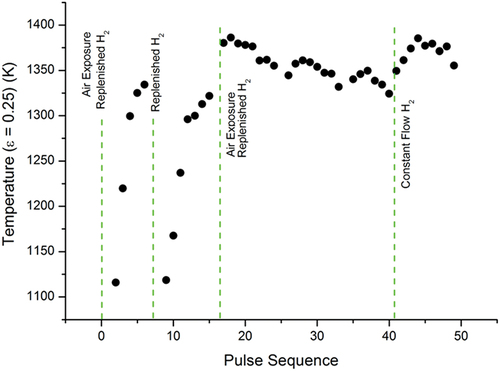
Fig. 8. Temperature evolution of the medium-temperature phase transition in sample E under a hydrogen-rich atmosphere. Each dot is plotted as in .
The phase transition temperatures reported in through 8 can be interpreted based on the thermodynamic equilibrium phase diagrams available in the literature. For example, a first reference for sample E is the Fe-U binary phase diagram,Citation21 whereby the presence of carbon and other additives in SS has a negligible impact on the phase transition temperatures compared to the current instrumental uncertainty. Based on the first-approximation Fe-U picture, one can infer that in general the changes observed over successive shots in the low- and medium-temperature transitions are probably linked to out-of-equilibrium oscillations of the sample surface composition involving the segregation of pure iron (melting point around 1800 K), the UFe2 intermetallic (melting point around 1500 K), and pure uranium (melting point around 1400 K). However, the occurrence of higher-temperature transitions, well beyond 2000 K, implies that the exposure to air (sample oxidation) and the presence of hydrogen in the pressurized vessel (sample reduction) certainly have an effect on the large high-transition-temperature variations observed. For this reason, the observed phase transitions and their variations have been grouped using the principal component analysis (PCA) approachCitation22 in order to identify clusters of experimental points. These points may be linked to particular features of the relevant phase diagrams, in particular, of the U-Fe-O system as a first approximation.
III.A.2. Principal Component Analysis
The magnitude of temperature variation for each phase transition depended on the composition of the sample and the atmosphere. As mentioned earlier, the smallest variation in temperature for a phase transition during a single-laser-pulse sequence was only 15 K while the greatest was 390 K. As a result, the temperature variations across all phase transitions in all samples may not be readily attributed to the same chemical interaction between the components.
To gain insight into the chemical nature of the phenomenon and the chemical components giving rise to each phase transition, PCA was performed on the temperature variations. In PCA (CitationRef. 22), a series of datasets is projected onto the eigenvectors of the data’s covariance matrix. By plotting the data along fewer principal components than the initial dimensions of the datasets, the effective dimensions of the data are reduced. Underlying patterns in the way the datasets are related to each other can thus be discovered by tracing the formation of clusters of data points on the PCA plot.
The purpose of PCA in the present work was to gain insight into the chemical nature of each phase transition as well as into the mechanism driving the temperature variations. The covariance matrix was constructed from datasets of phase transition temperatures in the course of laser-pulse sequences.
Each sample was subjected to a number of laser-heating sequences, each with a different total number of laser pulses, depending on the structural integrity of each sample under the thermal stress of rapid thermal cycling. As the calculation of covariance requires equal sample sizes, not all phase transitions recorded in the course of the experimental campaign could be used. Each dataset was constructed from phase transition temperatures recorded in a single laser-heating experiment so that temperatures originating from different laser-heating sequences were not mixed into the same dataset. The dataset length was chosen to be four laser pulses as a balance between utilizing enough data points and incorporating as many datasets as possible (temperatures from laser-heating sequences with more than four laser pulses were sliced into consecutive groups of four and used as separate datasets). Phase transition temperatures recorded during sequences with three laser pulses or less were not included in PCA.
The covariance matrix was constructed from 22 datasets of length four. Despite the small sample size for each dataset, the difference in temperature variation between the datasets was pronounced enough to produce noticeable clustering on the PCA plot. shows a subset of the datasets. Each entry in a dataset corresponds to the measured phase transition temperature following a laser-heating pulse in the four-pulse sequence. Complete lists of phase transition temperatures used in PCA are given in in the Appendix, grouped by sample and atmosphere. Note that not all observed phase transitions were included in the PCA.
TABLE II Subset of the Datasets Used in the PCA Covariance Matrix
In , the projections of the datasets along principal components 1 and 2 are plotted. Each dot represents a dataset similar to the ones shown in , following the principal component change of basis. In addition to the phase transitions of more complicated systems, datasets of the relatively simpler samples A and D were used as reference points on the PCA plot. For sample A, the plotted phase transition corresponds to the melting point of SS, as identified in . Similarly, for sample D, consisting of SS and UO2, the phase transition was identified as the melting point of UO2.
Fig. 9. PCA plot: projections along principal components 1 and 2 of the variations in phase transition temperatures during a sequence of four laser pulses. The units of each axis carry no physical meaning as they represent the principal components, i.e., the eigenvectors of the covariance matrix. Each dot is labeled according to the sample and the phase transition in question. If the atmosphere of the measurements was hydrogen rich, it is noted in parentheses. Distinct dots with an identical label represent variations in phase transition temperatures across different four-pulse sequences applied on the same sample.
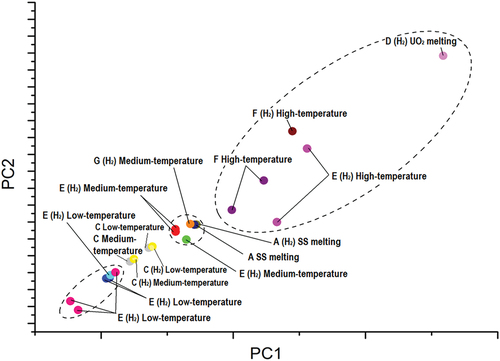
Three loosely connected clusters can be identified. First, a cluster is noted in the vicinity of the reference data point “A SS melting” in . It is reasonable to assume that the phase transitions represented by the data points in this cluster are governed by the same chemical dynamics that contribute to the variation of the melting point of the nuclear-grade SS.
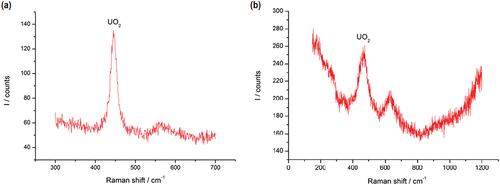
Similarly, the high-temperature phase transitions in samples F and E that are approaching the reference data point “D (H2) UO2 melting” in can be understood to vary due to the same chemical interaction that causes the variation in the melting point of UO2 in sample D. Although samples E and F do not nominally contain UO2, they both contain metallic U in high concentration. Following extended exposure to air prior to the experiments, a nonnegligible quantity of U was oxidized into forming UO2, giving rise to the high-temperature phase transition data points that aggregate toward that of sample D. This assumption is corroborated by Raman spectra recorded on samples E () and F () following significant exposure to air. The presence of UO2 in both samples is evident.Citation23
Fig. 10. Raman spectra of (a) sample E and (b) sample F, after prolonged exposure to air. The peak at ~445 cm−1 corresponds to the vibrational line in UO2 (CitationRef. 23).
A third, loosely connected, cluster is identified at the bottom left of , where the low-temperature phase transitions in sample E are concentrated, approached by the low- and medium-temperature transitions in sample C. As sample E contains a high concentration of metallic U, it is reasonable to assume that the variation of the low-temperature phase transition in samples E and C stems from a nonequilibrium interaction between SS and U resulting in the segregation, during the solidification process, of Fe-rich mixed U-Fe compositions.
It must be stressed that because of the structure of the datasets analyzed with PCA, the insight gained by tracing clusters on the plot is primarily related to the mechanisms behind the variation in the transition temperatures. PCA positions each data point on the plot according to the covariance of the corresponding dataset with respect to all other datasets used in the analysis. As a result, the absolute values of the temperature for each phase transition have a lower impact on the clustering of data points on the plot. Instead, it is the trends of temperature variation for each phase transition that influence most heavily the position of the data points on the PCA plot.
The clusters in indicate that the low-temperature phase transition in the U-Fe-Zr-O system that occurs at ~1100 K is driven by the interaction of U and SS. The low-temperature transitions can be ascribed to the segregation of a U-richer phase, like a mixture of the U6Fe-UFe2 intermetallics.Citation21 In fact, although low-temperature phase transitions do exist also in the U-Zr and U-Fe systems [in particular, related to α→β Zr around 1130 K (CitationRef. 24)], no such low-temperature thermal arrests were detected in Zr-containing samples, such as samples B, F, and G. Similarly, the medium-temperature phase transition that occurs in the vicinity of ~1700 K is caused by the melting of SS. The high-temperature phase transition that occurs above 2100 K is driven by the eutectic melting of UO2 or the interaction between UO2 and molten SS. The variation in temperature for these phase transitions might be related to the formation of eutectics that are hindered or accelerated by the presence of secondary factors, such as the presence of oxide and hydride phases. However, these conclusions must be confirmed by more specific studies on the U-Fe-Zr-O system.
III.B. Exothermic Release in the Interaction of SS and Zr
As mentioned earlier, the variation of the phase transition temperatures in sample B, containing only SS and Zr, could not be confirmed due to a large exothermic release. The thermogram of sample B during a sequence of four laser pulses is shown in .
Fig. 11. Thermogram of sample B (80 at. % SS, 20 at. % Zr) during a sequence of four laser pulses under Ar. The y-axis shows the spectral temperature of the sample without conversion to the true sample temperature. A large exothermic release is observed following the second laser-heating thermal cycle. The release of heat sustains the sample at an elevated temperature for tens of seconds following the last laser-heating pulse.
The temperature in was not converted to the true sample temperature as per EquationEq. (5)(5)
(5) to ensure that any conclusions made based on the thermogram do not stem from an erratic use of emissivity. While only a very small release, if any, can be identified during the first laser-heating cycle in , following the second laser pulse, a large exothermic release was initiated within the material that sustained the sample at very high temperatures between the laser-heating pulses. Following the end of the last laser-heating pulse, the sample remained at temperatures above 1000 K for more than 10s (the measurement threshold of the pyrometer was ~950 K for a perfectly emitting blackbody; bodies with
must be at higher temperatures to emit spectral radiance of the same intensity).
In , the thermogram of sample B following a single laser-heating event without prior shot history is compared to similar single-shot events of a pure sample of nuclear-grade SS and a sample of Zircaloy-4. The laser pulse duration for sample B and the SS sample was 1500 ms while for Zircaloy-4 it was 1600 ms. For all three samples, the laser power during the pulse was 300 W. As a result, the energy delivered to the samples during their respective laser pulse was approximately equal. From the thermogram comparison, it is evident that sample B remains at very high temperatures for more than 10s, supporting that a highly exothermic process is initiated within the material. This exothermic process can be tentatively ascribed to the large latent heat released by the formation of the Fe23Zr6 – [face-centered-cubic austenite (γ-fcc)] Fe eutectic around 1600 K (CitationRef. 25).
Fig. 12. Thermogram comparison for sample B, a sample of nuclear-grade SS, and a sample of Zircaloy-4 during a laser-heating cycle. The energy values shown on the legend represent the total energy delivered to each sample by the laser pulse. The measured emissivity for each value is shown next to each thermogram.
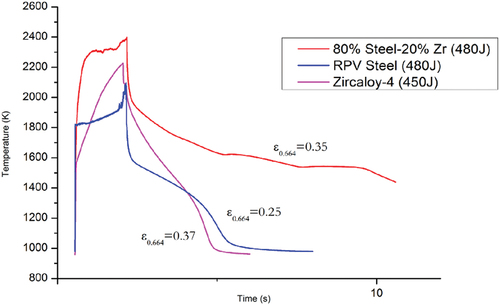
The thermogram of the SS sample also reveals a small release of heat while the Zircaloy-4 sample exhibits no such behavior. The spectral emissivity of sample B was measured at 0.35. The emissivity value used for the SS sample was taken from the emissivity measurement of sample A in this study while for Zircaloy-4 the emissivity of zirconium at 652 nm was used.Citation26
The emissivity of sample B is higher than that of nuclear-grade SS and approximately equal to that of Zircaloy-4. As a result, in the absence of internal generation of heat, the rate of radiative cooling of sample B should have been faster than that of SS and approximately equal to that of Zircaloy-4. As is evident in , however, the radiative cooling of sample B is significantly slower, supporting the existence of an exothermic interaction between the components of the sample.
It is notable that the exothermic process does not initiate during the rapid heating stage while even during cooling, it is activated only as the temperature at the center of the sample (the spot monitored by the pyrometer) falls below 2000 K. Because the melting point of zirconium is higher than that of nuclear-grade SS by a few hundreds of degrees—one can also observe it around 2100 K in the Zircaloy thermogram of —it is hypothesized that two conditions are required for the initiation of the exothermic interaction: first, that the reaction must take place between molten steel and solid zirconium and second, that the reaction must be allowed to develop for at least a few hundreds of microseconds. As mentioned above, the formation of the well-known Fe23Zr6 – (γ-fcc) Fe eutectic could be a reasonable explanation of the observed heat release.
Incidentally, if an exothermic reaction between solid Zr and molten SS was to commence in the course of a core meltdown nuclear accident, this may have consequences for the integrity of the RPV and its capacity to contain the corium. During a severe nuclear accident, two scenarios of extended interaction between molten steel and solid Zr can be predicted.
First, in the early stages of a LOCA in a reactor with B4C control rods, the supporting structural components of the control rods that are manufactured from SS can form a B4C-steel liquid eutectic at ~1500 K, far below the nominal melting point of B4C at 3036 K (CitationRef. 27). As the temperature of the control rods exceeds the eutectic melting point, the B4C-steel liquid may flow downward under the effect of gravity, potentially coming into contact with the Zircaloy-4 fuel cladding that is still below its melting point.Citation2 So far, the primary threat of this interaction has been perceived to be the formation of a liquid Fe-Zr eutectic at temperatures much lower than the melting point of Zircaloy-4 (CitationRefs. 2 and Citation28). However, the effect of an exothermic reaction would need to be assessed for the progression of the accident.
Second, during the later stages of a LOCA, if the corium melt that has relocated to the lower head of the RPV remains undercooled, it will begin to ablate the RPV wall and incorporate the molten steel to the melt. As a result of the wall ablation process, a substantial quantity of SS is expected to enter the corium melt. Seiler et al.Citation6 estimated that the corium may contain up to 10 tons of SS for a ratio of 60% between Zr and ZrO2 in the melt while it may contain up to 25 tons if the ratio reaches 70%. For such quantities of SS, an exothermic reaction similar to that observed in would have significant consequences for the integrity of the RPV and the containment of the corium.
The exothermic reaction between molten steel and solid zirconium has been investigated in depth in previous studies,Citation28–30 which suggested that the exothermic release coincides with the formation of a Fe-Zr eutectic. However, the dissolution tests that Argyropoulos and Sismanis performedCitation28 could not quantify the magnitude of heat release, as the rise in temperature was high enough to destroy their thermocouples. Additionally, the tests demonstrated that the presence of oxygen in the system delayed the activation of the exothermic reaction, resulting in a higher activation temperature for increasing oxygen content.
Overall, quantifying the consequences of the reaction on the integrity of the RPV during a severe accident requires detailed knowledge of the chemical composition of corium. Nevertheless, the impact of the reaction has not been considered in a severe nuclear accident context so far, with the exception of the recent VITI-CORMET investigation on the interaction of molten steel and suboxidized corium crust,Citation31 where no significant rise in temperature as a result of a steel-Zr interaction was reported.
IV. CONCLUSIONS
In this work, near-surface laser heating and fast pyrometry measurements performed with the LHASA technique were used to identify high-temperature material interactions that might affect the integrity of a nuclear RPV and its capacity to contain radioactive materials during a severe nuclear accident. The analysis was performed on arc-melted samples with various nominal compositions in the U-Fe-Zr-O system, including real RPV SS and real UO2 nuclear fuel. The main outcome of this research can be summarized in the following points:
Several phase transitions were observed on the cooling flank of the recorded thermographs over several tens of repeated laser-heating pulses. Their assignment to known phase equilibria, from UO2 melting, to Zr or SS melting, to intermediate two- or three-component transitions or demixing of U-Fe intermetallics was supported by PCA of the numerous experimental data.
The observed phase transition temperatures varied extensively as a result of laser-driven rapid thermal cycling under different experimental conditions.
A remarkable exothermic interaction between zirconium and steel was activated at an elevated temperature (typically above 1600 K), which releases a considerable amount of heat not ascribable to any optics-related artifact.
The two latter material effects have been considered here for the first time in a severe nuclear accident context: the variations in the phase transition temperatures of the U-Fe-Zr-O system as a result of rapid thermal cycling, and the exothermic reaction between molten steel and solid zirconium. These results highlight the need for further research on the high-temperature thermodynamics of the U-Fe-Zr-O system in view of a deeper assessment of IVR strategies and, more in general, of in-vessel corium behavior.
As for the present research context, the current analysis may certainly be completed by further tests on regularly shaped samples (e.g., disks) and a heat transfer simplified model with one liquid phase and one solid phase in order to estimate the bulk evolution of the sample temperature during the laser-heating experiments. Moreover, high-temperature thermocouples instead of radiation thermometry can be used in further experiments for the analysis of low-temperature phase transitions to avoid the uncertainty related to emissivity in temperature measurements.
Acknowledgments
The authors would like to thank Alberto Tosolin and Ondrej Beneš (JRC) and Paul David Bottomley (Collaborative Laboratory for Advance Decommissioning Science) for helpful discussions. Part of this research was funded by the SAFEST European Research Project (grant agreement number 604771).
Disclosure Statement
No potential conflict of interest was reported by the author(s).
References
- R. R. HOBBINS et al., “Molten Material Behavior in the Three Mile Island Unit 2 Accident,” Nucl. Technol., 87, 1005 (1989); https://doi.org/10.13182/NT89-A27692.
- D. JACQUEMAIN et al., “Nuclear Power Reactor Core Melt Accidents: Current State of Knowledge,” Institut de Radioprotection et de Sûreté Nucléaire (2015); https://www.irsn.fr/EN/Research/publications-documentation/Scientific-books/ (current as of Dec. 6, 2021).
- T. G. THEOFANOUS et al., “In-Vessel Coolability and Retention of a Core Melt,” Nucl. Eng. Des., 169, 1 (1997); https://doi.org/10.1016/S0029-5493(97)00009-5.
- B. R. SEHGAL, “Accomplishments and Challenges of the Severe Accident Research,” Nucl. Eng. Des., 210, 79 (2001); https://doi.org/10.1016/S0029-5493(01)00433-2.
- J. M. SEILER et al., “Theoretical Analysis for Corium Pool with Miscibility Gap,” Nucl. Technol., 141, 233 (2003); https://doi.org/10.13182/NT03-A3364.
- J. M. SEILER et al., “Consequences of Material Effects on In-Vessel Retention,” Nucl. Eng. Des., 237, 1752 (2007); https://doi.org/10.1016/J.NUCENGDES.2007.03.007.
- “Main Results of the First Phase of MASCA Project,” Organisation for Economic Co-operation and Development (2004).
- R. O. GAUNTT et al., MELCOR Computer Code Manuals, U.S. Nuclear Regulatory Commission (2001).
- J. P. VAN DORSSELAERE et al., “The ASTEC Integral Code for Severe Accident Simulation,” Nucl. Technol., 165, 293 (2009); https://doi.org/10.13182/NT09-A4102.
- C. A. UTTON et al., “Laser Melting of Uranium Carbides,” J. Nucl. Mater., 385, 443 (2009); https://doi.org/10.1016/j.jnucmat.2008.12.031.
- D. MANARA et al., “Laser-Heating and Radiance Spectrometry for the Study of Nuclear Materials in Conditions Simulating a Nuclear Power Plant Accident,” J. Vis. Exp., 130, e54807c (2017); https://doi.org/10.3791/54807.
- M. J. WELLAND et al., “Co-Development of Experimental and Simulation Methods for the Laser Flash Heating and Melting Technique: The Thermoelastic Effects of UO2,” Int. J. Therm. Sci., 132, 174 (2018); https://doi.org/10.1016/j.ijthermalsci.2018.05.035.
- D. P. DEWITT and G. D. NUTTER, Theory and Practice of Radiation Thermometry, John Wiley & Sons (1988).
- G. NEUER et al., “Critical Analysis of the Different Methods of Multiwavelength Pyrometry,” Temperature: Its Measurement and Control in Science and Industry, Vol. 6, No. 1, pp. 787, J. F. SCHOOLEY, Ed., American Institute of Physics, New York (1992).
- H. RICHTER, Z. P. WANG, and L. LEY, “The One Phonon Raman Spectrum in Microcrystalline Silicon,” Solid State Commun., 39, 625 (1981); https://doi.org/10.1016/0038-1098(81)90337-9.
- D. MANARA et al., “Melting of Stoichiometric and Hyperstoichiometric Uranium Dioxide,” J. Nucl. Mater., 342, 148 (2005); https://doi.org/10.1016/J.JNUCMAT.2005.04.002.
- D. MANARA et al., “New Techniques for High-Temperature Melting Measurements in Volatile Refractory Materials via Laser Surface Heating,” Rev. Sci. Instrum., 79, 113901 (2008); https://doi.org/10.1063/1.3005994.
- H. F. JACKSON et al., “Laser Melting of Zirconium Carbide: Determination of Phase Transitions in Refractory Ceramic Systems,” J. Am. Ceram. Soc., 94, 3561 (2011); https://doi.org/10.1111/j.1551-2916.2011.04560.x.
- O. CEDILLOS-BARRAZA et al., “Investigating the Highest Melting Temperature Materials: A Laser Melting Study of the TaC-HfC System,” Sci. Rep., 6, 37962 (2016); https://doi.org/10.1038/srep37962.
- D. MANARA, “Melting Transition Measurements in Uranium Dioxide,” Warwick University (2004).
- E. E. MOORE et al., “Development of a CALPHAD Thermodynamic Database for Pu-U-Fe-Ga Alloys,” Appl. Sci., 9, 5040 (2019); https://doi.org/10.3390/app9235040.
- H. ABDI and L. J. WILLIAMS, “Principal Component Analysis,” WIREs Comput. Stat., 2, 433 (2010); https://doi.org/10.1002/wics.101.
- D. MANARA and B. RENKER, “Raman Spectra of Stoichiometric and Hyperstoichiometric Uranium Dioxide,” J. Nucl. Mater., 321, 233 (2003); https://doi.org/10.1016/S0022-3115(03)00248-4.
- H. OKAMOTO, “U-Zr (Uranium-Zirconium),” J. Phase Equilib. Diffus., 28, 499 (2007); https://doi.org/10.1007/s11669-007-9155-1.
- N. ZOU et al., “Thermodynamic Assessment and Glass Forming Ability Prediction of the Zr-Fe-Cu System,” Calphad, 64, 175 (2019); https://doi.org/10.1016/j.calphad.2018.12.007.
- A. CEZAIRLIYAN, J. L. MCCLURE, and A. P. MIILLER, “Radiance Temperatures (in the Wavelength Range 523–907 nm) of Group IVB Transition Metals Titanium, Zirconium, and Hafnium at Their Melting Points by a Pulse-Heating Technique,” Int. J. Thermophys., 15, 993 (1994); https://doi.org/10.1007/BF01447109.
- M. STEINBRÜCK, “Degradation and Oxidation of B4C Control Rod Segments at High Temperatures,” J. Nucl. Mater., 400, 138 (2010); https://doi.org/10.1016/J.JNUCMAT.2010.02.022.
- S. A. ARGYROPOULOS and P. G. SISMANIS, “The Solution Kinetics of Zirconium in Liquid Steel,” Steel Res., 68, 345 (1997); https://doi.org/10.1002/srin.199700564.
- P. G. SISMANIS and S. A. ARGYROPOULOS, “Modelling of Exothermic Dissolution,” Can. Metall. Q., 27, 123 (1988); https://doi.org/10.1179/cmq.1988.27.2.123.
- P. G. SISMANIS, “The Dissolution of Niobium and Zirconium in Liquid Steel,” McGill University (1987); http://digitool.library.mcgill.ca:80/R/-?func=dbin-jump-full&object_id=28391&silo_library=GEN01 (current as of Dec. 6, 2021).
- A. PIVANO et al., “Experiments on Interactions of Molten Steel with Suboxidized Corium Crust for In-Vessel Melt Retention,” Nucl. Eng. Des., 355, 110271 (2019); https://doi.org/10.1016/j.nucengdes.2019.110271.
- T. PAVLOV et al., “A New Numerical Method and Modified Apparatus for the Simultaneous Evaluation of Thermo-Physical Properties Above 1500K: A Case Study on Isostatically Pressed Graphite,” Thermochim. Acta, 652, 39 (2017); https://doi.org/10.1016/j.tca.2017.03.004.
APPENDIX
COMPLETE LISTS OF PHASE TRANSITION TEMPERATURES USED IN PCA
gives the low-temperature phase transition temperatures used in PCA. All values carry an uncertainty of 1%.
TABLE A.I Low-Temperature Phase Transition Temperatures Used in PCA
gives the medium-temperature phase transition temperatures used in PCA. All values carry an uncertainty of 1%.
TABLE A.II Medium-Temperature Phase Transition Temperatures Used in PCA
gives the high-temperature phase transition temperatures used in PCA. All values carry an uncertainty of 1%.
TABLE A.III High-Temperature Phase Transition Temperatures Used in PCA