
Abstract
The International Handbook of Evaluated Criticality Safety Benchmark Experiments includes thousands of criticality safety benchmark configurations that have been collected since the early 1990s. Their quality and uncertainty analysis have greatly expanded over the years, as computer codes have also expanded and accelerated. Along with the increase in effort required for benchmarks today, the cost of performing experiments has also gone up. This paper evaluates plutonium fast metal and highly enriched uranium fast metal experiments for their major uncertainty contributions and identifies where to focus efforts in future experiment design.
I. INTRODUCTION AND BACKGROUND
Benchmarks are well-defined measurements with all uncertainties evaluated. The International Handbook of Evaluated Criticality Safety Benchmark ExperimentsCitation1 (the ICSBEP Handbook) contains over five thousand criticality benchmark configurations (as well as other experiment types such as subcritical, shielding, and alarm benchmarks). These benchmarks are often used to validate nuclear data. They are also used to compare code performance to reality and set uncertainty limits in criticality safety. Historically, benchmarks were write-ups of previously completed experiments as knowledge preservation, with a low bar for acceptability given the focus on information preservation before information was lost forever. As historical experiments were documented, the focus shifted to executing and benchmarking new experiments, with information requirements determined before execution. New experiments have gone up significantly in cost in the past 30 years since the start of the International Criticality Safety Benchmark Evaluation Project (ICSBEP), partially because the assumed level of detail for information preservation has increased. As such, it is important to look back on previous benchmarks and understand the important contributions to the overall uncertainty, which will help prevent the cost of experiments and detailed information preservation requirements becoming too high to execute any experiment for the purpose of the ICSBEP.
Understanding previous benchmark uncertainties will guide useful and optimized experiment design for future experiments, where uncertainty estimates for the important contributions can be performed ahead of time. This is especially important for the Experiments Underpinned by Computational Learning for Improvements in nuclear Data (EUCLID) project,Citation2 which aims to design an experiment with the explicit purpose of reducing compensating errors in nuclear data. Section I of this paper discusses the history of benchmarks and benchmark experiments. Section II covers the objectives of the EUCLID project. Section III covers the benchmark analysis methodology in this paper, and Sec. IV covers the results of the benchmark analysis in this paper.
I.A. History of Experiment Documentation
Experiments in support of criticality safety and nuclear data began in the 1940s and ramped up significantly during the 1950s and 1960s (CitationRef. 3 through Citation6). At this time, nearly all laboratories and material processing facilities had their own experimental capability.Citation7 These experimental capabilities were often in direct support of processing and fabrication operations located at the same site. Given the specific application of these experiment facilities, there was little collaboration or publication of experiment results and methods. In the 1960s, it began to be understood that better documentation of criticality experiments was needed in order to be useful for validation of codes and nuclear data.Citation8 In the 1980s and 1990s, these experimental facilities began to shut down at a rapid rate because they were expensive to maintain. The data were stored at each site but came closer and closer to extinction since the people who performed the experiments started to retire with no one available to continue their work. The need to compile and archive the data was discussed and documented in the early 1990s (CitationRef. 9).
I.B. History of the ICSBEP
The ICSBEP was founded in 1995 as an Organisation for Economic Co-operation and Development/Nuclear Energy Agency–sanctioned activity to support the information preservation and documentation of historical experiments in the field of criticality safety. It grew out of the Criticality Safety Benchmark Evaluation Project (CSBEP), which began at Idaho National Laboratory in 1992. The CSBEP is where several early U.S. benchmarks were written. The ICSBEP includes experiments dating back to the beginning of integral experiment operations, before modern codes had been developed for modeling these systems. Among the first experiments documented were the bare spheres of highly enriched uranium (HEU) and plutonium, Lady GodivaCitation10 and Jezebel,Citation11 respectively. Many other experiments were documented as benchmarks in the first year of the ICSBEP. The initial idea was focused on preserving all details of the experiments including setup, approach to critical, dimensions, and material properties/composition. They also included sections on the uncertainty associated with the experiments and models of them. Full details of the model and uncertainty analysis are included in the ICSBEP evaluations.
As time has evolved, these benchmarks have become the primary source for code validation in criticality safety and, beyond that, are being used in nuclear data validation. The increased reliance on these benchmarks, as well as code and computational improvements, has led to a significant increase in quality requirements, such as the amount of detail that needs to be included and the expectation for a much deeper dive in the uncertainty analysis, for example, evaluation of individual reflector component uncertainties. The Kilowatt Reactor Using Stirling TechnologYCitation12 (KRUSTY), HMF-101, evaluated 43 benchmark parameters per configuration whereas Lady Godiva, HMF-001, evaluated 6 benchmark parameters per configuration.
I.C. Sections of Benchmarks in the ICSBEP Handbook
Benchmarks in the ICSBEP Handbook have four main sections: experiment details, evaluation of experimental data, benchmark specifications, and sample calculation results (see the document and content guide in CitationRef. 1). In Section 1, all details of the experiment are discussed. This includes the history, composition, and dimensions of all the experiment components, including the fuel, reflector, interstitial core components, and structural components. Section 1 includes discussion of how the measurements were taken, the data used to infer keff (generally, reactor period measurements, approach to critical, or multiplicity measurements). Other measurements reported are temperature measurements throughout the assembly and supplemental measurements taken, such as Rossi-alpha, reactivity coefficient, and reaction rates. Regarding the components, it includes no assumptions or simplifications made by the evaluator, only known/measured values. The level of detail within this section has remained fairly unchanged throughout the years.
Section 2 evaluates the uncertainty of the experiment. A very detailed model, in a code of the user’s choice, is made of the experiment. This section uses that model to evaluate the sensitivity and uncertainty to all aspects of the experiment. The general categories include the following: measurement, mass, dimensions/geometry, position, composition/isotopics, and temperature. Within each category, the components of the experiment are broken down into subcategories, such as fuel, moderator, and reflector. The cutoff for “negligible” varies by the evaluation and when the benchmark evaluation was performed. For example, PMF-047 (CitationRef. 13), last revised in 2022, used 0.00002 as a cutoff, whereas PMF-003 (CitationRef. 14), last revised in 1996, used 0.00020 as a cutoff. One aspect generally not evaluated is nuclear data. This is because the benchmarks are intended to be code and cross-section library agnostic. The uncertainty evaluated in Section 2 is an uncertainty of the experiment, not the model. The detail within this section has increased by over an order of magnitude since the beginning of the ICSBEP Handbook (i.e., by page count and number of uncertainties evaluated).
The third section of benchmarks in the ICSBEP Handbook creates the benchmark model and describes it in sufficient detail such that someone else could make the same model. Adjustments from reality are considered biases and specifically discussed in this section. A simplified model, with significantly less detail than the detailed model, is also included. The purpose of the simplified model was to reduce the computational time needed; this was especially important in the early days of validation when computational time was a significant resource. It is also still useful today, for example, when linking to multiphysics and deterministic codes. The simplified model has additional biases associated with it, due to the simplifications.
In order to help an independent person develop the same model, Section 3 includes figures, diagrams, and tables with all the necessary information. All materials and compositions are explicitly stated, where the current standard is to report atom densities so differences in constants used to convert between masses and atom densities can be avoided. It concludes with benchmark keff values, including the bias, which can be compared directly to the experimentally measured keff values. The number of biases in this section has greatly reduced over the years due to our ability to model the experiment in more detail as computational methods have improved. Therefore, the length of this section has increased in order to completely describe the models.
Section 4 includes sample calculation results, which are code and cross-section variations, without accounting for bias. This includes results from one or more codes utilizing one or more nuclear data libraries.
I.D. Section 2 Uncertainty Types in Benchmarks in the ICSBEP Handbook
Uncertainties analyzed in Section 2 of benchmarks in the ICSBEP Handbook will be the main focus of this paper. The section is broken down into six main categories: measurement uncertainty, mass uncertainty, dimensional uncertainty, positional uncertainty, composition uncertainty, and temperature uncertainty. The methods and formulas for calculating these uncertainties predominantly come from the “ICSBEP Guide to the Expression of Uncertainties.”Citation15
The first uncertainty, measurement uncertainty, relates to how the effective multiplication factor is determined. It generally includes the uncertainty associated with repeatability, reproducibility, and effective delayed neutron factor. This section has been a focus since the start of the ICSBEP Handbook and in recent years has grown in importance.
The mass uncertainty is generally the most straightforward of all the uncertainties. Mass is nearly always measured, and the uncertainty is generally quantifiable via a scale calibration certificate. Uncertainty for mass is generally computed by changing the density of the part(s) in the model. For early benchmarks, this was done for groups of parts and assumed negligible for many others. Throughout the years, the parts have been analyzed in smaller batches (i.e., fewer parts combined in each simulation and uncertainty category). Additionally, new computational methods have allowed this to be done without significantly impacting computation time. This is accomplished by computing keff sensitivities to a user-specified list of nuclides and reactions, which can then be used to calculate mass and compositional uncertainties. This is included in codes such as the TSUNAMI package in the KENO portion of SCALE (CitationRef. 16), KSEN in MCNP (CitationRef. 17), and OpenMC (CitationRef. 18).
The uncertainty in dimensions is based on known measurements, drawing dimensions, or assumed information. The uncertainty on the parts is therefore dependent on the tools used, the tolerances on the drawings, and the associated assumptions made about those values. Assumptions regarding dimensions have changed over the years of the ICSBEP. Many earlier benchmarks assumed lower uncertainties in measurement tolerances than what would be acceptable today. As an example, one might have assumed a dimension had an uncertainty of ±0.1%, whereas that same value today would have an uncertainty of ±1%. Additionally, the early benchmarks perturbed very few dimensions and grouped many of them in simulations. Later benchmarks look into dimensional uncertainties in much more detail, including more components in the analysis.
The uncertainty in composition is perhaps the most important and hardest to quantify. For parts that have had their composition explicitly analyzed, the uncertainty associated with the analysis generally has to be assumed. Composition information on the fuel is generally the best known and most important aspect of this section. Early benchmarks rarely analyzed composition uncertainties for nonfuel components. However, recent benchmarks have included significantly more analysis of composition uncertainties for components other than the fuel.
The uncertainty associated with temperature is generally the most complicated. It includes the reactivity uncertainty associated with the temperature, which comes from many sources: Doppler broadening, cross-section changes associated with temperature, expansion coefficients, and others. Sometimes, the analysis involves varying material density and expansion while other times it changes the cross sections to sets other than room temperature, and sometimes, it combines these. The ICSBEP uncertainty guide does not discuss this uncertainty thoroughly and has caused evaluators to approach this uncertainty differently.
II. EUCLID OBJECTIVES
The EUCLID project aims to reduce compensating errors in nuclear data by combining multiple different types of measurements (such as reactivity coefficients,Citation19 Rossi-alpha,Citation20 reaction rate ratios,Citation21 and the delayed neutron fractionCitation22), conducted on optimized configurations. The work is heavily based on the use of machine learning (ML) methods to make these advancements. First, a nuclear data target is selected utilizing sensitivities and bias of integral experiments utilizing Random Forest with the SHapley Additive exPlanations (SHAP) metric.Citation23 Next, a new experiment configuration/configurations is/are designed using a D-optimality criterion,Citation24 which is an optimization problem to minimize the log-determinant of the adjusted nuclear data covariance. Since this optimization requires sensitivities for each type of measurement, advanced tools in Monte Carlo N-Particle® (MCNP) (CitationRef. 25) are being developed to better understand uncertainties within experiments, such as the Fixed source SENSitivity (FSEN) capability.
As experiment uncertainties increase, the usefulness of any experiment for nuclear data adjustment and validation decreases. It is therefore very important to understand the major contributors to experimental uncertainty. The EUCLID project reviewed existing ICSBEP benchmarks and focused on the Section 2 uncertainty analysis to understand where the major contributors exist. The existing ICSBEP benchmarks are the most well-known and broad set of experiments with detailed uncertainty quantification, making it the ideal input for this analysis. This information is fed into the ML portion of the design optimization. Future work of the EUCLID project includes performing a new experiment with multiple types of measurement responses and demonstrating the impact on nuclear data adjustment and validation.
III. BENCHMARK ANALYSIS METHODOLOGY
The analysis in this paper looks only at the plutonium-metal-fast (PMF) and highly-enriched-uranium-metal-fast (HMF) series within the ICSBEP Handbook. The abbreviations refer to the fissioning material (i.e., HEU or Pu), the fissioning material form in the system (i.e., metal), and the associated neutron spectrum of the system (i.e., fast). When modified by “S,” it means the system was subcritical. These were chosen for specific reasons: Most experiments performed at the National Criticality Experiments Research Center (NCERC) are fast metal systems since there is no solution capability, and the EUCLID project has specifically chosen to target compensating errors in 239Pu, most of which exist in the fast region.
Based on an internal analysisCitation26 (to be published in the future), some of the benchmarks in these series were not analyzed due to their questionability as a suitable benchmark. Methods to determine questionability included excluding configurations that had extreme disagreements (more than 2000 pcm) of experiments and simulations, those that had total experiment uncertainties below 50 pcm, and the use of Random Forest to find benchmarks that had a large bias compared to other benchmarks with similar sensitivities. All methods utilize bias, experiment uncertainty, and/or nuclear data sensitivities to determine if a benchmark is deemed “questionable” and therefore excluded from this work.
and list all the benchmarks that were used in this analysis, where shows the benchmarks in the PMF series and shows the benchmarks in the HMF series. All PMF benchmarks through PMF047 and all HMF benchmarks through HMF101 were considered for inclusion in this work; therefore, any benchmarks not listed in and below these numbers were excluded as they were deemed questionable. The term “benchmark parameter” in these tables is used to describe any variable that has an uncertainty and affects keff. For example, this could be uncertainty of fuel composition, or reflector thickness. As such, each benchmark has many benchmark parameters.
TABLE I Summary of PMF Benchmarks Used
TABLE II Summary of HMF Benchmarks Used
III.A. Extracting Uncertainties from Benchmarks
The work shown in this paper primarily pulls information from Section 2 of the benchmarks. Recent benchmarks normally include a summary table at the end of Section 2; however, some older benchmarks summarized uncertainty results in Section 3. This information can only be extracted from the evaluation, so the authors of this paper manually searched through each of the evaluations and reported the uncertainty. The information is not currently included in the “Database for the International Handbook of Evaluated Criticality Safety Benchmark Experiments”Citation27 (DICE). There was some level of qualitative judgment applied in this activity since the authors may have had to deviate from the uncertainty categories listed in the evaluation to be consistent among all the evaluations. Furthermore, the evaluations were divided among multiple authors, and each author may have interpreted an uncertainty slightly different from another author. And, last, the format of how uncertainties were reported changed over the years, as well as the minimum value to be considered negligible.
The uncertainties reported in the benchmarks were divided into categories based on the type of uncertainty. Within the categories listed previously, the uncertainties were further divided into subcategories based on the type of component. and list the components and uncertainty types, respectively, analyzed. These categories and subcategories are used to compare the uncertainties among various benchmarks. Many benchmarks report uncertainties in Section 2 as a ∆keff; however, in this analysis the ∆keff values were converted to δkeff/keff, using the benchmark value reported in Section 3.5.
TABLE III Component Types
TABLE IV Uncertainty Types
III.B. Analysis of the Benchmark Uncertainties
The process of analyzing benchmark uncertainties is shown in . After removing questionable benchmarks (Sec. III in gray) and summarizing the benchmark uncertainties (Sec. III.A in orange), a script is used to read the data files, apply filters, calculate summary results, and output plots.
Fig. 1. Process to analyze benchmark uncertainties. Blue represents the ICSBEP evaluations, gray represents previous work, orange represents manual tasks performed in this work, and green represents the analysis described in this section.
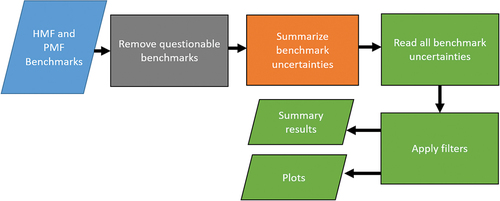
Each of the 92 benchmarks listed in and (24 and 68, respectively) had uncertainty specifications given in individual comma separated variable (CSV) files. All CSV files were read in, which included 5124 individual uncertainties, 4269 and 855 from HMF and PMF, respectively (each associated with a benchmark, an uncertainty type, and a component).
Two types of filters can be applied: either the component or the uncertainty type (shown in and ). While every possible effort was made to use consistent terminology when summarizing the benchmark uncertainties, it was not always possible. As such, some grouping occurred. Dimension includes geometry; composition includes isotopics, impurities, temperature, composition, and humidity; measurement includes method and measurement; simplification includes presence and room; fuel includes core; and structural includes structure and room. In addition to the filters in , a filter can be applied to include only PMF or HMF benchmarks. Any of these categories of filters (type, component, and benchmark series) can be applied either individually or in combination. After the filters are applied, summary results are output, and plots are produced as shown in Sec. IV.
IV. BENCHMARK ANALYSIS RESULTS
The results of the analysis include many subcategories. PMF and HMF were always evaluated separately but plotted in the same figure for comparison. The benchmarks were analyzed by component type and uncertainty type; fuel, reflector, and structural component types were further analyzed by uncertainty type. Component and uncertainty types follow the specifications in and , respectively. Plots shown represent frequencies of the uncertainties among all benchmarks in their series (PMF and HMF). Each bin has a range of 10 pcm. The y-axis and x-axis are fixed for comparison among all plots and thus are the maximum range. Because of the large number of benchmarks with low uncertainty values, the y-axis is log scale.
IV.A. Analysis Results by Component Type
The component types were compared against other components within a series (e.g., comparing HMF fuel uncertainties to HMF reflector uncertainties) and between their counterparts in the other series evaluated (e.g., comparing HMF fuel uncertainties to PMF fuel uncertainties). Histograms of benchmark uncertainties are shown in through . It can be seen by these plots, and explicitly stated in and , that while HMF benchmarks have a much greater quantity of parameters evaluated in most categories, the uncertainties were larger for PMF.
TABLE V HMF Component-Type Uncertainty Summary: Median, Mean, Max, and Total Number of Benchmark Parameters
TABLE VI PMF Component-Type Uncertainty Summary: Mean, Median, Max, and Total Number of Benchmark Parameters
Fig. 2. Fuel uncertainty.
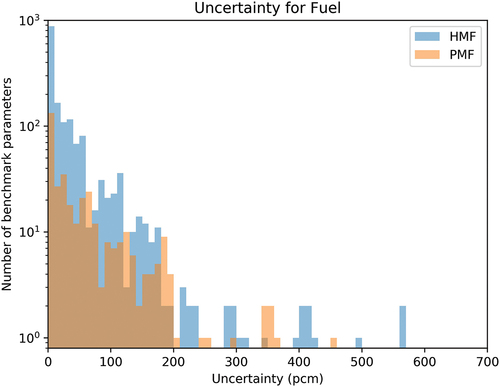
Fig. 3. Absorber uncertainty.
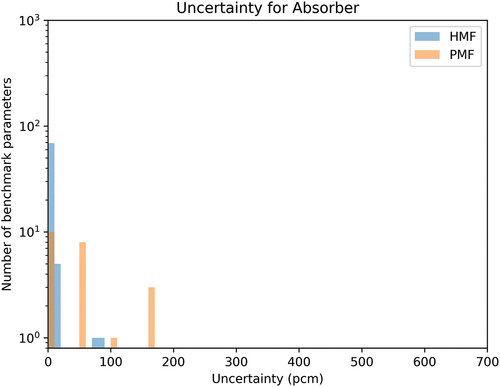
Fig. 4. Cladding uncertainty.
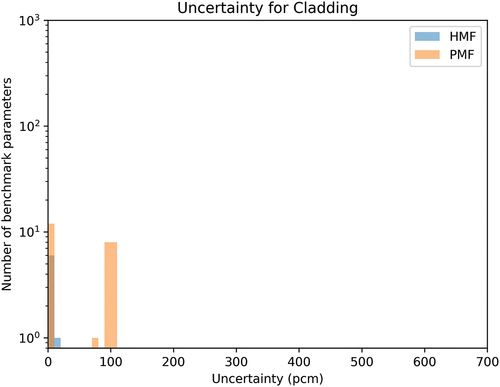
Fig. 5. Moderator uncertainty.
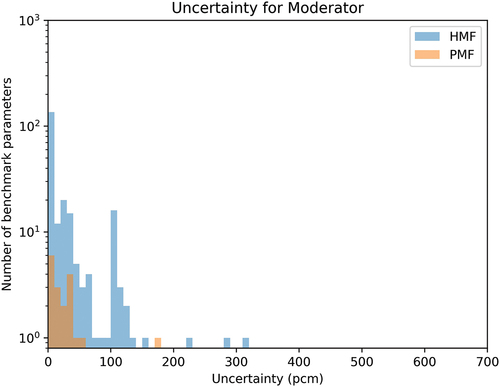
Fig. 6. Reflector uncertainty.
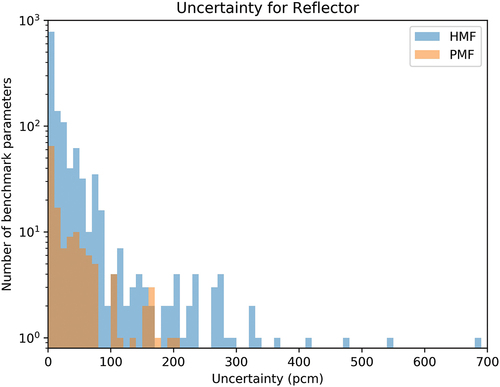
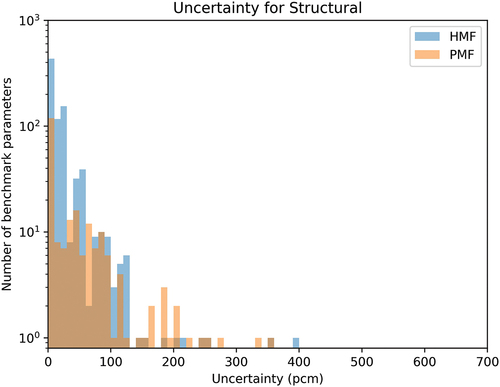
Fig. 7. Structural uncertainty.
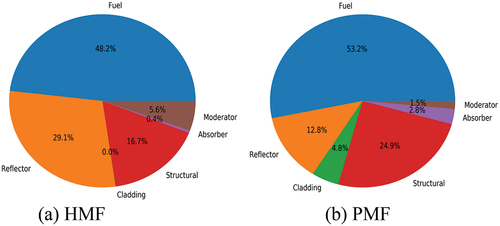
Fuel uncertainty is presented in . Fuel has the largest uncertainty contribution of any component type for both PMF and HMF benchmarks. This can be seen in and . For HMF series, greater than 1200 benchmark uncertainty parameters are reported as nonnegligible. That said, >50% are <10 pcm for PMF series and <6 pcm for HMF series. The 2.5% of the HMF benchmark uncertainty parameters with uncertainty >350 pcm come from three unrelated benchmarks: HMF-048, HMF-031, and HMF-023. Approximately 90% of the HMF benchmark uncertainty parameters are <100 pcm. For the PMF series, all but two fuel benchmark uncertainty parameters in the greatest 10% come from a single benchmark: PMF-037. Additionally, 80% of the PMF series benchmark uncertainty parameters are <100 pcm. There is a fairly consistent distribution of fuel uncertainties from 0 to 400 pcm for both HMF and PMF (nonlinearly decreasing as uncertainty increases). This is evident by the mean and median reported in and . shows pie diagrams for component-type contribution to the total uncertainty.
Fig. 8. Component-type uncertainty pie diagrams: (a) HMF and (b) PMF.
shows the results for absorber uncertainty. Absorber is evaluated much more often in HMF benchmarks than PMF benchmarks; however, the uncertainty contribution is always <100 pcm, and most often <30 pcm. For the HMF series, the uncertainties come from only four benchmarks: HMF-080, HMF-093, HMF-100, and HMF-101. For the PMF series, all come from only two benchmarks: PMF-046 and PMF-001. Given the few benchmarks contributing to both HMF and PMF series, further conclusions cannot be made. A rough summary of the results is shown in and as well as .
Cladding uncertainty is presented in . For cladding, the uncertainty is evaluated much more often for PMF than HMF, likely because plutonium is much more likely to be clad than uranium due to the dispersal properties of plutonium versus uranium. For the HMF benchmarks with cladding uncertainty, only two benchmarks contribute, HMF-090 and HMF-080, and this uncertainty is always ≤20 pcm. For the PMF series, only three benchmarks have nonnegligible cladding uncertainties: PMF-001, PMF038, and SPMF-001. PMF-038 and SPMF-001 included the same Pu item. The PMF benchmark uncertainty parameters have a much larger range in the uncertainty than the HMF series. All the SPMF-001 uncertainties are <5 pcm, and PMF-001 is the only one with uncertainties >100 pcm (maximum of 104 pcm). Therefore, cladding needs to be well understood if used. Given the few benchmarks contributing to both HMF and PMF series, further conclusions cannot be made.
Moderator uncertainty is presented in . The total number of benchmark parameters for moderators is low for both HMF and PMF series. For the HMF series, four benchmarks contribute to the top 15% of the benchmark uncertainty parameters, which have uncertainty >60 pcm. These benchmarks are HMF-047, HMF-056, HMF-048, and HMF-096, and HMF-056 and HMF-096 were performed at the Oak Ridge Critical Experiments Facility (ORCEF), which gives them something in common. Further, 88% have uncertainties <100 pcm, and 60% have uncertainties <10 pcm. For the PMF series, three benchmarks contribute: PMF-017, PMF-033, and PMF-047. PMF-017 is the only benchmark with an uncertainty parameter >60 pcm. The distribution is widespread in both series. It is notably larger for HMF than PMF in both quantity of parameters evaluated and uncertainty contribution. Moderators have an inconsistent effect on total uncertainty. This is also evident by the large spread between the mean and median in and .
Reflector uncertainty is presented in . Reflector uncertainty is the second most commonly evaluated benchmark uncertainty parameter. For the HMF series, HMF-023 contributes to the top 0.4% of all benchmark uncertainty parameters, which have uncertainty >350 pcm; these come from gaps in a low-Z reflector. Furthermore, 95.5% of HMF series benchmark uncertainty parameters have an uncertainty <100 pcm, and 64% have uncertainty <10 pcm. For the PMF series, PMF-044 and PMF-046 contribute to all benchmark uncertainty parameters ≥150 pcm (the top 5.5%). Furthermore, 90% of PMF series benchmark uncertainty parameters have an uncertainty <100 pcm, and 55% have an uncertainty <10 pcm. The uncertainty contribution from reflectors is notably larger for HMF than PMF. Reflectors can lead to very large uncertainty contributions; care should be taken during experiment design to ensure these are reduced appropriately. Reflection makes up a large percentage of the total for both series, as shown in .
Structural was the last component type evaluated. It is presented in . For the HMF series benchmark uncertainty parameters, HMF-023 contributes to all but one of the benchmark parameters above 200 pcm (the top 0.8%). The other comes from HMF-053. Furthermore, 97% of the HMF series benchmark parameters have uncertainties <100 pcm, and 52% have uncertainties <10 pcm. Structural uncertainties have the largest percentage of benchmark parameters with uncertainties between 10 and 100 pcm than other components in the HMF series. For the PMF series benchmarks, three benchmarks contribute to all uncertainties >80 pcm (the top 16%): PMF-003, PMF-004, and PMF-037. Furthermore, 90% have uncertainties <100 pcm, and 52% have uncertainties <10 pcm. This spread is very similar to the HMF series. The distribution for structural uncertainty is very flat from 10 to 100 pcm for PMF. Additionally, PMF has a fairly even, though smaller, distribution of benchmark parameters up to 350 pcm. As can be seen in , structural has the second largest contribution to uncertainty for PMF series. HMF has a much greater quantity of benchmark parameters evaluated from 0 to 50 pcm and tails off abruptly after 160 pcm. The median for structural uncertainty in both series is <20 pcm, indicating that structural effects cannot be ignored.
and summarize the mean, median, and max for each component type, for HMF and PMF, respectively. The min is not shown, as it is always zero. Units are uncertainty (pcm), except for the last column, which is the quantity of the applicable benchmark parameters. shows pie diagrams for component-type contribution to the total uncertainty. Fuel, reflector, and structural are the most important components for uncertainty in both HMF and PMF benchmarks, accounting for >75% of the total uncertainty. Both mean and median uncertainties are always larger for PMF series than HMF series, except for structural uncertainty median. For all categories except cladding and absorbers in the PMF series, means are larger than median values. It can be seen that structural has the greatest median contribution to uncertainty for HMF but least for PMF. Fuel has the largest mean for both series, which points to the importance of using well-characterized special nuclear material (i.e., HEU or plutonium).
IV.B. Analysis Results by Uncertainty Type
The uncertainty types were compared within each other and to each other for PMF and HMF series. Histograms of benchmark uncertainties are shown in through . A few key points stand out.
Fig. 9. Composition uncertainty.
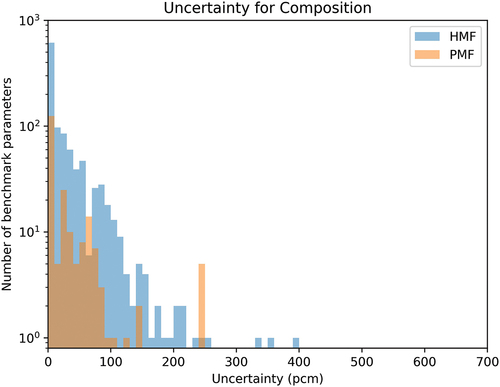
Fig. 10. Dimension uncertainty.
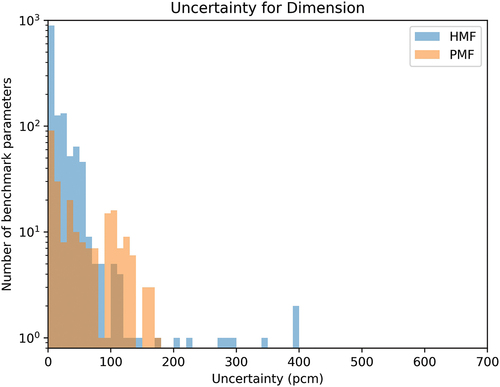
Fig. 11. Mass uncertainty.
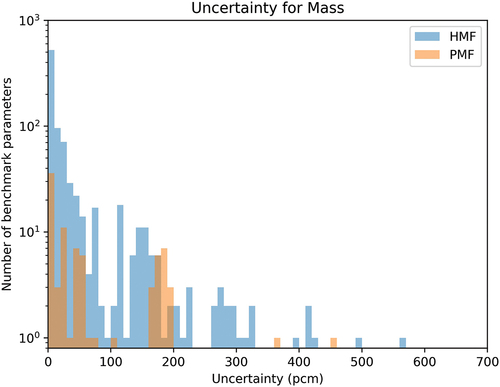
Fig. 12. Measurement uncertainty.
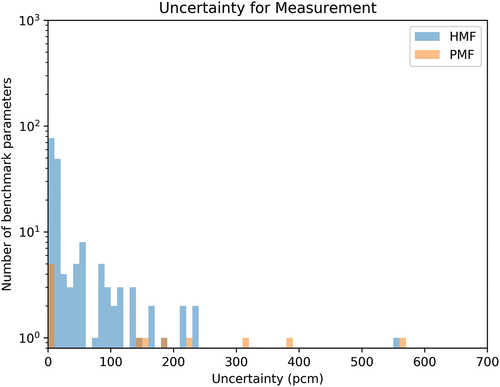
Fig. 13. Position uncertainty.
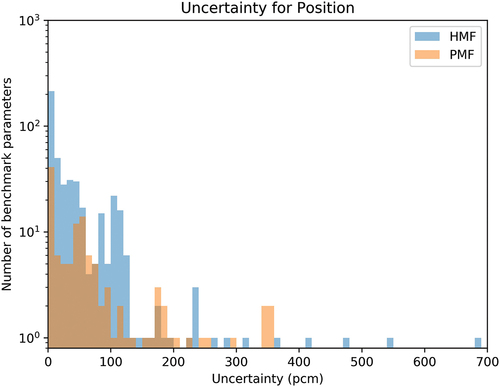
Fig. 14. Density uncertainty.
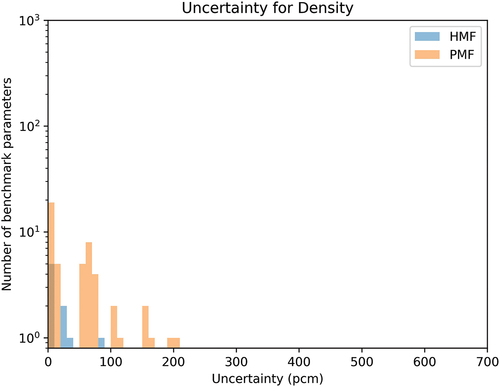
Fig. 15. Simplification uncertainty.
shows results for composition uncertainty. Composition is a nonnegligible uncertainty for the most benchmark parameters. The summed uncertainty for composition accounts for >25% of the total for HMF series and >14% for PMF series, as shown in . For the HMF series, HMF-023 and HMF-085 account for all the uncertainties >250 pcm, where the maximum is 400 pcm, as shown in . Furthermore, 95% are <100 pcm, and 57% are <10 pcm. For the PMF series, SPMF-001 contributes to all uncertainties >150 pcm, where the maximum is 250 pcm, as shown in . Furthermore, 85% of the benchmark parameter uncertainties are <150 pcm, and 50% are <8 pcm. The uncertainty distributions are very similar between the HMF and PMF series, which can be seen in , where the difference in mean is <3 pcm and there is no difference in median.
TABLE VII HMF Uncertainty-Type Uncertainty Summary: Mean, Median, Max, and Total Number of Benchmark Parameters
TABLE VIII PMF Uncertainty-Type Uncertainty Summary: Mean, Median, Min, Max, and Total Number of Benchmark Parameters
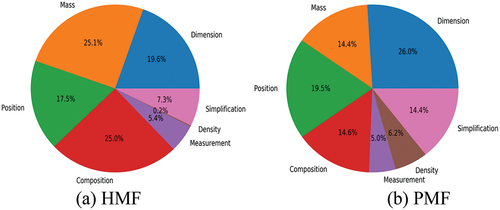
Fig. 16. Uncertainty-type uncertainty pie diagrams: (a) HMF and (b) PMF.
shows results for dimension uncertainty. Dimensions are the most commonly evaluated uncertainty type, as shown in and . More than 50% of uncertainties are <8 pcm for HMF and <20 pcm for PMF, so generally quite small. For the HMF series, HMF-023 contributes to uncertainties >350 pcm (the top 0.2%), 98.4% have uncertainties <100 pcm, and 65% have uncertainties <10 pcm. For the PMF series, three benchmarks (PMF-017, PMF-044, and PMF-037) contribute to the uncertainty ≥130 pcm (the top 6%). Two other benchmarks (PMF-001 and PMF-019) combined with those account for the contribution >101 pcm (the top 17%). Only 38% have uncertainty <10 pcm. Overall, they sum up to approximately the same percent of the total uncertainty, as can be seen in . The spread is more uniform for PMF up to 170 pcm in PMF whereas in HMF the frequency drops off quickly at 60 pcm and even more so at 130 pcm.
Mass is the most commonly evaluated benchmark uncertainty parameter, and yet, it accounts for <15% of the total benchmark uncertainty for PMF and for only 25.1% of the total for HMF, as shown in . For the HMF series, HMF-048 contributes to all benchmark uncertainty parameters >350 pcm (the top 0.7%), and three benchmarks (HMF-048, HMF-063, and HMF-066) contribute to all benchmark uncertainty parameters >275 pcm (the top 2%). Furthermore, 90% of the HMF series benchmark uncertainty parameters are <100 pcm, 60% are <10 pcm, and 46% are <5 pcm. For the PMF series, PMF-037 contributes to all but two benchmark parameters that are >180 pcm in the top 20%. All PMF series benchmark uncertainty parameters ≥100 pcm, which are the top 25%, all come from four benchmarks: PMF-002, PMF-038, PMF-037, and PMF-046. Furthermore, only 41% of the PMF series benchmark uncertainty parameters are <10 pcm, a smaller percentage than the HMF series <5 pcm. shows results for mass uncertainty.
Measurement uncertainty is also very commonly evaluated in HMF series, even in the early benchmarks. Only five PMF benchmarks evaluate the measurement uncertainty. For the HMF series benchmark uncertainty parameters, HMF-084 contributes to all but three of the >50 pcm (the top 19%) uncertainties. Furthermore, 45% are <10 pcm, and 37% are <5 pcm. For the PMF series, the top five of the 12 benchmark uncertainty parameter total come from SPMF-001, which makes sense due to the larger uncertainty expected from being very far from keff = 1. The remaining seven come from four benchmarks: PMF-031, PMF-032, PMF-033, and PMF-047. Measurement uncertainty is important for the PMF series, accounting for ~7.5% of the total uncertainty; but only 3% for HMF series. shows results for measurement uncertainty. Given the few number of benchmarks with measurement uncertainties, the category was further analyzed. Of the 18 benchmarks contributing, six came from ORCEF, and six came from the Russian Institute for Engineering Physics (VNIIEF) Criticality Test Facility (CTF). The remainder came from the Los Alamos Critical Experiment Facility (LACEF), Argonne National Laboratory (ANL), and NCERC (two each). For the CTF benchmarks, the uncertainty is associated with replacement measurements to get the exact multiplication. For ORCEF, ANL, NCERC, and LACEF, the uncertainty is associated with period fitting and beta effective uncertainty.
For position, the histogram shape is uniform for HMF series from 0 to 130 pcm with just a few points with higher uncertainty. HMF-023 contributes to all but one benchmark uncertainty parameter >200 pcm (the top 2.5%). Furthermore, 86% are <100 pcm, 46% are <10 pcm, and 37% are <5 pcm. For the PMF series benchmark uncertainty parameters, PMF-037 and PMF-046 contribute to all uncertainties >115 pcm (the top 17%). Furthermore, 82% are <100 pcm, 34% are <10 pcm, and 24% are <5 pcm. The PMF-037 benchmark uncertainty parameters are all associated with the fuel position, which were Pu cylinders inside aluminum cans without a spacing fixture. In general, position uncertainties are greater for PMF series than HMF series, as shown in and . This impact most often comes from separation gaps between two halves of the assembly with an extrapolation to critical. shows results for position uncertainty.
shows results for density uncertainty. For HMF series, all benchmark uncertainty parameters come from one benchmark: HMF-080. They are reported as negligible or not evaluated for all other HMF benchmarks. For the PMF series, all benchmark uncertainty parameters come from four benchmarks: PMF-001, PMF-044, PMF-037, and SPMF-001; all but PMF-037 were conducted at LACEF. Nearly half (coming from PMF-037 and SPMF-001) are associated with fuel density. PMF-044 contributes to all uncertainties ≥150 pcm (the top 10%); these are associated with a polyethylene reflector density. Furthermore, 84% are <100 pcm, and 39% are both <10 pcm and <5 pcm. Density uncertainties account for <10% of the total uncertainty in both HMF and PMF series, as can be seen in .
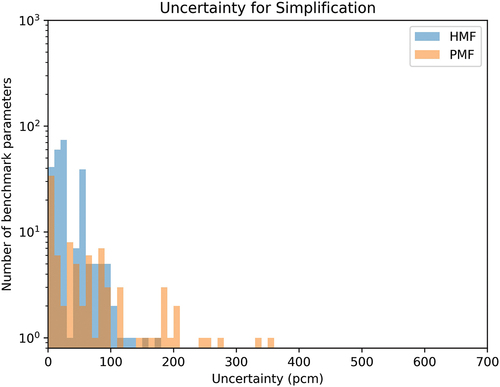
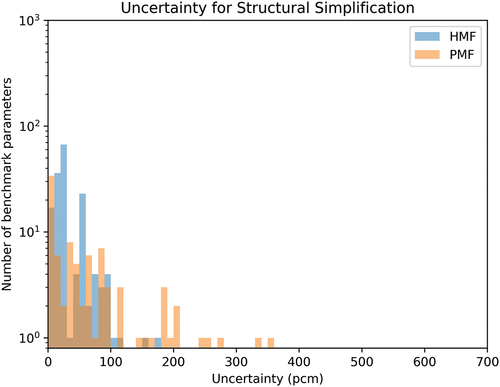
shows results for simplification uncertainty. For the HMF series, the top benchmark uncertainty parameters are not attributed to any specific benchmarks. 97% are <100 pcm, only 16% are <10 pcm, and only 10% are <5 pcm. For the PMF series, PMF-003 and PMF-004, both experiments at Lawrence Livermore National Laboratory (LLNL) contribute to all but one benchmark uncertainty parameter >80 pcm, the top 28%. Furthermore, 36% are <10 pcm, and 33% are <5 pcm. The span of contribution is much greater for PMF than HMF series, extending up to 360 pcm versus 180 pcm, as shown in and .
and summarize the mean, median, and max for each uncertainty type, for the HMF and PMF series, respectively. The min is not shown, as it is always zero. Units are uncertainty (pcm), except for the last column, which is the quantity of the applicable benchmark parameters. shows pie diagrams for uncertainty-type contribution to the total uncertainty. Dimension and composition are the top two most frequently evaluated uncertainty types for both HMF and PMF series. Density is least often evaluated for HMF series whereas measurement is least often evaluated in PMF series. While measurement is the least often evaluated in PMF series, it has the highest mean and median. All types have a higher mean for PMF than HMF. Dimension has the lowest mean for HMF whereas composition has the lowest mean for PMF series.
IV.B.1. Analysis Results Including PMF-042 by Component and Uncertainty Type
PMF-042 was excluded from the analysis shown in previous sections because of its outlier uncertainty values, though it was judged acceptable by the ICSBEP Technical Review Group (but, it was noted that the uncertainties were large due to the unique nature of the experiment).Citation28 There is a note in the benchmark that all benchmarks similar to this one were not judged acceptable by the ICSBEP Technical Review Group. and summarize the difference in PMF series results by component type and uncertainty type with PMF-042 included. Units are uncertainty (pcm), except for the last column, which is the quantity of the applicable benchmark parameters. Primary sources of uncertainty in PMF-042 include fuel, reflector, composition, dimension, and mass.
TABLE IX Difference in PMF Component-Type Uncertainty Summary When Including PMF-042: Mean, Median, Max, and Total Number of Benchmark Parameters
TABLE X Difference in PMF Uncertainty-Type Uncertainty Summary When Including PMF-042: Mean, Median, Max, and Total Number of Benchmark Parameters
IV.C. Analysis Results by Fuel Uncertainty Type
Some aspects of the fuel have been further analyzed based on their large or unique contribution to the fuel uncertainty. The subtypes are discussed in the section and paragraphs that follow.
The fuel uncertainty types were further evaluated because they are the most frequently evaluated component uncertainties in benchmarks. They are compared within each uncertainty type (e.g., dimension, mass, composition, density, and position) and separately for the PMF and HMF series. and summarize the mean, median, and max for each fuel uncertainty type, of HMF and PMF, respectively. The min is not shown, as it is always zero. Units are uncertainty (pcm), except for the last column, which is the quantity of the applicable benchmark parameters. Fuel composition, fuel dimension, fuel mass, and fuel position are discussed in more detail.
TABLE XI HMF Fuel Uncertainty-Type Uncertainty Summary: Mean, Median, Max, and Total Number of Benchmark Fuel Parameters
TABLE XII PMF Fuel Uncertainty-Type Uncertainty Summary: Mean, Median, Max, and Total Number of Benchmark Parameters
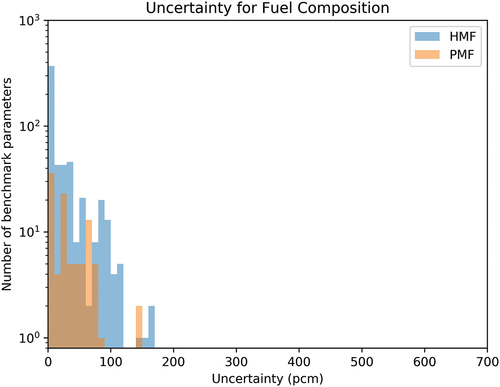
Histograms of benchmark uncertainties for fuel composition are shown in . As can be seen in , fuel composition is the most commonly evaluated fuel uncertainty type for the HMF series and the second most common for the PMF series. However, it has the lowest median uncertainty, as can be seen in . For HMF series benchmark uncertainty parameters, 98% were <100 pcm, 70% were <20 pcm, 63% were <10 pcm, and 42% were 5 pcm. The benchmark uncertainties >100 pcm come from six different facilities, highlighting the importance of this parameter and contribution to overall benchmark uncertainty. As can be seen in , fuel composition has the lowest mean of all fuel uncertainty types for the PMF series. For PMF series benchmark uncertainty parameters, only two are >100 pcm (2%). Both of these, PMF-002 and PMF-038, were experiments conducted at Los Alamos National Laboratory (LANL) though separated in time by >20 years. Furthermore, 40% were <20 pcm, 37% were <10 pcm, and 29% were <5 pcm. So, while HMF and PMF series had the same percentage above 100 pcm, PMF series had a significantly greater percentage between 100 and 20 pcm, nearly matching the percentage in HMF series between 100 and 5 pcm.
Fig. 17. Fuel composition uncertainty.
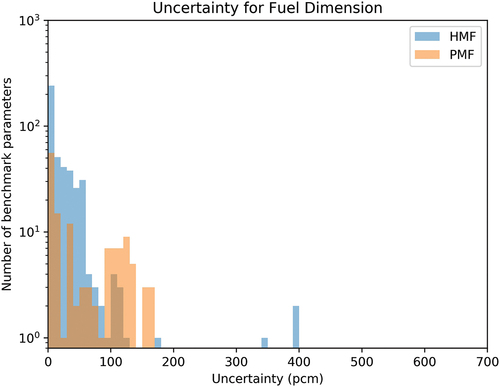
Histograms of benchmark uncertainties for fuel dimension are shown in . As can be seen in , fuel dimension has the second highest maximum value of all fuel uncertainty types for the HMF series and the lowest median value for all fuel uncertainty types for the PMF series. For the HMF series benchmark uncertainty parameters, two benchmarks contribute to the uncertainties >300 pcm. These two benchmarks, HMF-023 and HMF-026, were both conducted at Oak Ridge National Laboratory (ORNL) as part of the Tinkertoy series (Tinkertoy and Tinkertoy 2). For benchmark uncertainty parameters within the HMF series, 97.3% were <100 pcm, 65% were <20 pcm, 54% were <10 pcm, and 42% were <5 pcm. For the PMF series, only three benchmarks contribute to uncertainties >120 pcm, making up 15% of the total: PMF-037, PMF-044, and PMF-001. Two more, PMF-019 and PMF-041, each add a benchmark parameter uncertainty in the contribution >100 pcm, as well as many other uncertainty parameters from the first three benchmarks. These make up the 25% of the benchmark uncertainties >100 pcm. Furthermore, 52% are <20 pcm, and 41% are <10 pcm, with only one benchmark uncertainty parameter between 10 and 5 pcm. For fuel density, the HMF series had <5 benchmark uncertainty parameters, and the PMF series all came from two benchmarks: PMF-037 and SPMF-001.
Fig. 18. Fuel dimension uncertainty.
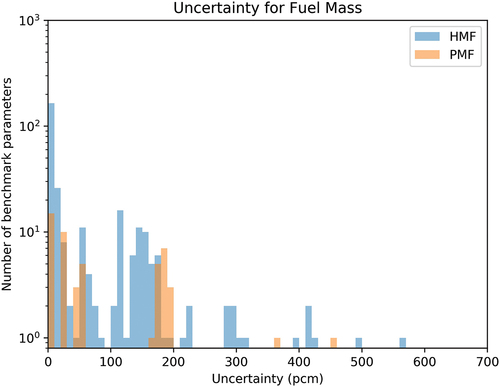
Histograms of benchmark uncertainties for fuel mass are shown in . As can be seen in , for HMF series benchmark uncertainties, fuel mass has a higher mean than any other uncertainty type for fuel. It is the only fuel uncertainty parameter in the HMF series with a mean >50 pcm. Three benchmarks contributed to the 5% of benchmark parameters that have uncertainties >200 pcm: HMF-048, HMF-063, and HMF-068. The three benchmarks have no significant commonality. For the 25% of benchmark parameters that have uncertainties >100 pcm, eight benchmarks contribute: HMF-048, HMF-068, HMF-056, HMF-063, HMF-028, HMF-084, HMF-085, and HMF-086; the last five were all experiments conducted at LANL. Furthermore, for HMF series benchmark uncertainty parameters, 65% were <20 pcm, 56% were <10 pcm, and 40% were <5 pcm, which, aside from the percentage >100 pcm, is very similar to the breakdown for HMF series fuel dimension. For the PMF series benchmark uncertainty parameters, three benchmarks contribute to the 35% of benchmark parameters that have uncertainties >100 pcm: PMF-002, PMF-037, and PMF-038. The two above 300 pcm (PMF-002 and PMF-038) were both experiments conducted at LANL. Furthermore, 30% of benchmark parameters had uncertainties that were <20, 10, and 5 pcm.
Fig. 19. Fuel mass uncertainty.
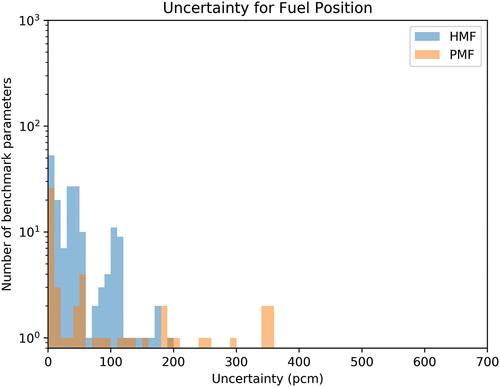
Histograms of benchmark uncertainties for fuel position are shown in . As can be seen in , fuel position has the highest median of all fuel uncertainty types for the HMF series; it has the second highest maximum value for the PMF series. For the HMF series benchmark uncertainties, the top 11 benchmark uncertainties (all above 110 pcm) were from three benchmarks: HMF-043, HMF-044, and HMF-049. These were all using the same fuel at the VNIIEF. Furthermore, only 85% were <100 pcm, 40% were <20 pcm, 29% were <10 pcm, and 21% were <5 pcm. These are higher uncertainties per band than the other fuel categories of uncertainty type for HMF series. For PMF series benchmark uncertainty parameters for fuel position, only two benchmarks contribute to uncertainty >100 pcm: PMF-037 and PMF-004; only one benchmark uncertainty parameter comes from PMF-004. Only four benchmarks contribute to all of the PMF series fuel position uncertainties: the two previously mentioned and PMF-047 and PMF-001. For fuel simplification, <5 benchmark uncertainties contribute to the HMF series. For fuel simplification in the HMF series, 11 benchmarks contribute. The greatest uncertainty is 50 pcm, and only two benchmark uncertainty parameters are >20 pcm. For fuel simplification, <5 benchmark uncertainty parameters contribute to the PMF series.
Fig. 20. Fuel position uncertainty.
IV.D. Analysis Results by Reflector Uncertainty Type
The reflector uncertainty types were further evaluated because they are the third most frequently evaluated in HMF and PMF benchmarks and came from a large number of independent benchmarks. They are compared within each uncertainty type and separated for the HMF and PMF series. and summarize the mean, median, and max for each reflector uncertainty type, of HMF and PMF, respectively. The min is not shown, as it is always zero. Units are uncertainty (pcm), except for the last column, which is the quantity of the applicable benchmark parameters. Reflector composition, reflector dimension, reflector mass, and reflector position are discussed in more detail.
TABLE XIII HMF Reflector Uncertainty-Type Uncertainty Summary: Mean, Median, Max, and Total Number of Benchmark Fuel Parameters
TABLE XIV PMF Reflector Uncertainty-Type Uncertainty Summary: Mean, Median, Max, and Total Number of Benchmark Parameters
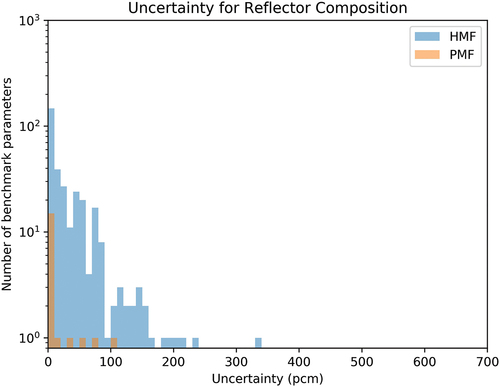
Histograms of benchmark uncertainties for reflector composition are shown in . The top 10 highest benchmark uncertainties come from five benchmarks from five different facilities without a common reflector material. Furthermore, 93% were <100 pcm, 58% were <20 pcm, 46% were <10 pcm, and 34% were <5 pcm. For the PMF series, only one benchmark, PMF-033, with one benchmark uncertainty parameter was >100 pcm. The top five (25%) benchmark uncertainties, which were >10 pcm, came from four benchmarks with four different reflectors. No common theme can be found among reflector composition top uncertainties for either HMF or PMF series.
Fig. 21. Reflector composition uncertainty.
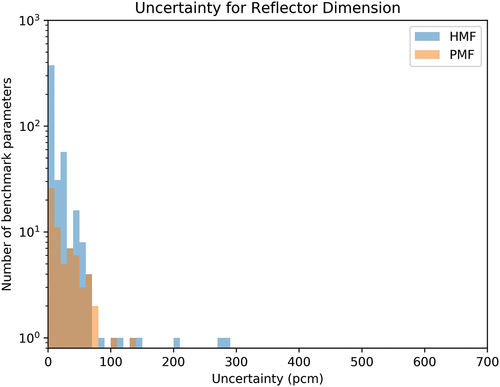
Histograms of benchmark uncertainties for reflector dimension are shown in . As can be seen in and , reflector dimension was the most commonly evaluated benchmark uncertainty parameter for reflector uncertainty types for both HMF and PMF series. For the HMF series, it has the lowest mean and median. Only 1.4% of the benchmark uncertainty parameters were >100 pcm and came from only two benchmarks: HMF-058 and HMF-066. Both these benchmarks were experiments conducted at LLNL with beryllium reflectors. Furthermore, 80% were <20 pcm, 74% were <10 pcm, and 55% were <5 pcm. That is to say, more than half were <5 pcm (which can also be seen in with the mean value). For the PMF series reflector dimension, 97% of the benchmark uncertainty parameters were <100 pcm. This value is close to the percentage for the HMF series. However, 56% were <20 pcm, which is much smaller than for the PMF series. 39.3% were <10 pcm, and only 24% were <5 pcm.
Fig. 22. Reflector dimension uncertainty.
For reflector density, as can be seen in , only 10 benchmark uncertainties were analyzed. These are the same top 10 benchmark uncertainty parameters in the overall PMF density category. For the HMF series, <5 benchmark uncertainty parameters were evaluated.
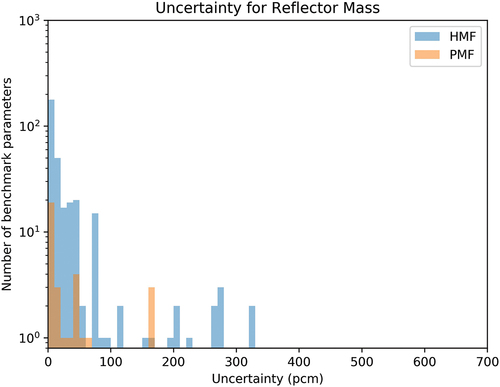
Histograms of benchmark uncertainties for reflector mass are shown in . Two benchmarks contributed to all uncertainties >200 pcm (HMF-056 and HMF-066). Two more contribute to the 5% of benchmark uncertainty parameters >100 pcm: HMF-058 and HMF-012. HMF-058 and HMF-066 were both experiments conducted at LLNL, reflected by beryllium. Furthermore, for the HMF series reflector mass benchmark uncertainty parameters, 72% were <20 pcm, 56% were <10 pcm, and 52% were <5 pcm. For the PMF series, only one benchmark contributes to the 9% of benchmark uncertainty parameters >100 pcm: PMF-046. Furthermore, 67% were <20 pcm, 58% were <10 pcm, and 21% were <5 pcm.
Fig. 23. Reflector mass uncertainty.
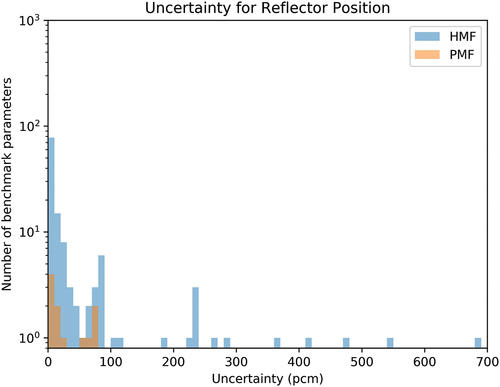
Histograms of benchmark uncertainties for reflector position are shown in . For the HMF series, reflector position has the highest mean and maximum value. The top 11%, which have uncertainty >100 pcm, all come from HMF-023, which is the benchmark contributing to the top 3% for all reflector uncertainty parameters. One other benchmark contributes to the remaining benchmark uncertainty parameters >68 pcm: HMF-096. Both these benchmarks were experiments conducted at ORNL. The 312 total reflector position benchmark uncertainty parameters for the HMF series come from only nine benchmarks. For the PMF series, only two benchmarks contribute to the reflector position benchmark uncertainty parameters: PMF-047 and SPMF-001.
Fig. 24. Reflector position uncertainty.
For reflector simplification, only four benchmarks contribute to the seven HMF series benchmark uncertainties, and all are <60 pcm; only one is >10 pcm. For the PMF series, <5 benchmark uncertainties were evaluated for reflector simplification, which is not a large enough sample size to draw any conclusions.
IV.E. Analysis Results by Structural Uncertainty Type
The structural uncertainty types were further evaluated because they are the third most frequently evaluated in HMF and PMF benchmarks. The min is not shown, as it is always zero. Units are uncertainty (pcm), except for the last column, which is the quantity of the applicable benchmark parameters. They are compared within each uncertainty type and separate for the PMF and HMF series. and summarize the mean, median, and max for each structural uncertainty type for HMF and PMF, respectively.
TABLE XV HMF Structural Uncertainty-Type Uncertainty Summary: Median, Mean, Max, and Total Number of Benchmark Fuel Parameters
TABLE XVI PMF Structural Uncertainty-Type Uncertainty Summary: Median, Mean, Max, and Total Number of Benchmark Parameters
Histograms of benchmark uncertainties for structural simplification are shown in . For HMF series benchmark uncertainties, four benchmarks contribute to the four parameters >100 pcm, unlike other uncertainty types, which are dominated by one or two benchmarks. These four benchmarks had different reflectors and different HEU and were conducted at three different facilities. For the PMF series, two benchmarks contribute to the benchmark uncertainty parameters >80 pcm: PMF-003 and PMF-004. Both these benchmarks were experiments conducted at LLNL. Only five total PMF benchmarks report structural simplification, the previous listed two and three others: PMF-046, PMF-017, and PMF-001.
Fig. 25. Structural simplification uncertainty.
V. CONCLUSIONS AND RECOMMENDATIONS
Benchmarks from HMF and PMF series have been reviewed, and their reported uncertainties have been tabulated. Benchmarks identified as “questionable” in previous efforts have been excluded. Using the tabulated results, the uncertainties were categorized by component type and uncertainty type. All have been evaluated, with some combination of groups to make the results more meaningful. Fuel was the more frequently evaluated parameter and makes up the largest total contribution to uncertainty, but each evaluated uncertainty is low. In contrast, structural components (specifically composition, dimension, density, and position uncertainty types) are evaluated much less often but have a higher median and mean. Regarding uncertainty type, dimension is evaluated most often, and mass has the lowest mean uncertainty. Position has the highest mean uncertainty, likely associated with gaps in extrapolated values to critical configurations.
The expected outcome of this paper was to identify which uncertainties can be improved in order to help reduce the total uncertainty when preparing future benchmark experiments—and specifically for the EUCLID project. It is clear that the fuel mass, fuel composition, and fuel dimensions are normally well characterized based on the lower uncertainties reported for them and should not be extrapolated or inferred. Fuel position has a large effect on the total uncertainty and can be difficult to ascertain when the fuel is inside a reflector and there are components moving inside the experiment. As such, gaps to achieve exactly critical should be avoided, and care should be taken to limit the position uncertainty of all components. Reflector dimensions and reflector density need to be focused on for uncertainty reduction since they are the largest uncertainties associated with reflectors and, when characterized rather than inferred, are quite small. The presence of structural components (e.g., composition, mass, position, and dimension) also has a significant effect, but structural components tend not to be as well characterized as the fuel, reflector, or other internal components. While it is possible to improve the characterization (e.g., composition, mass, position, and dimension) of structural components, it may be a significant amount of work without a significant gain. Documentation to the extent possible of the structures should be taken. Based on the results shown in this paper, efforts should be made to reduce the uncertainties associated with fuel, structure, and composition to help reduce the total keff uncertainty for future benchmark evaluations. The findings of this work will be useful for the design and execution of future fast metal systems, either at NCERC or at other experimental facilities.
Acknowledgments
Research reported in this publication was supported by the U.S. Department of Energy (DOE) Laboratory Directed Research and Development program at LANL. NCERC is supported by the DOE Nuclear Criticality Safety Program, funded and managed by the National Nuclear Security Administration (NNSA) for the DOE. Work at LANL was carried out under the auspices of the NNSA of the DOE under contract 89233218CNA000001.
Disclosure Statement
No potential conflict of interest was reported by the authors.
Additional information
Funding
References
- International Handbook of Evaluated Criticality Safety Benchmark Experiments, Organisation for Economic Co-operation and Development, Nuclear Energy Agency, Paris (2020).
- J. HUTCHINSON et al., “EUCLID: A New Approach to Improve Nuclear Data Coupling Optimized Experiments with Validation Using Machine Learning,” Proc. 15th Int. Conf. Nuclear Data for Science and Technology (ND2022), Virtual Meeting, July 25–29, 2022.
- J. HUTCHINSON et al., “Criticality Experiments with Fast 235U and 239Pu Metal and Hydride Systems During the Manhattan Project,” Nucl. Technol., 207, S62 (2021); https://doi.org/10.1080/00295450.2021.1908076.
- R. PETERSON, “Lady Godiva; An Unreflected Uranium-235 Critical Assembly,” LA-01614, Los Alamos National Laboratory (1953).
- R. PETERSON and G. NEWBY, “An Unreflected U-235 Critical Assembly,” Nucl. Sci. Eng., 1, 2, 112 (1956); https://doi.org/10.13182/NSE56-1.
- G. JARVIS et al., “Two Plutonium-Metal Critical Assemblies,” Nucl. Sci. Eng., 8, 525 (1960); https://doi.org/10.13182/NSE60-A25840.
- G. WHITESIDES, “Four Critical Facilities: Their Capabilities and Programs,” Proc. Topl. Mtg. Nuclear Criticality Safety, El Paso Texas, April 8–10, 1980.
- G. HANSEN and H. PAXTON, “Reevaluated Critical Specifications of Some Los Alamos Fast-Neutron Systems,” LA-4208, Los Alamos Scientific Laboratory (1969).
- K. PUSATERI and C. COUNCIL, “Defense Nuclear Facilities Safety Board Recommendation 93-2: The Need for Critical Experiment Capability,” Federal Register, 58 (1993).
- R. LABAUVE, “HEU-MET-FAST-001: Bare, Highly Enriched Uranium Sphere (Godiva),” International Handbook of Evaluated Criticality Safety Benchmark Experiments, Organisation for Economic Co-operation and Development, Nuclear Energy Agency, Paris (2002).
- J. FAVORITE, “Bare Sphere of Plutonium-239 Metal,” International Handbook of Evaluated Criticality Safety Benchmark Experiments, Organisation for Economic Co-operation and Development, Nuclear Energy Agency, Paris (2016).
- K. N. STOLTE et al., “Benchmark of the Kilowatt Reactor Using Stirling TechnologY (KRUSTY) Component Critical Configurations,” Nucl. Technol., 208, 625 (2022); https://doi.org/10.1080/00295450.2021.1945357.
- A. MCSPADEN, T. CUTLER, and A. OIZUMI, “Plutonium Metal Plates Moderated by Lead and Reflected by Copper,” International Handbook of Evaluated Criticality Safety Benchmark Experiments, Organisation for Economic Co-operation and Development, Nuclear Energy Agency, Paris.
- F. TRUMBLE, R. RATHBUN, and H. LUTZ, “Unmoderated Plutonium Metal Button Array,” International Handbook of Evaluated Criticality Safety Benchmark Experiments, Organisation for Economic Co-operation and Development, Nuclear Energy Agency, Paris (1996).
- V. DEAN and L. BLACKWOOD, “ICSBEP Guide to the Expression of Uncertainties,” International Handbook of Evaluated Criticality Safety Benchmark Experiments, NEA/NSC/DOC/(95)03/I, Organisation for Economic Co-operation and Development, Nuclear Energy Agency (2007).
- B. T. REARDEN, W. J. MARSHALL, and W. A. WIESLEQUISL, “Development of SCALE Tools for Sensitivity and Uncertainty Analysis Methodology Implementation (TSUNAMI) from SCALE 5 Through SCALE 6.2,” Trans. Am. Nucl. Soc., 123, 799 (2020); https://doi.org/10.13182/T123-33078.
- B. C. KIEDROWSKI et al., “Whisper: Sensitivity/Uncertainty-Based Computational Methods and Software for Determining Baseline Upper Subcritical Limits,” Nucl. Sci. Eng., 181, 17 (2015); https://doi.org/10.13182/NSE14-99.
- P. K. ROMANO et al., “OpenMC: A State-of-the-Art Monte Carlo Code for Research and Development,” Ann. Nucl. Energy, 82, 90 (2015); https://doi.org/10.1016/j.anucene.2014.07.048.
- T. CUTLER et al., “Validation of Jezebel Reactivity Coefficients and Sensitivity Studies,” Trans. Am. Nucl. Soc, 125, 627 (2021); https://doi.org/10.13182/T125-36811.
- N. KLEEDTKE et al., “Sensitivity Coefficients Calculated for the Prompt Neutron Decay Constant at or near Delayed Critical,” Nuclear Criticality Safety Division Topical Meeting (NCSD 2022), 685–693 (2022); https://www.ans.org/pubs/proceedings/article-51991/.
- J. ALWIN et al., “Investigating Fission Reaction Rate Ratio Sensitivities,” Nuclear Criticality Safety Division Topical Meeting (NCSD 2022), 93–102 (2022); https://www.ans.org/pubs/proceedings/issue-3214/.
- J. HUTCHINSON et al., “Investigation of Delayed Neutron Sensitivities for Several ICSBEP Benchmarks Using MCNP,” Trans. Am. Nucl. Soc., 125, 623 (2021); https://doi.org/10.13182/T125-36618/.
- D. NEUDECKER et al., “Informing Nuclear Physics via Machine Learning Methods with Differential and Integral Experiments,” Phys. Rev. C, 104, 034611 (2021); https://doi.org/10.1103/PhysRevC.104.034611.
- R. S. JOHN and N. R. DRAPER, “D-Optimality for Regression Designs: A Review,” Technometrics, 17, 15 (1975); https://doi.org/10.1080/00401706.1975.10489266.
- C. WERNER et al., “MCNP Users Manual – Code Version 6.2,” LA-UR-17-29981, Los Alamos National Laboratory (2017).
- D. NEUDECKER et al., “Questionable ICSBEP Criticality Benchmark Values and Underestimated Uncertainties Identified by Various Methods,” LA-UR-20-25879, Los Alamos National Laboratory (2020).
- “Database for the International Handbook of Evaluated Criticality Safety Benchmark Experiments (DICE): User’s Manual,” NEA/NSC/DOC(95)03/II, Organisation for Economic Co-operation and Development, Nuclear Energy Agency; https://www.oecd-nea.org/science/wpncs/icsbep/dice.html (2019).
- J. BESS and B. DOLPHIN, “PU-MET-FAST-042: Plutonium Hemispheres Reflected by Steel and Oil,” International Handbook of Evaluated Criticality Safety Benchmark Experiments, Organisation for Economic Co-operation and Development, Nuclear Energy Agency, Paris (2010).