
 ?Mathematical formulae have been encoded as MathML and are displayed in this HTML version using MathJax in order to improve their display. Uncheck the box to turn MathJax off. This feature requires Javascript. Click on a formula to zoom.
Abstract
The Swiss Light Source (SLS) is an electron synchrotron at the Paul Scherrer Institute established in 2001. With an electron energy of 2.4 GeV and 16 operation beamlines, it provides photons for research in various fields of science. This paper describes the approach for the dismantling of the SLS storage ring from the material clearance point of view. It summarizes the general methods used for clearance and their application to the material to be cleared due to the SLS 2.0 upgrade. The experimental research described in this work confirms the applicability of the developed dismantling and clearance approach.
I. INTRODUCTION
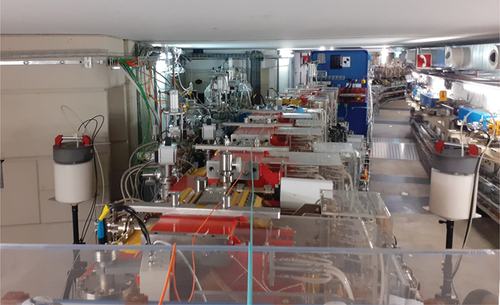
The Swiss Light Source (SLS) is a third-generation electron synchrotron at the Paul Scherrer Institute (PSI) established in 2001. With an energy of 2.4 GeV, it provides photon beams of high brightness for research in materials science, biology, and chemistry.[Citation1] Electrons are initially accelerated in a linear accelerator (linac) up to 100 MeV, then the booster ring (fixed on the inner wall of the tunnel) accelerates the electrons up to the final energy of 2.4 GeV. These electrons are further transported into the main storage ring through the transfer line, where their energy is maintained with two pairs of radio-frequency (RF) cavities. Using different insertion devices (dipoles and undulators), SLS produces X-rays of different energies at 16 experimental beamlines. An upgrade of the SLS to reach a higher quality of the generated light is foreseen between 2023 and 2025. For this purpose, the entire storage ring with a circumference of 288 m will be replaced. This leads to a significant amount of materials that have to be disassembled and taken out from the supervised areas of the accelerator facility. A big challenge of this upgrade is the development of a dismantling concept prior to disassembling because the machine will stay operational until the last day before the upgrade shutdown. Furthermore, the limited time for the dismantling does not allow for performing the decision measurements for the clearance in the accelerator tunnel at the dismantling phase. This paper describes the theoretical study and experimental research based on different methods that have been carried out to develop the dismantling and clearance approach for the SLS storage ring.
II. CLEARANCE APPROACH AND CLEARANCE AREAS ALONG THE ACCELERATOR
The removal of regulatory control by the regulatory body from radioactive material is defined in Switzerland by the Swiss Radiation Protection Ordinance.[Citation2] This process is also known as material clearance. According to the ordinance, material from supervised areas can be cleared using two methods:
1. Full measurement method. All materials must be measured by technical means to check the fulfillment of the following clearance criteria: the maximum ambient dose rate above background, at a distance of 10 cm from the surface, must be 0.1 µSv/h, and the specific activity must be below the clearance limit (which depends on the nuclide).
2. Simplified method. Material may be cleared without activity measurements by technical means if it can be demonstrated that the clearance limit is not exceeded by an assessment of the materials used or by excluding activation. This method does not represent any particular measurement or calculation technique, but it proves that activity over the clearance limit can be excluded for certain materials. To achieve this, the simplified method implies experimental studies of different types, which can provide the information about beam loss and material activation.
Considering the physics of the activation process and the properties of the accelerator, SLS was divided into three areas from a clearance point of view, as is shown in . The blue and yellow marked areas correspond to the injection part and bulky devices, like the undulators or RF cavities. The elevated beam losses, and hence higher activation rate, can occur there due to the interaction of the beam with accelerator components (e.g., for beam optimization). Furthermore, in these areas components have geometries that differ from the main part of the accelerator and require an individual approach for dismantling. The material from these areas will go through the clearance by the full measurement method.
Fig. 1. Classification of the SLS storage ring from a clearance point of view. The blue and yellow areas require an individual approach to their clearance, and the area marked with purple is subject to the generalized dismantling and clearance approach.
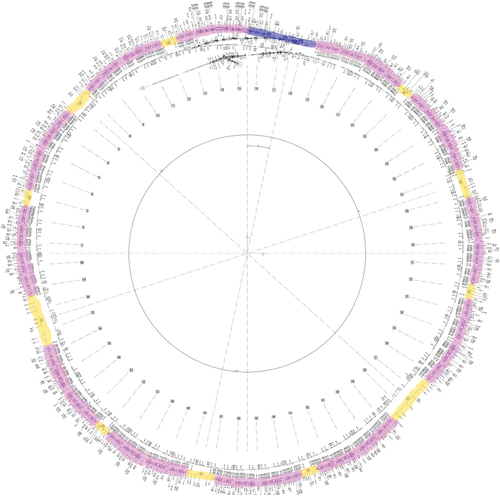
The area of SLS highlighted with the purple color consists of repeating structures with accelerator components and auxiliary systems installed on the girders. This area, referred to as girders area, covers about 80% of the accelerator length and consists of elements with similar geometrical dimensions and material compositions. Therefore, a generalized approach for dismantling and clearance of the material from the girder area has been developed.
III. DISMANTLING APPROACH FOR THE GIRDERS AREA
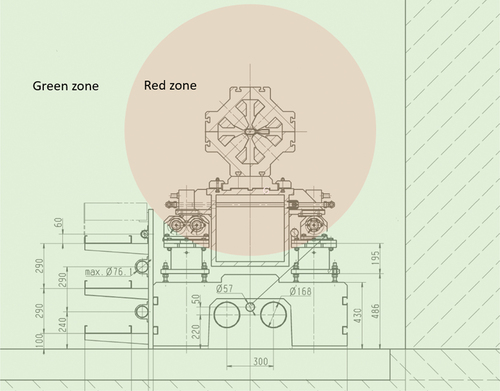
Material activation at a high-energy electron accelerator is mostly caused by two types of reactions: photonuclear interactions and neutron capture. The photonuclear activation is dominant downstream from the interaction point and has a higher lateral gradient than neutron capture activation, while neutrons are more penetrative and can cause activation in higher lateral distances.[Citation3] In general, the activation rate is decreasing with the distance from the beam loss point in the lateral direction. This allows for defining a distance around the accelerator pipe (also called the vacuum chamber) after which activation above clearance level is not to be expected, leading to an outer green zone and an inner red zone, as is shown in . Material from the green zone can be cleared using the simplified method for clearance as described previously, without full measurement of the activity by technical means. To define the precise dimensions of the red zone, an experimental investigation has been performed.
Fig. 2. Schematic representation of the clearance zoning for the girders area shown on the vertical section of the accelerator.
IV. EXPERIMENTAL INVESTIGATION OF THE BEAM LOSSES AT SLS
The beam losses along the storage ring have been investigated by measurements of the residual gamma dose rate and the neutron dose rate during SLS operation. Measurements of the residual gamma dose rate were carried out with a device suitable to measure the dose rate in contact with the vacuum chamber of the accelerator.[Citation4] These measurements have been repeated during long shutdowns for several years. Increased residual gamma dose is always found at same locations (hot spots), which indicates that the beam loss pattern along the storage ring is not significantly changing in time. No residual gamma dose rate greater than a 0.1 µSv/h value has been measured beyond the 30 cm from the vacuum chamber after a few days of cooling time.
The area with the highest measurable dose rate, which is referred to as the main hot spot, was used for further investigations as a location with the highest induced activity. The maximal measured value in contact with the vacuum chamber was 12 µSv/h after 1 h of shutdown and decreased down to 3 µSv/h after several days. Simultaneous measurements with active neutron dose rate meters indicate the highest neutron dose rate is closest to the main hot spot (with a precision of 1 m).
IV.A. Studies of Beam Loss Behavior
For the analysis of beam loss behavior, long-term measurements of the neutron dose rate were performed at a fixed position close to the main hot spot (at a distance of 80 cm from the vacuum chamber). Measurements were performed with survey instruments suitable for application at high-energy accelerators.[Citation5] The beam losses were investigated by the analysis of indicated neutron dose rate (blue in ) together with the SLS beam current (green in ).
Fig. 3. Exemplary results of the dose rate measurements during 1 h (blue) together with readings of the beam current monitor (green). The dashed line is used to distinguish the different loss types.
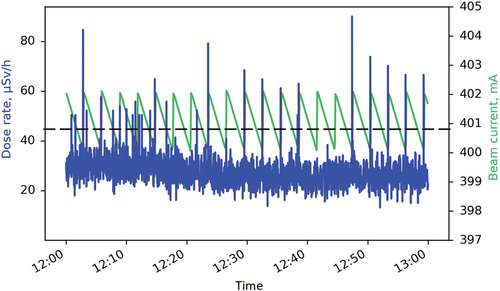
The beam current is continuously decreasing due to unavoidable losses, and every few minutes it is restored to a nominal level of 402 mA by injection of electrons. Taking into account the beam current of the storage ring, the measured dose rates can be divided into three types. The first type is a continuous dose rate caused by continuous beam loss, which is present whenever the beam is on (below the dashed line in ). The second type is dose rate spikes caused by specific events, e.g., injection (above the dashed line in ).
Additionally, the long-term measurements indicate the third type of dose rate is caused by significant or full beam losses (spikes above dashed line in ). These dose rates are referred to as type 3 dose rates. These events are not considered as normal operation and cannot be predicted. Additional measurements close to the other positions with an increased residual activity demonstrate a comparable behavior, but with lower magnitude.
Fig. 4. Dose rate measured during 3 days, including beam drops. The 60-s rolling mean values are shown as the orange line for visualization.
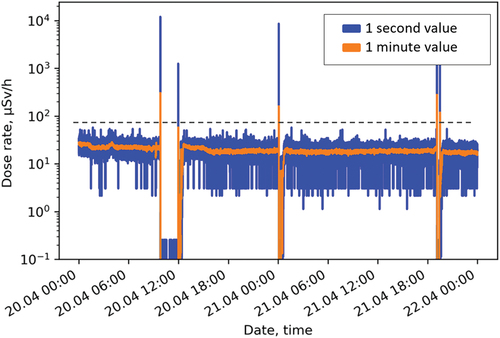
To study the partial contributions of different types of beam loss, long-term measurements at the main hot spot were performed during more than 120 working days considering the operation schedule of the SLS (around 3000 working hours). These measurements cover different modes of accelerator operation, including normal user operation, beam development, shutdowns, and startups.
Analysis of the measured values show that the accumulated dose from losses of type 3 causes 0.48% of the total dose integrated by the detector. The type 2 dose rate contributes 3.56% to the total dose. The integrated dose, indicated at 80 cm from the vacuum chamber at the main hot spot for the measurement within around 3000 h of operation, is about 87 mSv. Considering only the time when the beam was in operation, the average dose rate was 27.5 µSv/h. The major part of the dose, and hence the material activation, was generated by continuous beam losses during normal operation of the machine. For this reason, unpredictable beam losses of types 2 and 3 can be considered as negligible comparatively to the type 1 losses.
IV.B. Studies of the Neutron Field Distribution
Studies of the neutron field distribution within areas with increased residual dose rates were done by means of measurements with neutron survey instruments, activation of reference samples, and application of passive neutron dosemeters.
Measurements with active neutron survey instruments were performed with two measurement devices installed in the area with increased residual dose rates on both sides of the accelerator. They were positioned at beam height level at an equivalent distance from the vacuum chamber ().
Fig. 5. Neutron dose rate meters installed for the symmetry studies.
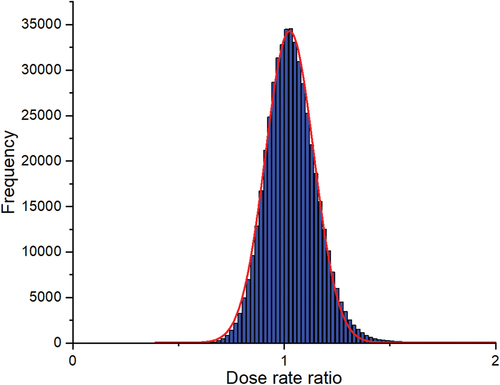
The dose rate was measured during a time period of 2 weeks, and the ratios between the two detector readings for values averaged over 60s were calculated. The calculated ratios, summarized as a histogram, have a distribution of Gaussian shape (). The histogram has a mean value equal to 1.04, which indicates acceptable symmetry for the application of the circular zoning approach.
Fig. 6. Histogram of the ratios for the neutron dose rates measured on both sides of the accelerator. The Gaussian fit is shown as the red line.
Activation of the reference material samples was performed at the main hot spot area in the vicinity of the vacuum chamber. The following materials were used for this study:
reference steel, highly alloyed type 289-1
copper
permendur, an alloy of iron (49%), cobalt (49%), and vanadium (2%).
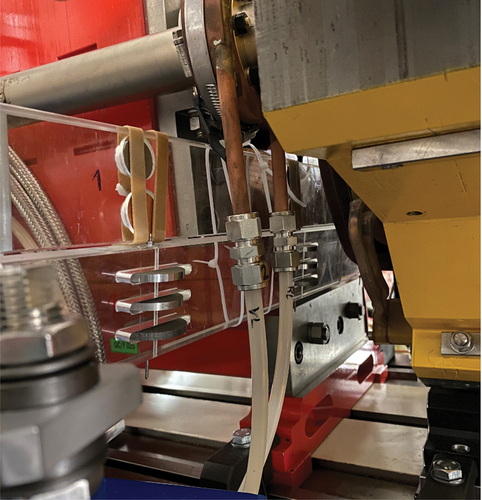
Steel and copper were chosen due to their high presence in the surroundings of the vacuum chamber. Permendur was used because cobalt has an important contribution in material activation and its activation products are relatively easy to detect. The reference samples, attached to two different holders, were placed between the two magnets located at the main hot spot area perpendicular to the direction of the electron beam right under the vacuum chamber. They were positioned in such a way that the center of the holder was located right below the vacuum chamber ().
Fig. 7. Holders with reference samples installed at the main hot spot.
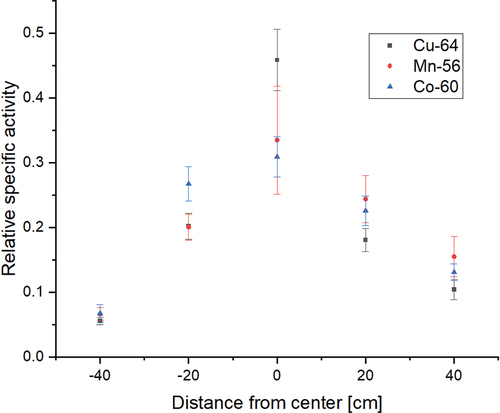
After 2 months of irradiation, reference samples were analyzed by means of gamma spectrometry in the accredited laboratory of PSI.[Citation6] Only the nuclides, which had activity over the detection limit in all five samples in a given material, were used for the evaluation. The distribution of the normalized measured specific activities shows a maximum at the center and decreases with distance from the vacuum chamber (), which is in agreement with expectations based on theoretical studies and results obtained from the literature.[Citation3] The error bars represent the uncertainty of the spectrometric measurements.
Fig. 8. Normalized relative specific activity of the activation samples measured at different distances to the vacuum chamber.
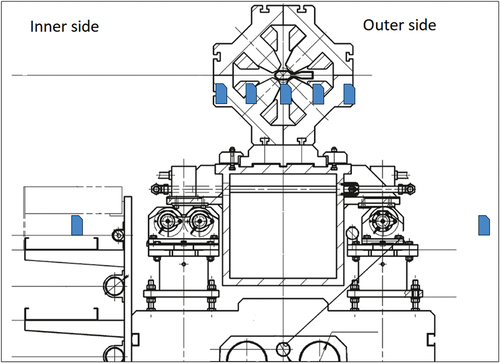
Investigation of the neutron field symmetry was also performed at the main hot spot using passive neutron dosemeters made of PADC (polyallyl diglycol carbonate).[Citation7] The size of dosemeters used for the study was 25 × 20 mm, with a 1.6-mm thickness. Three dosemeters per measurement position were used.
The dosemeters were installed in seven measurement positions (as shown in ):
five in the magnet surroundings at the same positions as the samples for activation
two at the cable trays, approximately at a 120-cm distance from the vacuum chamber.
Fig. 9. Measurement positions for the passive dosemeters at the main hot spot.
The distribution of the measured values is shown in . The error bars only include the uncertainty of the dose reading.
Fig. 10. Results of the measurements with passive dosemeters.
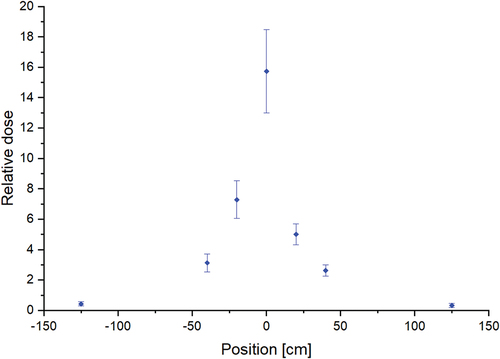
The results of the measurements with the passive dosemeters indicate the highest value is in the center and decreases with distance; the measured values on the left and on the right side deviated by less than 20%. All the measurements confirm the applicability of the developed cylindrical zoning approach for the SLS storage ring.
V. SAMPLING OF THE MATERIALS FROM THE SLS STORAGE RING
A number of samples were taken from the surroundings of the electron vacuum chamber at the main hot spot for the analysis of material activation. The selection of the samples included different materials, both metallic and polymers. Measurements were performed by means of gamma spectrometry and liquid scintillator counting.[Citation6] The results of the specific activity measurements are summarized schematically in . The samples are marked by different colors according to their specific activity: red samples have a specific activity higher than the clearance limit, green lower than the clearance limit, and blue samples have a specific activity lower than the detection limit of the measurement system (which is orders of magnitude below the clearance limit).
Fig. 11. Schematic representation of the measurement results for the samples taken from surroundings of the main hot spot. Red samples have a specific activity higher than the clearance limit, green samples lower than the clearance limit, and blue samples have a specific activity lower than the detection limit of the measurement system.
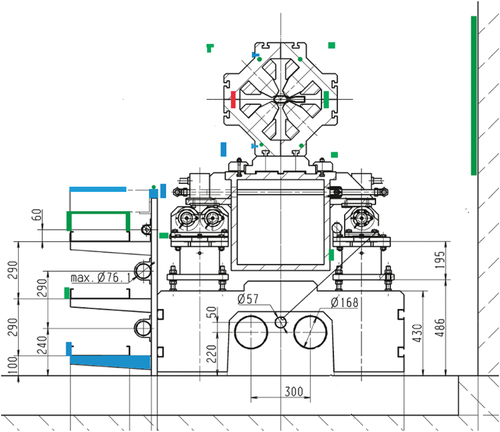
The results of the analysis demonstrated that only one sample from the magnet had a specific activity slightly higher than the clearance limit (0.12 0.02 Bq/g for 54Mn, with a clearance limit equal to 0.1 Bq/g). Other identified nuclides were 60Co, 57Co, and 58Co, but their activity was noticeably lower than that of 54Mn and below the clearance limits. This sample was taken from a distance of 22 cm from the vacuum chamber. Other samples from the magnet showed specific activities significantly lower than the clearance limit. Samples taken from the cable trays showed specific activities orders of magnitude lower than the clearance limit. The difference between the activity of the samples on the different sides is caused by the uncertainty of the measurements and the difference in material composition of the samples.
VI. CONCLUSION
The Swiss Light Source is foreseen to be upgraded, replacing the entire storage ring. A general dismantling and clearance approach was developed for the material to be cleared from the supervised areas. The effect of beam losses on residual activation was investigated with different methods during several measurement campaigns. The results of the experimental investigation demonstrated an agreement with the theoretical assumptions, which confirms the applicability of the developed clearance and dismantling approach.
The results of the measurements do not indicate activity higher than the clearance limit at the distance higher than 30 cm from the vacuum chamber at the location with the highest measurable residual dose rate (main hot spot). The measurements of the residual gamma dose rate did not indicate values above 100 nSv/h beyond a 30-cm radius from the vacuum pipe of the accelerator. Taking into account the results of the experimental studies and sample measurements, a safety factor of 2 was applied to this distance and 60 cm was defined as conservative value for the red zone radius. Even though the most part of the material stays in the red zone and must be measured completely for the clearance, application of the zoning approach and the exclusion of the activity from the surroundings of the girders (green zone) allows for reducing the time for dismantling work in the tunnel, and hence, for starting the assembly work earlier, which is an essential point for the accelerator upgrade. The developed approach is in agreement with the Swiss radiation protection ordinance.
Disclosure Statement
No potential conflict of interest was reported by the authors.
References
- A. STREUN et al., “SLS-2—The Upgrade of the Swiss Light Source,” J. Synchrotron Radiat., 25, 631 (2018); http://dx.doi.org/10.1107/S1600577518002722.
- “SR 814.501 Radiological Protection Ordinance 26 April 2017 (StSV),” Swiss Federal Law (Jan. 1, 2022); https://www.fedlex.admin.ch/eli/cc/2017/502/en.
- M. BRUGGER et al., “Activation Benchmark Study at a 2.5 GeV Electron Accelerator,” Prog. Nucl. Sci. Technol., 4, 363 (2014); http://dx.doi.org/10.15669/pnst.4.363.
- “RadEye PRD/PRD-ER Personal Radiation Detector,” ThermoFischer Scientific Website; https://www.thermofisher.com/order/catalog/product/4250671.
- G. P. MANESSI et al., “The Lupin Detector: Supporting Least Intrusive Beam Monitoring Technique Through Neutron Detection,” IBIC 2013: Proc. 2nd Int. Beam Instrumentation Conf. (2013).
- “Accredited Radioanalytic Laboratory of the Paul Scherrer Institute. Methods and Accreditation,” Paul Scherrer Institute; https://www.psi.ch/de/asi/radioanalytik.
- A. STABILINI et al., “Principal Component Analysis Applied to Neutron Dosimetry Based on PADC Detectors and FNTDs,” Radiat. Meas., 141, 106516 (2021); http://dx.doi.org/10.1016/j.radmeas.2021.106516.