
 ?Mathematical formulae have been encoded as MathML and are displayed in this HTML version using MathJax in order to improve their display. Uncheck the box to turn MathJax off. This feature requires Javascript. Click on a formula to zoom.
Abstract
To resolve discrepancies in evaluated cross sections among major nuclear data libraries, energy-differential neutron transmission and radiative capture yield of 181Ta were measured from 0.15 to 100 keV using multiple sample thicknesses. The new measurements provide resolution such that the resolved resonance region (RRR) can be evaluated up to at least 2.5 keV and the unresolved resonance region can be evaluated up to at least 100 keV. The transmission and capture yield measurements were modeled using resonance parameters from three major libraries to assess the predictive capability of each. It was found that JENDL-5.0 performed best in the RRR. Because of the poor performance of the U.S. ENDF/B evaluation, it is recommended that ENDF/B be reevaluated for 181Ta.
I. INTRODUCTION
Tantalum is a refractory metal, which means it is part of a group of metals with properties that make them especially resistant to heat and mechanical stress. Tantalum is chemically resistant[Citation1] and has a high melting temperature of 3269 K.[Citation2] The natural isotopic abundance of Ta is 99.99% 181Ta,[Citation3] which is attractive from the standpoint of nuclear interaction modeling. The natural properties of Ta make it a desirable material for the fabrication of devices that must survive extreme environments. Tantalum is used for the High Flux Isotope Reactor (HFIR) at Oak Ridge National Laboratory (ORNL)[Citation4]; for neutron-producing targets in accelerator facilities such as Rensselaer Polytechnic Institute (RPI); and for test tubes and crucibles in experimentation with molten actinides, where criticality safety is a concern.[Citation5–8] Recently, several efforts have been made in the field of criticality safety to better characterize Ta cross sections in models of critical experiments.[Citation9]
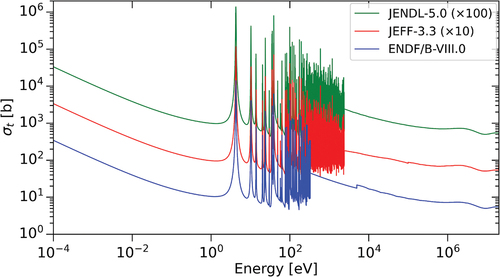
Existing evaluations of Ta can be used to estimate neutron reaction cross sections, and some of the major libraries include ENDF/B-VIII.0,[Citation10] JEFF-3.3,[Citation11] and JENDL-5.0[Citation12]; total cross sections from each library are plotted in . Note that the JEFF-3.3 and JENDL-5.0 evaluations are adjusted to better visualize the curves. These evaluations represent reaction probabilities for 181Ta to varying levels of accuracy based on the evaluation process, where semi-empirical models are adjusted to best represent experimental data. Significant discrepancies exist between the mean values of the cross sections of these evaluations, particularly between ENDF/B-VIII.0 and the others in the region of 0.3 to 2.5 keV. The impact of the cross-section differences in that energy region is demonstrated in a publication by Brown et al.[Citation13] None of these evaluations contain any uncertainty information.
Fig. 1. Discrepancies exist between major evaluations on the mean values of cross sections and where specific cross-section models should be applied. As an example, total cross section is shown here. None of the evaluations include uncertainty information.
Although many datasets are available for neutron interactions in the energy region of interest (i.e., less than 100 keV in the EXFOR database[Citation14]), only transmission measurements by Harvey et al.[Citation15] have the resolution required for updated resolved resonance region (RRR) evaluations. For this reason, new measurements are called for, with the greatest need being high-resolution radiative neutron capture measurements. To enable evaluators to improve the accuracy of neutron reaction cross sections for radiative transport simulations and estimate their uncertainties, new high-resolution neutron transmission and radiative capture measurements were performed at RPI in addition to a validation neutron transmission measurement.
II. MEASUREMENTS AT RPI
Rensselaer Polytechnic Institute is home to the Gaerttner Laboratory Linear Electron Accelerator (LINAC) Center. The Gaerttner LINAC accelerates electrons to approximately 50 MeV in short bursts of between 5 ns and several seconds, which strike a neutron-producing target made of plates of Ta cooled by flowing water, which also acts as a neutron moderator. This process results in bursts of neutrons being produced in a very short period of time at many different energies (often referred to as a pulsed white source). Neutron time-of-flight (TOF) experiments such as those performed at the Gaerttner LINAC provide a means for performing high-resolution energy-differential measurements. These measured quantities include neutron transmission and neutron capture yield, which provide the information necessary to calculate total cross section and capture cross section
, respectively. The TOF of a neutron can be related to the neutron’s energy,
where = neutron mass;
= speed of light;
= flight path, or it can be related to the distance that the neutron travels. TOF measurements require knowledge of the time at which a free neutron is produced
and the time at which a neutron interacts with the sample of interest or detection system
. The difference of these two quantities is defined as the TOF:
. At the RPI LINAC,
is determined from the time the collision of pulsed electrons produces a bremsstrahlung gamma flash in the neutron-producing target. These bremsstrahlung photons cause
reactions in the target and produce a burst of neutrons in a range of energies.
Neutron transmission measurements record the neutron count rate of a detector at some fixed for both a sample in the beam
and no sample in the beam (open)
. The background-subtracted ratio of these two quantities is the neutron transmission:
where = time;
= time-dependent background for the “sample-in” measurement;
= time-dependent background for the open measurement;
= sample-in constant background;
= constant background for the open measurement. Beam monitors track the neutron production as a function of time to determine the normalization factors
,
,
, and
, which are used to normalize the count rates
and
.
Neutron capture measurements use photon-sensitive detectors to record the rate of photons resulting from radiative neutron capture. The count rate observed by the C6D6 detector is
where = efficiency to detect a photon;
= area illuminated by the neutron beam;
= neutron flux on the sample;
= capture yield of Ta;
= time-dependent background recorded by the detector;
= constant background. Here, we define capture yield as the number of capture events per incident neutron. The quantities of interest are the total cross section
and capture cross section
, which are related to the transmission,
and primary capture yield,
where is the sample thickness in units of atoms/b. Note that primary capture yield
is the probability of the first neutron reaction in the sample to be a radiative capture event and is not equivalent to the total capture yield
. The total capture yield that is measured can include captures in surrounding structures (false capture) and captures that occur after a neutron has undergone scattering reactions in the sample (multiple scattering).
Neutron cross sections are often categorized into several different regions of energy, each with a corresponding semi-empirical model that best describes the physics of the region. There is an RRR model for the lowest-energy region (excluding special solid-state considerations), the unresolved resonance region (URR) model for energies just beyond the RRR, and the fast or continuum region for where the cross section varies slowly as a function of energy.
Each of the three experiments discussed here has small variations in the burst width, flight path, and neutron production target to optimize different aspects of the measurements. In general, the goal of these measurements is to produce high-resolution measurements of total and capture cross section where little to none currently exist. Detailed sample geometry and composition can be found in Ref. [Citation16]. A summary of all experimental parameters for the three measurements is given in .
TABLE I Experimental Parameters for All Three Experiments*
II.A. 100-m Transmission
The 100-m transmission detector is a modular array of four 6Li glass detectors coupled to eight photomultiplier tubes (PMTs), called the Mid-Energy LI Neutron Detector Array (MELINDA). This detector setup is discussed at length by Bahran[Citation19] and Brown.[Citation16] The design of the MELINDA detector optimizes the resolution and count rate possible for the region of neutron energies of approximately 1 to 200 keV. Because one of the goals of this set of measurements is to produce high-resolution transmission data in the energy region above the current ENDF/B-VIII.0 RRR (the maximum of which is 330 eV), this detector system is ideal for much of that energy range. It also provides data that can be used for URR evaluations, which will likely be needed up to 100 keV.
Multiple sample thicknesses were measured to increase the accuracy of a Bayesian evaluation using cross-section models. The evaluation process includes thickness-dependent experimental corrections, and including multiple thicknesses reduces the dependence on those corrections. Another reason for multiple thicknesses is that thin and thick samples are capable of testing different parameters. For measurements using the 100-m detector, 1-, 3-, and 6-mm–thick (i.e., 0.00566 ± 0.00008, 0.017131 ± 0.0001, and 0.03356 ± 0.00007 atoms/b) Ta samples of 99.95% purity were used. A depleted uranium reference sample of 0.08210 atom/b in thickness was also measured.
To maximize the neutron count rate, the MELINDA detector required a direct line of sight to the neutron production target, as opposed to the 35-m transmission discussed below. However, this configuration comes at the cost of increased time-dependent photon background, presumably from radiative capture of neutrons in hydrogen nuclei. The time-dependent background consists of several components: time-dependent neutron background from neutrons scattered out of “true” energy and into a different energy bin, time-dependent photon background from the bremmstrahlung reaction in the production target and neutron capture in the hydrogen and tantalum in the target, and room background. The background was measured using the “black resonance” method.[Citation22] The RPI LINAC was operated with a repetition rate of 400 Hz and approximately 50-MeV electron energy using the “C-shaped” neutron-producing target described by Overberg et al.[Citation17] A large helium tank was positioned between the target and the sample to reduce scattering from the air.
For neutron transmission measurements (and capture yield), interaction events are recorded by a detector as a function of time and are added to a finite-width TOF bin . These bins have some width in time in which they were open collecting counts for each LINAC pulse and corresponding electronic trigger. The total number of triggers
is used to determine the total time counts collected. Using these parameter definitions, the count rate is as follows:
The count rate variables necessary to calculate transmission are enumerated in EquationEq. (2)(2)
(2) . As described in Ref. [Citation16], the count rates were dead time corrected. The time-dependent background is assumed to behave approximately as a power function. To quantify the background at specific points in the TOF spectrum, the black resonance method was used. Cobalt-59 has a strong isolated resonance that when placed in the neutron beam, removes all neutrons near 132 eV, leaving only time-dependent and constant background to be counted. Cobalt was placed in the beam for the duration of the experiment as a “fixed notch.” Mg, Al, Na, and Mn have strong resonances at 84, 35, 2.8, and 0.33 keV, respectively. These materials were placed in the beam during background runs to find the shape of the background. The background function
was fit to the black resonance notches at 84, 35, 2.8, and 0.33 keV using a nonlinear least-squares fit. This power-law function was chosen simply because it fit well with a limited number of parameters (less than the number of data points) and is commonly used for TOF background fits (e.g., Ref. [Citation23]). The fitted background shape was then normalized to the fixed notch count rate in the production data (i.e., normal data excluding the background runs) to determine and
. The transmission count rates and fitted backgrounds are shown in . The open and sample background shapes are identical (parameter
is the same for each), with different normalizations according to the fixed notch for each. This background method also agrees well with the reference 238U transmission data.
Fig. 2. Sample-in and sample-out count rates and corresponding backgrounds. The solid lines represent the measured open beam count rate and calculated open background count rate. The dashed lines represent the sample count rate and calculated sample background count rate.
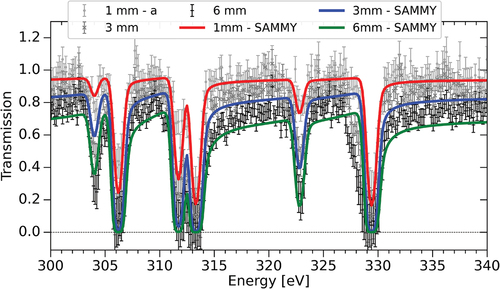
The transmissions in represent the full energy region of reliable transmission data and uncertainties, specifically 0.15 to 100 keV. If repeating this measurement, the background characterization could be extended to 250 keV by including a Li notch filter. The reduction in variance of the measured transmission from 3 to 10 keV demonstrates the transition from the RRR to the URR. Outside of this energy range, the background is unconstrained by measurement and could only be extrapolated. shows an example of the comparison of the data for 1-, 3-, and 6-mm samples compared with theoretical transmission for those thicknesses from a SAMMY[Citation24] calculation using ENDF/B-VIII.0[Citation10] resonance parameters.
Fig. 3. All three transmission measurements. Note the large variance at 5.9 and 35 keV caused by structural Al.
Fig. 4. ENDF/B-VIII.0 resonance parameters are used in a SAMMY calculation to model the experimental transmission. The end of the ENDF/B-VIII.0 RRR is shown here, where a poor fit to the 330-eV resonance can be seen. Note that sample “1 mm - a” is nearly identical but physically different from sample “1 mm - b” used in the capture measurements.
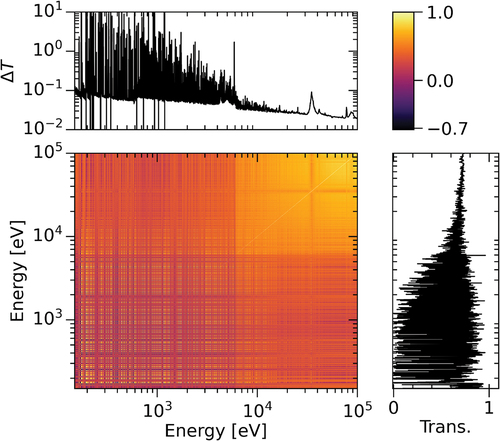
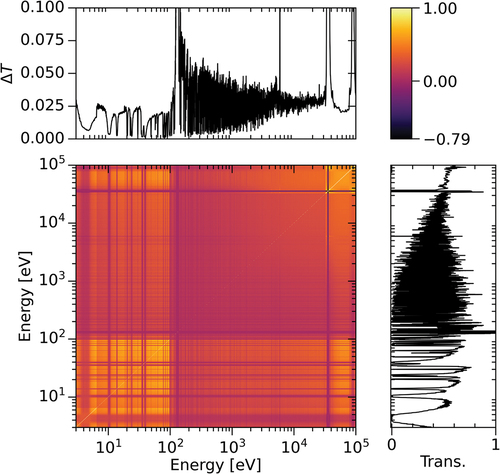
Uncertainties were linearly propagated from measured data and fitted background parameters to the final transmission values to form the final covariances associated with each measurement using the nuctools code[Citation25] based on the equations in Ref. [Citation16]. As an example, the correlation matrix for the 6-mm sample is given in . The structure seen in the image is a result of the resonant structure in the cross section. One of the most significant contributors to the total uncertainty in transmissions in the peak of resonances is the fitted background parameter from EquationEq. (7)
(7)
(7) , where
. This is an unusually large uncertainty in the background, possibly due to the photon background contribution from a direct view of the neutron production target. In the energy regions between resonance peaks, the
uncertainty is lower than at the peaks and is dominated by counting statistics for
and
, as is the URR.
Fig. 5. Covariance for transmission as a function of energy, linearly propagated from the systematic and statistical uncertainty in the variables of EquationEq. (2)(2)
(2) .
II.B. 45-m Capture
The goals of the 45-m capture measurement are nearly identical to those of the 100-m transmission. However, the energy region of reliable data reaches up to 200 keV. High-resolution capture yield data are less available, so it is arguably more important than the transmission. Samples used in the capture experiment are 1-and 2-mm-thick (0.005631 and 0.011179 atoms/b) Ta samples of 99.95% purity, an enriched B4C sample[Citation20] used to measure the neutron rate incident on the sample, and a Pb sample to measure the rate of gamma rays scattered from the beam into the detectors. Count rate was calculated in the same manner as transmission [EquationEq. (6)(6)
(6) ], and the same dead time correction model was applied. The electronic data acquisition is different from the 100-m transmission, as it is digitized. The digitization of voltage pulses read from the PMTs allows for greater flexibility in postanalysis of the data and significantly increases the amount of information stored for each event.
Reducing measured capture rates to capture yield requires analysis of a greater complexity than the transmission. The photon detection efficiency requires detailed knowledge of the energy of the resulting gamma cascade energies
as well as the chemical makeup and geometry of the detectors used. The capture detection system was designed to detect no more than one photon per gamma cascade following neutron capture; thus, the total energy detection principle[Citation26] and the pulse-height weighting technique[Citation27] could be employed to relate the pulse height observed in the detector to
and, therefore, to
. We assume that the efficiency to detect a photon is proportional by constant
to the photon energy
as
and the efficiency to detect a capture event is related to the efficiency to detect a given photon
in the cascade as
The capture efficiency can be approximated by
if . Note that
is the multiplicity of the gamma cascade.
In reality, detectors do not behave with efficiency in perfect linear proportionality to energy. The typical interaction of a photon with C6D6 molecules is Compton scattering, which deposits energy according to some probability distribution
, which is referred to as the response function. This response function is a function of
and
and along with the weighting function
satisfies the following relationship:
where the constant is a lower-energy cutoff applied to the raw data to eliminate background events that typically deposit small amounts of energy.
Following the example of Borella et al.[Citation28] and McDermott et al.,[Citation29] the response functions of the C6D6 detectors to varying monoenergetic photons were simulated using the Monte Carlo code MCNP 6.1.[Citation30] The response functions were then used to calculate weighting functions for each of the detectors, which were applied to the recorded counts data. The weighted counts for a given TOF were then calculated as
The background for the weighted count rate
is given by the open beam (no sample) count rate
, weighted in the same fashion as the Ta; here, the weighting is denoted by a superscript. An additional “in beam gamma scattering” background is given by the net count rate for Pb. The net count rate for Pb is
and the net count rate for Ta is
Typically, is much smaller than the open count rate
and is almost negligible for neutron energies below 100 keV. The photon weighting correction
normalizes the Pb weighting to the weighting of Ta;
is described elsewhere.[Citation20,Citation29]
To calculate the yield, the rate at which neutrons strike the sample must be determined. This is done using the well-known (n,) cross section of 10B. Here, B4C enriched to 91.7%[Citation20] is placed in the beam, and the capture rate
is measured. The count rate for B4C remains unweighted, as neutron capture produces only a characteristic 477-keV photon in the energy region of interest. Background is subtracted from
, and the net count rate is divided by the MCNP version 6.1[Citation30]–simulated B4C photon production yield
to calculate the neutron rate,
The capture yield for 181Ta can then be calculated by the ratio of the capture event rate to the incident neutron rate scaled by the normalization constant , as shown in EquationEq. (16)
(16)
(16) :
The normalization constant is necessary because the absolute neutron flux was not known—only the time-dependent shape of the flux. Often, an absolute normalization of capture rate can be determined using a capture resonance at low energies (such as the 4-eV resonance), but in this case the data were unreliable in that energy range. In a procedure similar to that employed by Corvi et al.,[Citation31] resonances observed in the transmission measurement made at 100 m were fit using SAMMY to determine
and
and subsequently used to normalize the flux. The resonances used were found at
eV, with
meV and
meV, respectively. For each of these,
, and the capture area
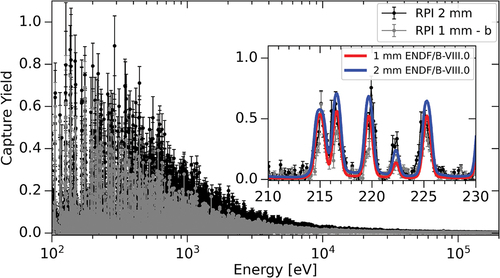
which is, therefore, sensitive to the neutron width (derivation given in Refs. [Citation16] and [Citation32]. Once the partial widths were determined with transmission, the same two resonances in the capture yield measurement were fitted using a normalization parameter in SAMMY. The expected error due to the normalization was approximately 3%. It is recommended that the normalization uncertainty and the correlation to the cross section be included as part of the prior in a Bayesian fit for evaluations. Carlson et al. estimate approximately 1% uncertainty on the
cross section.[Citation33] Capture yields for the 1- and 2-mm samples are shown in .
Fig. 6. Capture yield for the 1- and 2-mm samples. Though capture yield should never be greater than unity, the uncertainty band in this case includes values that are . This is expected because the normalization introduces
uncertainty. Note that the 1-mm sample includes the identifier “b,” which simply indicates that it is a different 1-mm sample from that of the 100-m transmission measurement (which was “1 mm – a”). The difference between “a” and “b” is mostly negligible, but each has unique documentation.
II.C. 35-m Transmission
The 35-m transmission measurement has been well described by Brown et al.[Citation13] The raw data from that measurement was re-binned and re-reduced to transmission here to adjust the resolution of the reported data. The measured count rate for the open beam and sample-in configurations, as well as their associated backgrounds, are shown in .
Fig. 7. The count rate for the thick Ta transmission validation measurement. The solid lines represent the measured open beam count rate and calculated open background count rate. The dashed lines represent the sample count rate and calculated sample background count rate.
The background was determined using the black resonance method, which is the same as that of Brown et al.[Citation13] and the 100-m transmission. Background measurements for Na (2.8-keV) and Li (250-keV) notches were collected in addition to the production data collection. With the addition of these two notches, there are four total background points to fit a background function with for the Ta sample-in, sample-out, and uranium sample-in measurements. The decaying exponential function,
was fit to the data, and the values of and
were determined by normalization to the 35-keV Al fixed notch. The transmission for the 12-mm sample is shown in along with that of the depleted uranium sample.
Fig. 8. (Top) 12-mm Ta and (bottom) thick U sample transmissions as measured at the 35-m detector. Notice the matching structure in each measurement at 132 eV from the Co fixed notch and 5.9, 35, and 88 keV from the Al fixed notch.
The covariance calculation for the 12-mm Ta sample is identical to that performed for the 1-, 3-, and 6-mm samples. The correlation, transmission, and standard deviation are all plotted as a function of energy in .
Fig. 9. Correlation, transmission, and standard deviation for the 12-mm Ta sample measured at 35 m. Spikes in uncertainty correspond to low count rates at resonances of Co and Al.
III. COMPARISON TO CURRENT EVALUATION
In comparing these new data to some of the major evaluations of 181Ta, conclusions can be drawn about the overall performance of the library by its ability to predict both neutron transmission through each of the samples and neutron capture yield. The comparison of ENDF/B-VIII.0 to each set of the transmission data and capture yield data from RPI is shown in .
Fig. 10. ENDF/B-VIII.0 resonance parameters were used as input to SAMMY to calculate theoretical neutron transmission and capture yield as a comparison to the measurements. The fit becomes worse as energy increases toward 330 eV.
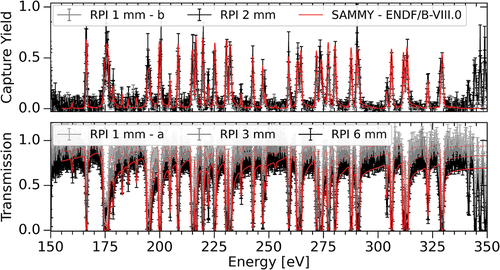
In the limited energy window where the data are shown, it can be seen that the ENDF/B-VIII.0 evaluation results in a predicted transmission that performs progressively worse as neutron energy increases toward 330 eV, especially between resonances (e.g., between 310 and 325 eV).
A more holistic measure of the performance of each library in the RRR is the value of the model compared to the measured data, as calculated by SAMMY. For each of the SAMMY calculations, the experimental parameters were kept the same, and only the resonance parameters were changed to either ENDF/B-VIII.0 (ENDF-8.0), JEFF-3.3, or JENDL-5.0. The resulting
values from the fits are given for each sample measurement and each library in .
TABLE II Resulting Values from the Fits for Each Sample Measurement and Each Library*
It should be noted that whereas ENDF/B-VIII.0 defines a different energy region for the RRR than the other evaluations,Footnotea
the values in are divided by the number of data in each measurement and, therefore, are a relatively fair comparison. Using the average
value of each library as a metric of their performance, JEFF-3.3 and JENDL-5.0 are remarkably similar, with JENDL-5.0 performing slightly better. This is likely derived from the fact that JENDL-4.0[Citation34] used the JEFF-3.3 parameters and that JENDL-5.0 evaluators made small adjustments for the updated evaluation. The 100-m transmission data and 45-m capture yield data were designed to resolve resonances beyond 2.5 keV, making them valuable in a future evaluation of the 181Ta RRR. This can be demonstrated by calculating the experimental energy resolution as a function of incident neutron energy as shown in .
Fig. 11. The experimental energy resolution based on SAMMY 8.1 fit to 238U. The 100-m transmission and 45-m capture yield measurements are capable of resolving resonances beyond 2.5 keV (upper limit of JEFF-3.3), and the 35-m validation transmission is capable of resolving resonances up to approximately 1.5 keV. The width plotted here is taken as the full-width at half-maximum of the resolution function at a given neutron energy. The 100-m transmission with the 3-mm sample is shown for comparison to the resolution function on the inset plot.
Comparing evaluations to the URR, more obvious discrepancies appear. The work by Brown et al.[Citation13] shows the 35-m validation transmission measurement simulated with MCNP 6.1 using several evaluated libraries. The resulting theoretical transmissions are compared with the validation measurement, which showed that significant discrepancies exist in the URR. In the case of ENDF/B-VIII.0, the URR model is applied only up to 5 keV, and the transmission above 5 keV does not properly account for resonance self-shielding. In the case of the other evaluations, the URR does not match the data up until approximately 25 keV. Based on the performance of thick-sample transmission simulations presented in Ref. [Citation13], a new 181Ta evaluation including the current data would be recommended.
IV. CONCLUSION
In this work, new measurements of 181Ta were performed to provide high-resolution capture data where none previously existed, high-resolution transmission data, and thick-sample transmission data capable of validating resolved and unresolved evaluated parameters. All transmission measurements include full experimental covariance matrices. To properly account for uncertainty in capture data, it is recommended to incorporate the aforementioned normalization uncertainties into the evaluation method (preferably following the methods employed in the SAMMY code) rather than propagate them to a full a priori data covariance matrix. In comparison with existing evaluations, it was found that the JENDL-5.0 evaluation performed the best by the metric. It is the authors’ recommendation that the ENDF/B evaluation be updated to include the new data presented here, that the resolved and unresolved resonance regions be extended to match the JEFF-3.3 and JENDL-5.0 evaluations, and that performance be improved for thick-sample neutron transmission.
Acknowledgments
The authors wish to thank Peter Brand, Michael Bretti, Azeddine Kerdoun, Larry Krusieski, and Matt Gray for their skillful operation of the RPI LINAC and diligent support with mechanical and electrical work. This work was supported by the Nuclear Criticality Safety Program, funded and managed by the National Nuclear Security Administration for the U.S. Department of Energy. ORNL is managed by UT-Battelle, LLC, under contract number DE-AC05-00OR22725 for the U.S. Department of Energy.
This manuscript has been authored by UT-Battelle LLC under contract DE-AC05-00OR22725 with the U.S. Department of Energy (DOE). The U.S. government retains and the publisher, by accepting the article for publication, acknowledges that the U.S. government retains a nonexclusive, paid-up, irrevocable, worldwide license to publish or reproduce the published form of this manuscript, or allow others to do so, for U.S. government purposes. DOE will provide public access to these results of federally sponsored research in accordance with the DOE Public Access Plan (http://energy.gov/downloads/doe-public-access-plan).
Disclosure Statement
No potential conflict of interest was reported by the author(s).
Additional information
Funding
Notes
a ENDF/B-VIII.0 defines the region of 0 to 330 eV as the RRR, and JEFF-3.3 and JENDL-5.0 define the RRR as the region from 0 to 2.5 keV.
References
- D. F. TAYLOR, “Acid Corrosion Resistance of Tantalum, Columbium, Zirconium, and Titanium,” Ind. Eng. Chem., 42, 4, 639 (1950); https://doi.org/10.1021/ie50484a023.
- L. MALTER and D. LANGMUIR, “Resistance, Emissivities and Melting Point of Tantalum,” Phys. Rev., 55, 8, 743 (1939); https://doi.org/10.1103/PhysRev.55.743.
- M. WEISER et al., “Atomic Weights of the Elements 2011,” Pure Appl. Chem., 85, 5, 1047 (2013); https://doi.org/10.1351/PAC-REP-13-03-02.
- C. R. DAILY and D. CHANDLER, “Development and Testing of Nuclear Data Libraries for Improved Energy Deposition Modeling,” presented at 18th Topical Meeting of the Radiation Protection & Shielding Division of the American Nuclear Society (ANS RPSD 2014), Knoxville, Tennessee, September 14–18, 2014.
- J. ROY et al., “Thermodynamic Properties of U, Np, Pu, and Am in Molten LiCl-KCl Eutectic and Liquid Cadmium,” J. Electrochem. Soc., 143, 8, 2487 (1996); https://doi.org/10.1149/1.1837035.
- L. MULLINS, A. BEAUMONT, and J. LEARY, “Distribution of Americium Between Liquid Plutonium and a Fused Salt. Evidence for Divalent Americium,” J. Inorg. Nucl. Chem., 30, 1, 147 (1968); https://doi.org/10.1016/0022-1902(68)80073-9.
- L. KIRKBRIDE, “Molten Plutonium Alloys as Fast Reactor Fuels,” LA-DC-7336, Los Alamos National Laboratory (1965).
- B. EL-DASHER et al., “Corrosion of Oxide Dispersion Strengthened Iron–Chromium Steels and Tantalum in Fluoride Salt Coolant: An In Situ Compatibility Study for Fusion and Fusion–Fission Hybrid Reactor Concepts,” J. Nucl. Mater., 419, 1–3, 15 (2011); https://doi.org/10.1016/j.jnucmat.2011.07.036.
- C. PERCHER, S. KIM, and D. HEINRICHS, “LLNL Final Design for Thermal/Epithermal eXperiments (TEX) with ZPPR Plutonium/Aluminum Plates with Polyethylene and Tantalum,” LLNL-TR-665821, Lawrence Livermore National Laboratory (2014).
- D. BROWN et al., “ENDF/B-VIII.0: The 8th Major Release of the Nuclear Reaction Data Library with CIELO-Project Cross Sections, New Standards and Thermal Scattering Data,” Nucl. Data Sheets, 148, 1 (2018); https://doi.org/10.1016/j.nds.2018.02.001 (accessed July 2, 2019).
- JEFF-3.3 website (2017); https://www.oecd-nea.org/dbdata/jeff/jeff33/index.html#neutron (accessed Dec., 27, 2018).
- O. IWAMOTO et al., “Status of JENDL,” Proc. Int. Conf. Nuclear Data for Science and Technology (ND 2019), Beijing, China, May 12–16, 2019.
- J. M. BROWN et al., “Validation of Unresolved Neutron Resonance Parameters Using a Thick-Sample Transmission Measurement,” Nucl. Sci. Eng., 194, 3, 221 (2020); https://doi.org/10.1080/00295639.2019.1688087.
- V. ZERKIN and B. PRITYCHENKO, “The Experimental Nuclear Reaction Data (EXFOR): Extended Computer Database and Web Retrieval System,” Nucl. Instrum. Methods Phys. Res., Sect. A, 888, 31 (2018); https://doi.org/10.1016/j.nima.2018.01.045.
- J. HARVEY et al., “High-Resolution Neutron Transmission Measurements on 235U, 239Pu, and 238U,” CONF-880546, Oak Ridge National Laboratory (1988).
- J. M. BROWN, “Measurements, Evaluation, and Validation of Ta-181 Resolved and Unresolved Resonance Regions,” PhD Dissertation, Rensselaer Polytechnic Institute, Department of Mechanical, Aerospace, and Nuclear Engineering (2019).
- M. OVERBERG et al., “Photoneutron Target Development for the RPI Linear Accelerator,” Nucl. Instrum. Methods Phys. Res., Sect. A, 438, 2, 253 (1999); https://doi.org/10.1016/S0168-9002(99)00878-5.
- B. E. MORETTI, “Molybdenum Neutron Transmission Measurements and the Development of an Enhanced Resolution Neutron Target,” PhD Dissertation, Rensselaer Polytechnic Institute, Department of Mechanical, Aerospace, and Nuclear Engineering (1996).
- R. BAHRAN, “A New High Energy Resolution Neutron Transmission Detector at the Gaerttner LINAC Center and Isotopic Molybdenum Total Cross Section Measurements in the keV-Region,” PhD Dissertation, Rensselaer Polytechnic Institute, Department of Mechanical, Aerospace, and Nuclear Engineering (2013).
- B. MCDERMOTT, “Resonance Region Capture Cross Section Measurements in Iron and Tantalum Using a New C6D6 Detector Array,” PhD Dissertation, Rensselaer Polytechnic Institute, Department of Mechanical, Aerospace, and Nuclear Engineering (2016).
- D. P. BARRY, “Neodymium Neutron Transmission and Capture Measurements and Development of a New Transmission Detector,” PhD Dissertation, Rensselaer Polytechnic Institute, Department of Mechanical, Aerospace, and Nuclear Engineering (2003).
- D. SYME, “The Black and White Filter Method for Background Determination in Neutron Time-of-Flight Spectrometry,” Nucl. Instrum. Methods Phys. Res., 198, 2, 357 (1982); https://doi.org/10.1016/0167-5087(82)90276-9 (accessed: July 3, 2019).
- G. AERTS et al., “Neutron Capture Cross Section of 232Th Measured at the n_TOF Facility at CERN in the Unresolved Resonance Region up to 1 MeV,” Phys. Rev. C, 73, 5, 54610 (2006); https://doi.org/10.1103/PhysRevC.73.054610.
- N. LARSON, “Updated Users’ Guide for SAMMY: Multilevel R-Matrix Fits to Neutron Data Using Bayes’ Equations,” ORNL/TM-9179/R8, Oak Ridge National Laboratory (2008).
- J. M. BROWN, Nuctools website; https://www.osti.gov/doecode/biblio/66026 (2023).
- M. MOXON and E. RAE, “A Gamma Ray Detector for Neutron Capture Cross Section Measurements,” Nucl. Instrum. Methods, 24, 445 (1963); https://doi.org/10.1016/0029-554X(63)90364-1.
- R. MACKLIN and J. GIBBONS, “Capture-Cross-Section Studies for 30–220-keV Neutrons Using a New Technique,” Phys. Rev., 159, 4, 1007 (1967); https://doi.org/10.1103/PhysRev.159.1007.
- A. BORELLA et al., “The Use of C6D6 Detectors for Neutron-Induced Capture Cross Section Measurements in the Resonance Region,” Nucl. Instrum. Methods Phys. Res., Sect. A, 577, 3, 626 (2007); https://doi.org/10.1016/j.nima.2007.03.034.
- B. J. MCDERMOTT et al., “181Ta(n, γ) Cross Section and Average Resonance Parameter Measurements in the Unresolved Resonance Region from 24 to 1180 keV Using a Filtered-Beam Technique,” Phys. Rev. C, 96, 014607 (2017); https://doi.org/10.1103/PhysRevC.96.014607.
- T. GOORLEY et al., “Initial MCNP6 Release Overview,” Nucl. Technol., 180, 3, 298 (2012); https://doi.org/10.13182/NT11-135.
- F. CORVI et al., “Resonance Neutron Capture in 60Ni Below 450 keV,” Nucl. Phys. A, 697, 3, 581 (2002); https://doi.org/10.1016/S0375-9474(01)01267-2.
- S. GLASSTONE and G. BELL, Nuclear Reactor Theory, Chap. 5, p. 398, Litton Educational Publishing, Inc., New York (1970).
- A. CARLSON et al., “International Evaluation of Neutron Cross Section Standards,” Nucl. Data Sheets, 110, 12, 3215 (2009); https://doi.org/10.1016/j.nds.2009.11.001.
- K. SHIBATA et al., “JENDL-4.0: A New Library for Nuclear Science and Engineering,” J. Nucl. Sci. Technol., 48, 1, 1 (2011); https://doi.org/10.1080/18811248.2011.9711675.