
 ?Mathematical formulae have been encoded as MathML and are displayed in this HTML version using MathJax in order to improve their display. Uncheck the box to turn MathJax off. This feature requires Javascript. Click on a formula to zoom.
Abstract
Because of their high impact on calculated temperatures, the offset gas gaps between the graphite holder and capsule wall are evaluated for the thermal model of the Advanced Gas Reactor 5/6/7 (AGR-5/6/7) irradiation experiment. Fuel compact temperatures are a crucial factor in assessing the irradiation performance of tristructural isotropic (TRISO)-coated-particle fuel for use in high-temperature gas-cooled reactors. TRISO fuel irradiation performance is a core tenet of the U.S. Department of Energy’s Advanced Gas Reactor Fuel Development and Qualification Program, conducted in the Advanced Test Reactor at Idaho National Laboratory. Specifically, the irradiation experiments were intended to provide irradiation performance data to support fuel process development, qualify fuel for normal operating conditions, support the development of fuel performance models and codes, and provide irradiated fuel and materials for postirradiation examination and safety testing.
The thermal model used to predict the fuel compact temperatures was a three-dimensional finite element model that was subject to uncertainty. The most dominant factor in the uncertainty pertaining to calculated fuel temperatures is the gas gap uncertainty, which is caused by the graphite holder nub-to-capsule wall clearance. In AGR-5/6/7 capsules, the graphite holders can be shifted away from being perfectly centered inside the stainless steel capsule walls. This is due to irradiation-induced graphite shrinkage or to insufficient nubs on the graphite holder leading to azimuthally varying gas gaps during irradiation. A method was developed to find the best offset magnitude and direction at the top and bottom of the graphite holders in Capsules 1 and 2, which experienced higher temperatures than originally predicted among the five AGR-5/6/7 axially dispersed capsules irradiated between 2018 and 2020. The differences between the calculated and the measured temperatures of thermocouples (TCs) placed in the graphite holder near the fuel compacts were used as the basis for the holder offset determination. The best-fit offset assumes that the root-mean-square error between the measured and calculated TC temperatures is a minimum value. Typical offsets in the range of 0.002 to 0.004 in. increase the fuel compact temperatures in the range of 100°C to 200°C when compared to the zero offset for Capsules 1 and 2. Additionally, because of irradiation-induced changes in the capsule geometries, the holder offsets change throughout the irradiation period.
Keywords:
I. INTRODUCTION
Advanced Gas Reactor (AGR) experiments AGR-1, AGR-2, AGR-3/4, and AGR-5/6/7, which were irradiated in the Advanced Test Reactor (ATR), were previously modeled for daily thermal evaluation. AGR-1 and AGR-2 were irradiated in large B positions while AGR-3/4 and AGR-5/6/7 were irradiated in the northeast flux trap. AGR-1 and AGR-2 thermal model specifics, results, and general experiment topics—along with daily average temperatures—are discussed in Refs. [Citation1], [Citation2], and [Citation3]. The AGR-3/4 thermal model and temperature results are discussed in Ref. [Citation4] while a general treatise of gas gap uncertainty affecting the temperature results of all the AGR experiments is discussed in Ref. [Citation5]. A description of the thermal model of AGR-5/6/7, along with the results for the graphite holders being centered, are given in Ref. [Citation6].
These irradiation experiments of tristructural isotropic (TRISO)-particle fuel were conducted to support development of next-generation high-temperature gas reactors in the United States. The AGR Fuel Development and Qualification Program, which is part of the Advanced Reactor Technologies Program, was responsible for these experiments, which demonstrated and qualified new low-enriched uranium TRISO-particle fuel for use in high-temperature gas-cooled reactors. The goals of the irradiation experiments were to provide irradiation performance data to support fuel process development, to qualify fuel for normal operating conditions, to support development and validation of fuel performance models, and to provide irradiated fuel and materials for postirradiation examination (PIE) and safety testing.
Originally, seven separate experiments were envisioned to meet various program objectives. The last three tests were combined into a single irradiation (i.e., AGR-5/6/7), which served as both the formal fuel qualification irradiations (AGR-5/6) and the margin test (AGR-7). The AGR-5/6/7 experiment consisted of five individual capsules, each equipped with its own temperature control system and fission product gas monitoring capability. The different capsules experienced a range of temperatures, fuel burnup, and fast neutron fluence to envelope the range of operational conditions produced in future high-temperature gas-cooled reactors.
Using the ABAQUS[Citation7] finite element software, a three-dimensional (3-D) finite element thermal model was created for the AGR-5/6/7 experiment, which was composed of five separate stainless steel capsules all welded together. These capsules contained a total of 194 fuel compacts (170 in the AGR-5/6 portion and 24 in the AGR-7 portion), which served as the main heat source in the capsules. Heat rate and fast neutron fluence inputs were obtained from a detailed neutronics analysis conducted using the Monte Carlo N-Particle (MCNP) code[Citation8] for fuel compacts and nonfuel components. ATR outer shim control cylinders and neck shim rods, along with ATR driver fuel power and fuel depletion, were incorporated into the neutronics heat rate calculations. The finite element model contains about 1.2 million finite element brick elements, which modeled more than 150 different components that all communicate with each other in terms of heat transfer. Surface-to-surface radiation heat transfer, along with conduction heat transfer through the helium-neon gas mixture (used for temperature control), was used in the thermal calculations. Changes in the gas gaps due to irradiation-induced graphite shrinkage were incorporated into the model. Fifty-four thermocouples (TCs) were used in the experiment, and the calculation results were compared to the actual measurements in order to assess the model performance.
II. AGR-5/6/7 EXPERIMENT
In February 2018, the AGR-5/6/7 test train began to undergo irradiation in the northeast flux trap as shown in .
Fig. 1. Cross section of the AGR-5/6/7 northeast flux trap location in ATR.
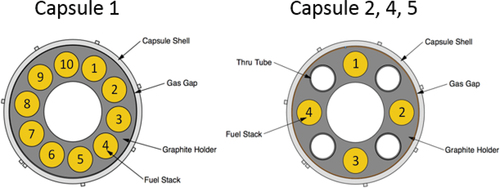
AGR-5/6/7 capsules stacked on top of each other formed a test train that utilized the full 1.22-m active core height, as shown in . Graphite holders made of AG-430 graphite housed the fuel compacts. Capsules 1, 2, 4, and 5 constituted AGR-5/6, whereas the margin test AGR-7 was associated with Capsule 3. Capsule 1 had 10 fuel stacks, and Capsule 2 had 4 fuel stacks as shown in the cross sections in . The packing fraction of the fuel particles was 40% for Capsule 1 and 25% for Capsule 2. Thus, more than 50% of the fuel particles in the AGR-5/6/7 experiment were in Capsule 1.
Fig. 2. Schematic view of the AGR-5/6/7 test train rotated 90 deg from its actual orientation (in which Capsule 1 is at the bottom of the test train).
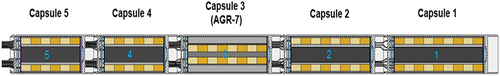
Fig. 3. Cross-sectional view of Capsules 1, 2, 4, and 5.
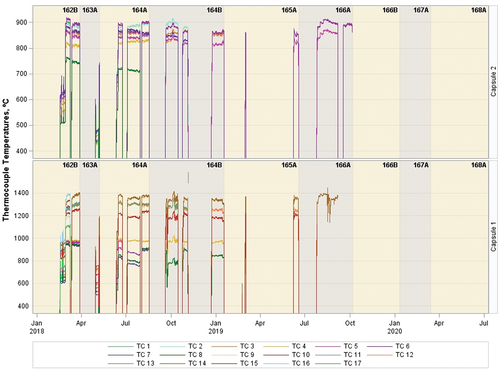
The experiment was instrumented with 54 TCs that terminated in the graphite holders, but 48 of them had failed before the end of irradiation.[Citation9] Standard Type N TCs were deemed adequate for temperatures <1000°C. For temperatures 1000°C to 1250°C, both High Temperature Irradiation Resistant Thermocouples (HTIR-TCs) and Cambridge Type N TCs were used. Only HTIR-TCs have the capability of surviving temperatures above 1300°C, so only this type was designated for temperatures of 1250°C to 1500°C according to Ref. [Citation9]. For Capsules 1 and 2, shows the daily average temperatures of all the functioning TCs as a function of irradiation time, which indicated that the last TC in both capsules failed before the end of Cycle 166A after six out of the nine ATR cycles.
Fig. 4. AGR-5/6/7 daily average measured TC temperatures for Capsules 1 and 2 throughout several ATR cycles.
III. THERMAL MODEL FOR AGR 5/6/7
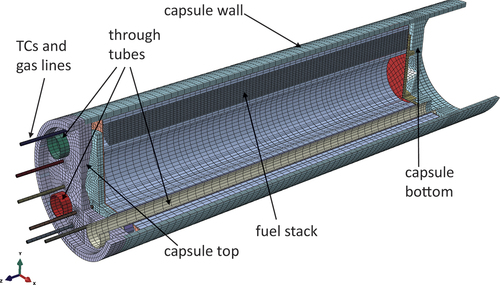
A cutaway view of the finite element mesh of the entire capsule train is shown in . A closer look of the finite element mesh of Capsule 1 is presented in and of Capsule 2 in . In these figures, the TCs and gas lines protrude out of the top. It is important to note that there are no through tubes in Capsule 1, and hence, the graphite holder is less restricted to move on the bottom, while the TC lines help prevent the top of the graphite holder from moving. There are 10 fuel stacks as shown in . These capsules are designed to transfer heat in the radial direction, as zirconia insulators and gaps are placed on the top and bottom of the capsule to insulate it in the axial direction. The top of Capsule 1 is an exception, as a ring spring on the bottom pushes up on the graphite holder and fuel and makes good contact with the top. This was done because there is much heat generation at the top of the fuel and because it can conduct out through the top of the stainless steel cap and into the coolant water. The top and bottom caps of all the capsules are tapered to remove material and hence gamma heating. There are very small gas gaps modeled between the TCs and the graphite holders. In Capsule 2 (), the through tubes (made of stainless steel) and through tube protective sleeves (molybdenum), along with the TCs and gas lines, protrude from the top cap. The gamma heat, produced from the gas lines and TCs, which go through the through tubes, is modeled as a surface heat flux on the inside of the through tubes.
Fig. 5. Cutaway view of the finite element mesh of the entire capsule train.
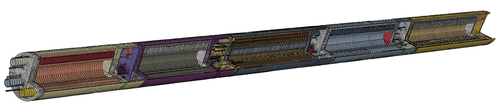
Fig. 6. Cutaway view of the finite element mesh of Capsule 1.
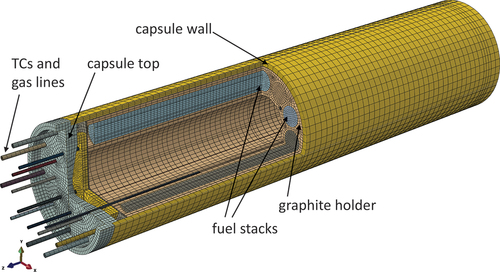
Fig. 7. Cutaway view of the finite element mesh of Capsule 2.
Heat transfer through the gas gaps occurs mainly via conduction (about 80% to 85%) and radiation (about 15% to 20%). The advection is negligible (<0.01%) because of the very low gas flow rate (typically ~50 cm3/min) and density. Graphite shrinkage due to the fast neutron fluence and graphite thermal expansion is incorporated into the gas gap model over the irradiation time. Thus, gas gap change is a function of fast neutron fluence and thermal expansion. Only conductive heat transfer through the helium-neon gas mixture (used for temperature control), along with surface-to-surface radiation heat transfer, was used in the thermal calculations.
Steady-state 3-D heat conduction was implemented in the ABAQUS model. Surface–to–surface gap conduction was used in the gaps between the fuel and the holder and between the holder and the capsule. The surface–to–surface gap radiation model in ABAQUS, requiring view factors and emissivities, was used. View factors of 1.0 were used in these gaps as they are so small and tight. Emissivities of 0.9 were used for the fuel and holder and 0.3 for the stainless steel capsule.[Citation6]
III.A. Thermal Model Inputs
III.A.1. Fuel Compacts
The fuel compact thermal conductivity was taken from correlations presented by Gontard and Nabielek in Ref. [Citation10], considering irradiation temperature, heat treatment temperature, fast neutron fluence, and TRISO-coated-particle packing fraction (with the packing fraction being defined as the total volume of particles divided by the total volume of the compact). See Ref. [Citation4] for a discussion on converting the DIDO nickel equivalent used in Ref. [Citation10] to fast neutron fluence and the adjustments made due to differences in fuel compact density.
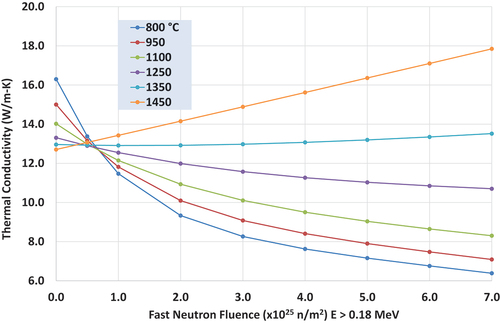
shows a plot of the fuel compact thermal conductivity for Capsules 1 and 5 (varying with fast neutron fluence and temperature), with a 40% packing fraction, using the Chiew and Gland correlation[Citation11] for particles in a matrix described as
Fig. 8. Fuel compact thermal conductivity (in W/m∙K)—varying with fast neutron fluence and temperature—for Capsules 1 and 5.
where
| = |
| |
| ke = | = | effective thermal conductivity |
| km = | = | matrix thermal conductivity (23.6 W/m∙K) |
| kp = | = | particle thermal conductivity (4.13 W/m∙K) |
| = | particle packing fraction. |
Capsules 2 and 4, with a 25% packing fraction, have a slightly higher thermal conductivity due to the correction factor given by EquationEq. (1)(1)
(1) . For fluences greater than 1.0 × 1025 neutrons/m2 (En > 0.18 MeV), the conductivity increases as fluence increases for T ≥ 1350°C because of the annealing of radiation-induced defects in the material at high temperatures. On the other hand, thermal conductivity continually decreases for lower temperatures.
The gaps between the compacts and holder were calculated from as-built dimensions. Every compact was measured and compared to each hole in each graphite holder. The exact as-built dimensions were implemented for every stack top half and bottom half. Heat was transferred via gap conductance and gap radiation. Gap radiation between the compacts and the graphite holder was implemented, with both surfaces having an emissivity of 0.9.
III.A.2. Graphite Holders
The AGR-5/6/7 graphite holders were made of IG-430 nuclear-grade graphite. The material properties for unirradiated graphite IG-430 were determined as follows: Specific heat values as a function of temperature were taken from Ref. [Citation12], density and expansion coefficients were taken from Refs. [Citation13] and [Citation14], and unirradiated thermal diffusivities for IG-430 nuclear-grade graphite at a temperature range of 20°C to 1000°C were taken from Ref. [Citation13] and extrapolated to higher temperatures, as shown in .
Fig. 9. Unirradiated thermal diffusivity of IG-430 nuclear-grade graphite.[Citation13]
![Fig. 9. Unirradiated thermal diffusivity of IG-430 nuclear-grade graphite.[Citation13]](/cms/asset/e0b2ed68-8928-4078-8af1-40834061c537/unse_a_2368994_f0009_oc.jpg)
The specific heat equation (with temperature in kelvins) is expressed as
Graphite density equations accounting for thermal expansion at high temperature are as follows:
where
| T0 = | = | 20°C (room temperature) |
| ρ0 = | = | 1.815 g/cm3 |
| α = | = | 5.5e-6 (1/°C), taken from Ref. [Citation15]. |
Unirradiated thermal conductivity as a function of temperature is calculated from the diffusivity, specific heat, and density. The effect of irradiation on graphite thermal properties was accounted for by incorporating multipliers for thermal conductivity and thermal expansion, expressed as a function of temperature and fast neutron fluence. These multipliers were taken from the Japanese multiplier data[Citation16] and used to adjust the density and thermal conductivity of the graphite holders under actual irradiation conditions.
To convert the Japanese multiplier data from displacements per atom (dpa) to fast neutron fluence, a conversion multiplier of 0.763 × fluence = dpa (fluence units scaled by 1 × 1025) was implemented.[Citation17] This multiplier is specific to the northeast flux trap of ATR. The fluence energy band was E > 0.18 MeV and has units of 1 × 1025 n/m2. To convert from the Japanese fast fluence of E > 0.10 MeV to E > 0.18 MeV, a multiplier of 0.9 was used (0.9 × E > 0.10 MeV = E > 0.18 MeV).[Citation17]
shows a graph of the conductivity multiplier[Citation16] varying with temperature and fast neutron fluence. EquationEquation (4)(4)
(4) shows the curve fit developed from these data:
Fig. 10. Graphite holder conductivity multiplier, kirr/k0, varying with temperature (in degrees Celsius) and fast neutron fluence.[Citation16]
![Fig. 10. Graphite holder conductivity multiplier, kirr/k0, varying with temperature (in degrees Celsius) and fast neutron fluence.[Citation16]](/cms/asset/59a76bc2-9537-4ade-8d35-4e505ae8af33/unse_a_2368994_f0010_oc.jpg)
where
| = | ||
| = | ||
| = | ||
| T = | = | temperature (°C) |
| F = | = | fast neutron fluence (×1025 n/m2, E > 0.18 MeV). |
shows a graph of the coefficient of the thermal expansion multiplier[Citation16] varying with temperature and fast neutron fluence. EquationEquation (5)(5)
(5) shows the curve fit developed from these data:
Fig. 11. Graphite holder coefficient of thermal expansion multiplier, αirr/α0, varying with temperature (in degrees Celsius) and fast neutron fluence.[Citation16]
![Fig. 11. Graphite holder coefficient of thermal expansion multiplier, αirr/α0, varying with temperature (in degrees Celsius) and fast neutron fluence.[Citation16]](/cms/asset/27665036-6c16-4629-abbf-227f39d6c93e/unse_a_2368994_f0011_oc.jpg)
where
| = | ||
| = | ||
| = | ||
| T = | = | temperature (°C) |
| F = | = | fast neutron fluence (×1025 n/m2, E > 0.18 MeV). |
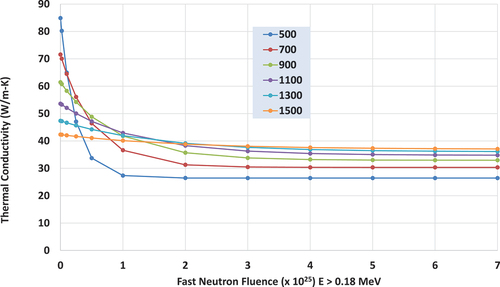
shows the thermal conductivity of IG-430 varying with temperature and fast neutron fluence, incorporating the thermal expansion multiplier and conductivity multiplier. Note the very fast drop-off in conductivity for low temperature and low fast neutron fluence. Almost no change in thermal conductivity is seen for a fluence above 3 × 1025, as the graphite appears to remain stable.
Fig. 12. Graphite holder thermal conductivity (in W/m∙K) of IG-430 varying with temperature (in degrees Celsius) and fast neutron fluence.
III.A.3. Outer Gas Gaps and Gas Mixture
The graphite holders undergo neutron damage as irradiation progresses. The graphite also shrinks until a turnaround point and then starts to swell. For the AGR-5/6/7 experiment, this turnaround point was not reached. During PIE, the outer diameter of the graphite holders was measured at three locations that were each exposed to a different fast neutron fluence.[Citation18] As with the previous AGR experiments, the actual rate of diameter change derived from the available PIE dimension measurements [(PIE-Fabrication)/PIE] improved the agreement between the measured and the calculated TC temperatures.[Citation1,Citation3,Citation4]
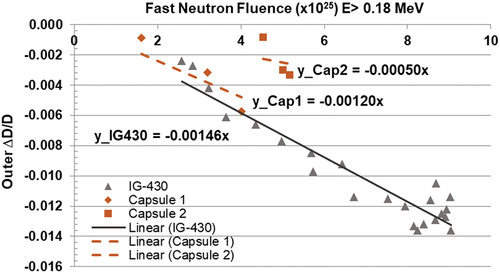
shows the PIE-measured diameter changes[Citation18] of the graphite holders for Capsules 1 and 2 and the IG-430 specimens taken from Ref. [Citation13] as a function of fast neutron fluence. The linear equation of fluence from the trend line with zero intercept (brown dashed lines) was used to calculate the gas gap over the entire irradiation period and includes PIE measurements for each capsule. The rate of change with fast neutron fluence for the Capsule 1 holder (−0.00120 per unit of fluence) was close to that for the IG-430 specimens (−0.00146 per unit of fluence). The rate of change with fast neutron fluence for the Capsule 2 holder was not nearly as much (i.e., −0.00050 per unit of fluence). Note that only the graphite holder outer diameter slopes were used in the Capsule 1 and Capsule 2 thermal gap conductance models.
Fig. 13. Diametric change of the AGR-5/6/7 Capsule 1 and 2 graphite holders, plotted with IG-430 graphite specimens, as a function of fast neutron fluence with PIE measurements.
The capsule neon gas fraction (NeF) for each day was calculated by using daily average flow rates for the helium and neon passing through each capsule. These daily values are stored in the Nuclear Data Management and Analysis System database for the AGR-5/6/7 experiment at Idaho National Laboratory. The helium-neon gas mixture thermal conductivity as a function of NeF and temperature was taken from Ref. [Citation19] and is shown in .
Fig. 14. Helium-neon gas mixture thermal conductivity (in mW/m∙K) varying with neon fraction and temperature (in degrees Celsius).[Citation19]
![Fig. 14. Helium-neon gas mixture thermal conductivity (in mW/m∙K) varying with neon fraction and temperature (in degrees Celsius).[Citation19]](/cms/asset/9a9aaca4-2af3-48cf-9401-79a9c5d66ae1/unse_a_2368994_f0014_oc.jpg)
The gap conductance user subroutine was used to calculate the heat transfer across the gap between the outside of the graphite holders and the stainless steel capsule wall. The surface temperatures of the holder and capsule were available in the subroutine. EquationEquations (6)(6)
(6) and Equation(7)
(7)
(7) show how to calculate the gap conductance across this gap:
where
| T = | = | |
| = | ||
| i = | = | instantaneous |
| 0 = | = | room temperature |
| ss = | = | stainless steel capsule |
| = | slope from | |
| kgas(NeF,T) = | = | gas mixture thermal conductivity varying with neon fraction and temperature |
and (F,T) is derived from . The average temperature between the inner and the outer surfaces of the graphite holder is used. Since the inside surface temperature is not available in the subroutine, a vector of the inside surface temperature (inside the annulus) for each directional quadrant [northeast (NE), northwest (NW), southwest (SW), and southeast (SE)] taken at 25.4-mm elevations (i.e., nine total for Capsule 1 and eight for Capsule 2) was obtained from the volumetric heat subroutine and passed into the gap conductance subroutine. Only the gap between the outside of the graphite holder and the capsule wall is discussed here.
III.A.4. Heat Rates
Heat rates specific to the AGR-5/6/7 experiment were taken from results generated using the MCNP code[Citation8] and are given in Ref. [Citation17]. MCNP version 5 was used for the AGR-5/6/7 depletion calculation along with ENDFVII.1 neutron cross sections and S(a,b) data for all components in the AGR-5/6/7 experiment, including the TRISO-particle compacts and capsule hardware. Heat rate uncertainties were estimated to be less than ±3%, typically in the ±1.5% to 2.0% uncertainty range. The MCNP model was divided into quarter-inch axial segments for the compacts and imported into the ABAQUS input file aligning with each quarter-inch axial segment of a compact (heat generated from fission), and for each inch of height of the graphite holders (gamma heating), for every day during irradiation. Gamma heat rates were also imported for the water, stainless steel capsules, through tubes, TCs, and all the various components on the top and bottom of each capsule.
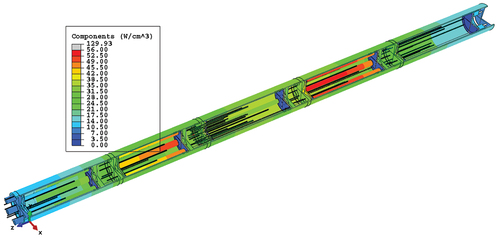
shows volumetric heat generation rates (HGRs) for all the fuel compacts, imported from the neutronics analysis during the first ATR cycle on the 20th day of irradiation: March 7, 2018. The fuel heat rates ranged from the highest rate (166 W/cm3), at the top of Capsule 1, to the lowest rate (61 W/cm3), at the bottom of Capsule 1. The gamma heat rates for the graphite holders exhibit a typical chopped cosine profile, and they are displayed (for the same day) in with the peak being 7.02 W/cm3 and the minimum being 2.29 W/cm3. Component heat rates for all other components in the model are shown in . In this figure, the contour color scale was adjusted to create a more even color spread since the tungsten disks on the top and bottom (used to help even out the temperature distribution) in Capsule 3 generate considerably more heat than the rest of the components.
Fig. 15. Compact heat rates (in W/cm3) for March 7, 2018.
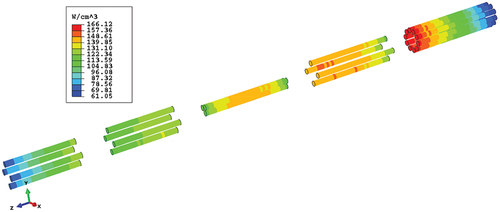
Fig. 16. Graphite holder heat rates (in W/cm3) for March 7, 2018.
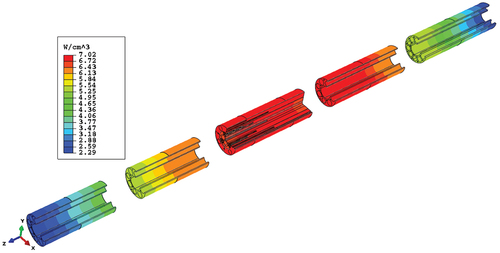
Fig. 17. Component heat rates (in W/cm3) for March 7, 2018.
III.A.5. Fast Neutron Fluence
Fast neutron fluence (E > 0.18 MeV) was imported from the neutronics analysis for each quarter inch of a compact and each inch of height of a graphite holder for each day of irradiation. The thermal conductivities of the compact and graphite holder depend on fast neutron fluence and are incorporated via the coefficient of thermal expansion multiplier and the conductivity multiplier, as functions of temperature and fast neutron fluence.
III.A.6. Thermocouples and TC Protective Sleeve
Each TC and each TC sleeve were individually modeled in the finite element model. Perfect contact was assumed where the TCs were brazed to the top cap. An appropriate gap conductance was applied between each TC and its protective sleeve and between each protective sleeve and the graphite holder. The TC temperature was taken as the average of the finite element temperatures at the tip of each TC. A daily individual HGR for each inch of each TC and TC protective sleeve was implemented from the neutronics analysis.
III.B. Thermal Model Results for the Centered Holder
shows a temperature contour cutaway view of predictions for March 7, 2018, for Capsule 1, with the graphite holder being perfectly centered. Temperatures are higher near the top (left) because of the higher HGR, the closer proximity to the core center, and the additional number of neutrons present.
Fig. 18. Temperature (in degrees Celsius) contour plot cutaway view of Capsule 1, with the graphite holder perfectly centered.
IV. CAPSULE OFFSET EXAMINATION
The original model assumed that the gas gaps between the graphite holder and the capsule wall were azimuthally uniform, but the shorter nubs of the AGR-5/6/7 holders led to a radial clearance of as much as 0.127 mm (0.005 in.) between the outside of the nubs and the capsule wall (nub-to-capsule clearance) in all capsules. The nubs were machined onto the outside of the graphite holders to help keep the holder centered in the capsule. Two rows of four nubs per row spaced at 90 deg were erroneously designed with insufficient height, allowing clearance between the holder and the capsule wall. This clearance left the holder with room to shift inside the capsule wall, resulting in a nonuniform gas gap. This occurrence seemed to be more likely for Capsule 1, as the absence of through tubes in the graphite holder would have allowed shifting. However, the clearances of the through tubes in the remaining four capsules exceeded the nub-to-capsule wall clearance; therefore, it does not completely prevent them from shifting.
The basis of this analysis is that the most likely holder shift should lead to the best match between the measured and the calculated temperatures from all operating TC locations in a capsule (with minimum temperature residuals from all TC locations). The steps in examining the offset are as follows:
Select possible options of the offset as combinations of the distances of both the top and bottom of the holder center from the capsule centerline (e.g., 0.001, 0.002, 0.003 in.) and the top and bottom offset directions [i.e., east (E), NE, north (N), NW, west (W), SW, south (S), SE].
Find the best-fit offset combination, when the root-mean-squared error (RMSE) of the TC residuals (measured minus the calculated TC temperatures) from all the TCs in a capsule is smallest.
Investigate whether this best-fit offset option is constant over time by repeating Step 1 and Step 2 for several time steps over the AGR-5/6/7 irradiation.
Estimate the capsule ultimate peak fuel temperature by assuming the maximum holder offset, when all TCs in a capsule failed during later cycles.
IV.A. Thermal Model with Offset Graphite Holder
IV.A.1. Offset Model Description
Offset is defined as the graphite holder remaining centered while the capsule wall moves a distance in a given direction relative to the top and bottom of the holder. Because of graphite shrinkage over the course of irradiation, the holder clearance increased, making the available offset distances larger for the later dates. The offset calculation in which the gas gap varies both in terms of distance and direction is performed to determine the best-fit offset. The ABAQUS modeling software makes it possible to move the holder and contents inside the capsule, although doing so is not prudent, as it would require creating dozens of models, which would be excessively time-consuming. Therefore, this offset model is included in the ABAQUS gap conductance subroutine. For each offset geometry evaluated in the model, an offset in the ±x and ±y directions is determined for the top and bottom elevations of the holder.
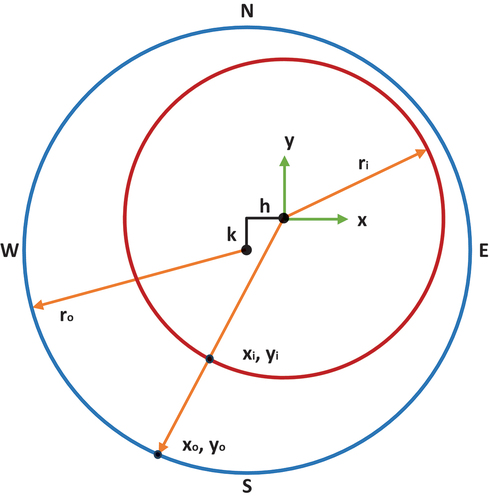
shows a diagram of the outside (capsule) offset h units in the x direction (east-west) and k units in the y direction (north-south) from the graphite holder. For a given xi and yi location of the holder surface (given in the gap conductance subroutine), the xo and yo coordinates of the corresponding capsule wall location are calculated, enabling the actual gap distance of the shifted capsule to be determined via EquationEq. (8)(8)
(8) , assuming that the holder is centered at the x,y origin:
Fig. 19. Gap calculation diagram, with capsule wall (outer circle) offset h units (x direction) and k units (y direction).
Start with
and solve for xo,
where
| = | ||
| = | ||
| = |
Even though the finite element mesh model shows the capsule perfectly centered, this new gap is used for the gap conduction equations to account for the actual holder shift. The ABAQUS gap radiation model remains unchanged with this shift, as the view factor is assumed to remain at 1.0 per the author’s assumption. The gap distances along the length of the holder are linearly interpolated along the axis between the calculated top and the bottom elevation gap distances.
EquationEquation (9)(9)
(9) shows the formula for determining the RMSE of the TC residuals from all operational TCs in each capsule:
This RMSE was calculated for each offset option and was used to assess the goodness of fit between the measured and the predicted TC temperatures for each offset option. The offset is considered most favorable when the RMSE is lowest.
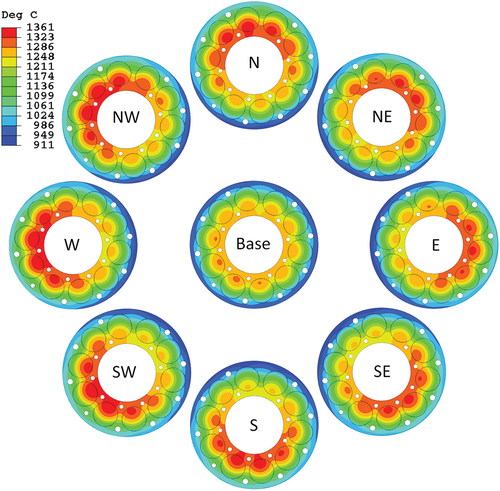
shows temperature contour plots from the original thermal analysis report for March 7, 2018, with a cross-section view of 2.35 in. below the top of the graphite holder in Capsule 1. The base case that has the graphite holder perfectly centered is shown in the center of the figure. The gas gap for this centered case at this elevation is 0.006 in. The temperatures are slightly higher on the southwest side since it is closest to the ATR core center (see ) and experiences a slightly higher level of neutron flux and heat generation. The outer eight were performed with a 0.001-in. vertically uniform offset in the eight directions. Rotating around the figure reveals the highest temperatures to be on the side where the gas gap is largest.
Fig. 20. Temperature (in degrees Celsius) contour plots showing a cut section in Capsule 1 at 2.35 in. from the top of graphite holder varying by an offset of 0.001 in. in eight directions, as taken on the 20th day of irradiation, March 7, 2018.
IV.A.2. Runs for Offset Examination
An offset position is represented by four parameters: the distance and direction of the offset at the top and bottom of the holder. There are 64 combinations of directions when using the selected eight directions of the top and bottom offset (E, NE, N, NW, W, SW, S, and SE) plus a zero shift (center), as shown in . A 4 × 4 matrix of computer runs comprising four top distances and four bottom distances, for a total of 16 distance combination runs, was performed as shown in . Within each computer run of this 4 × 4 matrix, 64 different directional combinations were simulated.
TABLE I Sixty-five Combinations of the Top and Bottom Offset Directions per Computer Run
TABLE II Results for Each of the 16 Offset Distances, the Best-Fit Direction, and the Minimum RMSE for March 3, 2018*
For a selected irradiation date, the thermal model was executed for a total of 1040 (65 × 16) offset positions. For each thermal model run, TC residuals (measured TC temperature minus calculated TC temperature, as shown in ) and summary statistics (average and RMSE, as shown in ) were calculated from all operational TCs. The best-fit offset position corresponds to the smallest TC residual RMSE (representing both model bias and the standard deviation of the TC residuals). For example, shows the best-fit offset option of the Capsule 1 holder calculated for March 3, 2018. The distance t1b1 in the first cell represents that the capsule top shifted by 0.001 in. from the top center and that the capsule bottom shifted 0.001 in. from the bottom center (referred to as “offset” for the rest of this article). For each distance offset, the combination of directions (i.e., tNWbNW means the offset at the top of the holder was in the northwest direction and the offset at the bottom of the holder was in the northwest direction) represents the best-fit direction offset that resulted in the minimum TC RMSE (the last number in each cell in , for example).
Fig. 21. Residuals of the 17 TCs as a function of offset direction () for the best-fit offset of t2b3.5, showing the smallest TC residual variation on March 3, 2018, to be at Step 36.
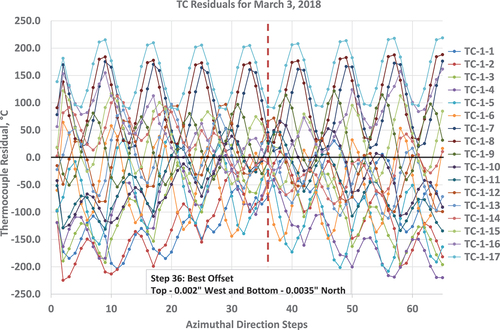
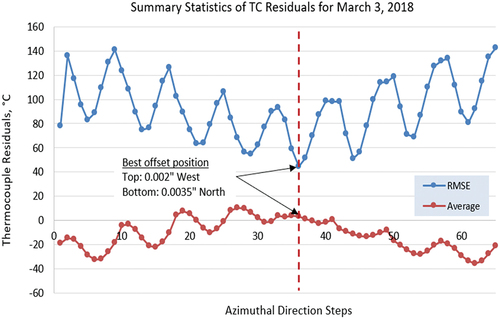
Fig. 22. Average and RMSE residuals from the 17 TCs as a function of offset direction step (), showing the best offset position for March 3, 2018, to be at Step 36.
IV.B. Capsule 1 Holder Offset Analysis
Capsule 1 lays at the bottom of the AGR-5/6/7 test train. in Ref. [Citation20] shows the 17 TCs that were positioned throughout the Capsule 1 graphite holder and terminated at different depths. All were operational during the first ATR cycle, but only seven survived to the end of the third ATR cycle.
Four different days throughout the AGR-5/6/7 irradiation were selected for Capsule 1. The reasonings behind these selections are as follows:
March 3, 2018 (Cycle 1): This was near the beginning of irradiation, and the temperatures had been raised to the target range. All 17 TCs were still fresh (with minimal drift) and operational, allowing for the best offset optimization.
July 15, 2018 (Cycle 3): This date was selected to investigate whether the offset remained stable over time, even though only 8 of the 17 TCs were still operational.
August 12, 2018 (Cycle 3): This date was selected to investigate whether the offset caused a significant increase in the residuals for several TCs. For example, the residual for TC-7 jumped from approximately −10°C to 120°C, and the residual for TC-8 jumped from ~30°C to ~140°C (an increase of over 100°C).
September 20, 2019 (Cycle 6): All TCs in Capsule 1 had failed, so the offset was chosen based on the results from the earlier three dates in order to investigate the peak fuel temperatures close to the start of massive particle failures near the end of this cycle.
For the four selected dates, the HGRs for the fuel compacts in Capsule 1 decrease as the fuel is burned up and depleted (i.e., the peak HGR in the fuel compacts decreases from 166 to 140 W/cm3, according to the neutronics analysis).[Citation17] The peak cumulative fast neutron fluence for Capsule 1 is 2.66 × 1025 neutrons/m2 (En > 0.18 MeV), which impacts the thermal conductivity of the graphite holder and gap width because of the irradiation-induced holder shrinkage. Thus, these thermal condition changes in Capsule 1 might affect the calculated temperatures in addition to the holder offset.
IV.B.1. March 3, 2018
shows the best-fit directions that resulted in the minimum RMSE for each pair of 16 offset distances calculated for March 3, 2018. The top offset of 0.002 in. to the west and the bottom offset of 0.0035 in. to the north (italicized cell) resulted in the minimum residual RMSE from 17 operational TCs [minimum RMSE value of 44.4°C versus 77.9°C for the centered (zero offset) holder]. Other offset options also yielded TC residual RMSEs very close to the best fit. Offsets larger than 0.0035 in. were unrealistic because they resulted in negative gas gaps.
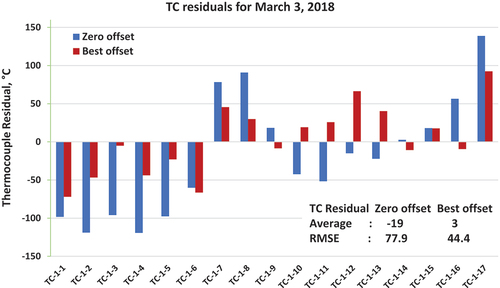
The TC residuals displayed in show the best offset (vertical red dashed line) for Step 36 ( shows Step 36 as top = west and bottom = north), which indicated the narrowest spread of the TC residuals. Similarly, the average and RMSE values are shown in as a function of the 65 azimuthal direction combinations. This figure clearly indicates that the best-fit offset azimuthal direction combination resulted in the minimum RMSE of the TC residuals at Step 36. The TC residual values from are scattered tightly around the zero horizontal line (only ~3°C average, as shown in ), which indicates a well-balanced thermal model with minimal bias. The TC residual plots for the zero and best-fit offsets are displayed as a bar chart in , showing a significant reduction in residuals for most of the 17 operational TCs in Capsule 1. Specifically, the RMSE reduced from 77.9°C [zero offset, Step 1 ()] to 44.4°C for the best-fit option. The absolute value for the average residual also reduced from −19.0°C for zero offset to 3.0°C for the best-fit offset.
Fig. 23. Thermocouple residuals of the zero and best-fit offsets for March 3, 2018.
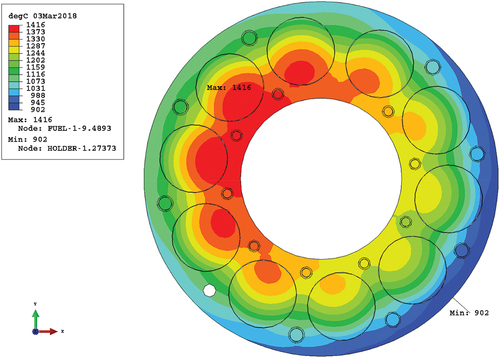
shows a temperature contour plot of a one-finite-element-thick axial slice in which the highest temperature occurs for the best-fit offset. The maximum temperature (i.e., 1416°C) occurs in stack 9, compact level 7 (near the capsule top) in the northwest direction.
Fig. 24. Temperature (in degrees Celsius) contour plot of the one-finite-element-thick slice (level 7), in which the highest temperature occurs for March 3, 2018—the best-fit offset position being 0.002 in. top west and 0.0035 in. bottom north.
IV.B.2. July 15, 2018, and August 12, 2018
As the irradiation progressed, the hot gap distance expanded, leading to more offset distance options relative to the original 4 × 4 matrix of offset distances examined for March 3, 2018. An additional eight runs were computed with finer resolution around the best-fit option in order to refine the best fit for July 15, 2018. TC residual plots similar to the plots for March 3 (i.e., and ) show the best-fit offset options for these two dates, which are also presented in . The residual RMSEs and residual averages for the first three dates show an improvement in terms of the RMSE when compared to the zero offset.
TABLE III Capsule 1 Best-Fit and Zero Offset Distance and Direction, with Minimum RMSE, for March 3, July 15, and August 12, 2018
For July 15, 2018, the top offset of 0.003 in. to the west and the bottom offset of 0.003 in. to the southeast resulted in the minimum residual RMSE from the remaining eight operational TCs in Capsule 1. The average residual for zero offset was lower than the best-fit offset residual (i.e., 8.5°C versus 15.3°C), but the RMSE for zero offset exceeded the best-fit option (i.e., 65.0°C versus 53.8°C). In this case, the improvement of the thermal model in matching the measured TC temperatures is insignificant.
For August 12, 2018, seven TCs were operational in Capsule 1. The best-fit offset for the top was 0.0035 in. to the southwest and for the bottom was 0.0035 in. to the northwest. The best-fit offset led to a much better match between the calculated and the measured TC temperatures, such that the average residual decreased (i.e., 22.6°C versus 55.4°C for zero offset) and so did the RMSE (i.e., 47.9°C versus 73.6°C for zero offset).
IV.B.3. September 20, 2019
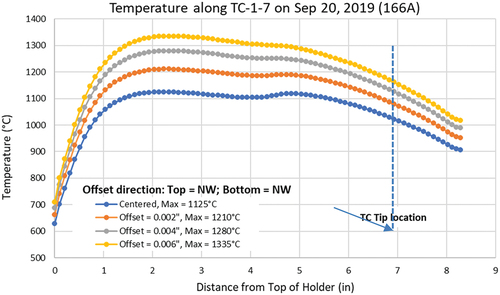
No TCs remained operational in Capsule 1 on September 20, 2019, so the best-fit offset directions from the third date (August 12, 2018) were used (top: southwest or northwest; bottom: northwest) to investigate the impact of offset on capsule temperatures. Besides these best-fit offset directions, several offset distances (0.002, 0.004, and 0.006 in.) were considered in order to find the maximum possible temperature. Distances exceeding 0.006 in. were not considered as they would result in an unrealistic negative gas gap. shows the highest peak fuel temperature reached (1557°C) for Compact 1-7-9 (near the top of the capsule’s northwest location) when the offset was 0.006 in. northwest top and 0.006 in. northwest bottom. Thus, the highest possible fuel temperature was 135°C hotter than with zero offset.
TABLE IV Capsule 1 Fuel Compact Temperatures for the Offset Options for September 20, 2019*
September 20, 2019 was selected because of its proximity to the time when particle failures occurred in Capsule 1 near the end of the fifth cycle. The primary postulated reason for the massive particle failures is that nickel from several Type N TCs that experienced temperatures well beyond their design limits migrated to the fuel compact and interacted with fuel particles, causing particle failures. These TCs consisted of a Ni sheath encased in a Nb sleeve. The presence of a eutectic melting point in the Nb-Ni system suggests that temperatures exceeding 1200°C would cause severe degradation to the TC sheath. Thus, temperatures along the TC-1-7 conductor in Capsule 1 (inserted to a depth of 8.4 in. from the top of the holder), which passed near Compact 1-7-9, were calculated for three possible offset options for September 20, 2019, as shown in .
Fig. 25. Temperature (in degrees Celsius) distribution along TC-1-7 (near the hottest fuel compact) from the holder top to tip for Sep 20, 2019 (166A).
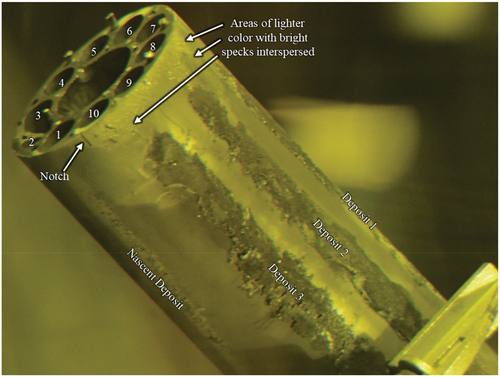
is a photograph of the Capsule 1 holder during PIE, revealing deposit stripes along the northwest outer surface. These stripes are near the peak temperature compacts in the northwest region ().
Fig. 26. Capsule 1 holder, showing the fuel stacks and major deposits.
IV.B.4. Capsule 1 Offset Discussion
A comparison was made of the best-fit options collected from the three dates during the first half of the AGR-5/6/7 irradiation experiment, when several operational TCs could still be used for the RMSE calculation. For all three dates, the best-fit offset distances were similar (i.e., 0.002 to 0.0035 in.), but the azimuthal directions were quite different. The offset helped significantly reduce the RMSE for all three dates.
For Capsule 1, shows the temperature results for these four dates, for the zero and best-fit offsets. For all four dates, the best-fit offset led to a wider (relative to the zero offset results) temperature range for the Capsule 1 fuel compacts (i.e., a higher peak temperature and lower minimum temperature) and a lower capsule-average compact temperature.
TABLE V Capsule 1 Fuel Compact Temperatures for the Zero and Best-Fit Offsets for the Four Selected Dates
IV.C. Capsule 2 Holder Offset Analysis
Capsule 2 was on top of Capsule 1 in the AGR-5/6/7 test train. Capsule 2 contained 24 fuel compacts with a lower target temperature of about 900°C. For Capsule 2, three dates during the AGR-5/6/7 irradiation were selected for analysis, based on the following reasoning:
March 3, 2018: This was near the beginning of irradiation, and the temperatures had been raised to the target range. All eight TCs were still fresh (with minimal drift) and operational, allowing for the best offset optimization (similar to Capsule 1).
October 8, 2018: This date was selected to investigate whether the offset was stable over time. Six of the eight TCs were still operational (shortly after this date, another TC failure brought this number down to five).
April 20, 2020: This date was selected because it was the highest fuel temperature in Capsule 2 during irradiation.[Citation20] The maximum allowable offset was implemented to find the resultant highest possible fuel temperature.
IV.C.1. March 3, 2018
Based on the experience with Capsule 1, only nine pairs’ offset distances (3 × 3 matrix) were considered. shows the best-fit offset and directions for Capsule 2, as calculated for March 3, 2018. The top offset of 0.004 in. to the northeast and the bottom offset of 0.003 in. to the west (italicized cell) resulted in the minimum residual RMSE from eight operational TCs [minimum RMSE value of 26.0°C versus 51.9°C for the centered (zero offset) holder]. Other offset options also yielded TC residual RMSEs very close to the best fit.
TABLE VI Capsule 2 Best-Fit Options for Each of the Nine Offset Distances, Best-Fit Direction, and Minimum RMSE for March 3, 2018*
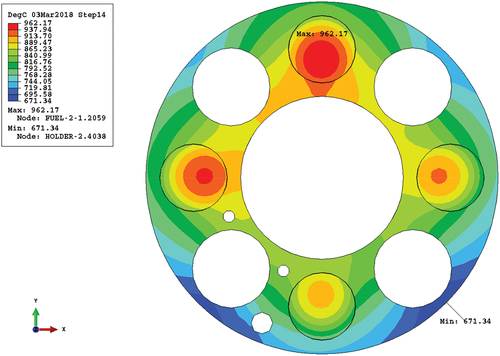
The TC residuals () and the average and RMSE values () as a function of the 65 azimuthal positions clearly indicate that the best-fit offset position (t4b3) resulted in the smallest spread of TC residuals, with a minimum RMSE of 26.0°C at Step 14. This indicates that the thermal model with the best-fit offset yielded a better match with the TC measurements. The TC residual plots for the zero and best-fit offsets () also show a significant reduction in residuals for six of the eight operational TCs in Capsule 2. shows a temperature contour plot for a one-finite-element-thick axial slice in which the highest temperature occurs for the best-fit offset. The maximum temperature of 962°C occurs in Stack 1, Compact Level 4, in the north direction.
Fig. 27. Capsule 2 residuals of eight TCs as a function of offset direction () for the best-fit offset, showing the smallest variation of TC residuals to be at Step 14 for March 3, 2018.
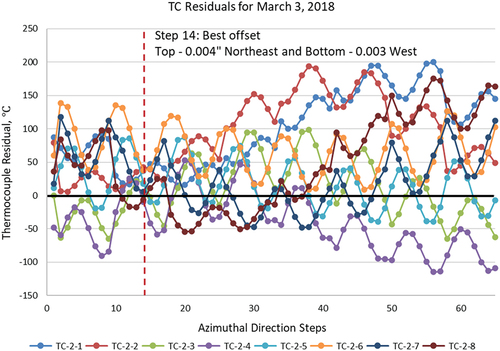
Fig. 28. Capsule 2 average and RMSE residuals from the eight TCs as a function of offset direction step (), showing the best offset position to be at Step 14 for March 3, 2018.
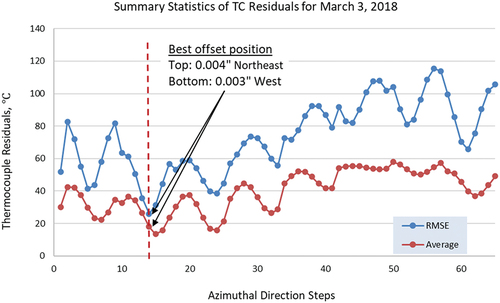
Fig. 29. Capsule 2 TC residuals of the zero and best-fit offsets for March 3, 2018.
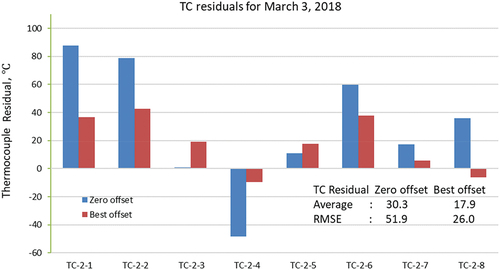
Fig. 30. Capsule 2 temperature (in degrees Celsius) contour plot of one-finite-element-thick slice (level 4) in which the highest temperature occurs for March 3, 2018, the best-fit offset position being 0.004 in. top northeast and 0.003 in. bottom west (Step 14).
IV.C.2. October 8, 2018
shows the Capsule 2 results for the first two dates. The best-fit offset combination for October 8, 2018, was the top offset of 0.004 in. to the east and the bottom offset of 0.003 in. to the northwest. This resulted in the minimum residual RMSE from six operational TCs (minimum RMSE value of 18.5°C versus 41.0°C for the centered holder). Other offset options also yielded TC residual RMSEs very close to the best fit. The best-fit offset resulted in an average residual of 2.6°C, with six of the eight TCs remaining operational. The peak temperature of 971°C occurred in Stack 1, Compact Level 4, in the north direction.
TABLE VII Summary of Capsule 2 Best-Fit Results for the First Two Dates in 2018
IV.C.3. Highest Possible Temperature, April 20, 2020
An analysis was performed to find the highest possible temperature in Capsule 2 during any point during the irradiation referenced in Ref. [Citation20]. The date that was found to correspond to this temperature was April 20, 2020. For the original centered calculation, the peak temperature was in the south stack (Stack 3). Increasing the offset gap to its maximum allowable value in the south would yield the highest possible temperature. After iterating to find the maximum possible offset, and upon considering any negative gas gaps, an offset of 0.0068 in. in the south was seen to yield the highest possible temperature. Higher offset values were tried but would not converge because of a negative gap being predicted during the iterations.
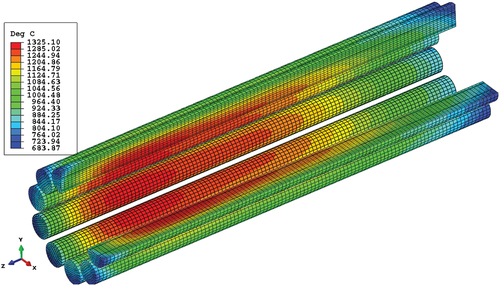
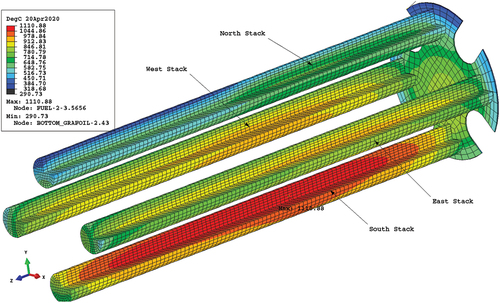
shows a temperature contour plot of the Capsule 2 fuel stacks for April 20, 2020, with a one-quarter slice being taken out to show the inner fuel temperature regions. The bottom Grafoil layer was added on the right (bottom) of the fuel stacks to help with the perspective view. The fuel stack locations are labeled in the figure as Stack 1 north, Stack 2 east, Stack 3 south, and Stack 4 west. The peak temperature of 1111°C occurred in the south stack at level 4.
Fig. 31. Temperature (in degrees Celsius) contours of the fuel in Capsule 2, with a one-quarter slice taken out of each fuel stack, including the bottom Grafoil (to help with perspective), for April 20, 2020, with top and bottom offsets to the south at 0.0068 in.
IV.C.4. Capsule 2 Offset Discussion
For Capsule 2, the best-fit options and results from two dates, i.e., March 3, 2018, and October 8, 2018, are discussed. (These dates reflect times when a number of operational TCs could be used for the RMSE calculation.) For both dates, the best-fit offset distances were similar (i.e., 0.004 in. top and 0.003 in. bottom), but the azimuthal directions were different, as shown in . On the other hand, the top offset direction moved from the northeast to the east, and the bottom offset direction moved from the west to the northwest. This is consistent with the Capsule 1 holder offsets, which did not occur in the same direction during the irradiation time. The offset helped significantly reduce the RMSE for both dates (), in which eight and six TCs remained, and the average values were positive (17.9°C and 2.6°C, respectively).
shows the Capsule 2 fuel compact temperatures (minimum, maximum, and average) for the zero and best-fit offsets for the selected dates. For the zero offset and the best-fit offset, the hottest and coldest compacts remained at the same level, but the stack changed as the holder shifted azimuthally. This occurred because when the holder moves closer to the capsule wall, the fuel temperature decreases, and vice versa. The offset led to a small reduction in the capsule average temperature but a wider temperature range for Capsule 2 compacts (lower minimum temperature and higher maximum temperature). The hottest compact switched to the stack located next to the widest gas gap, and the coldest compact switched to the stack next to the narrowest gas gap. The results for April 20, 2020, seen in , show that the peak temperature went from 994°C when centered to the highest possible offset and temperature (i.e., 1111°C) when making the gap 0.0068 in. toward the south direction for the top and bottom.
TABLE VIII Capsule 2 Fuel Compact Temperatures for the Zero and Best-Fit Offsets for Three Selected Dates
V. CONCLUSIONS
Fuel compact temperatures are a crucial factor in assessing the irradiation performance of TRISO fuel particles in the AGR-5/6/7 irradiation experiment. In the absence of direct measurement, fuel compact temperatures were calculated using a thermal model that was subject to simulation uncertainty. Various offset distances and directions for the top and bottom graphite holders for Capsules 1 and 2 were investigated in order to determine the plausible temperature range of all compacts in each capsule. Best-fit offset options (directions and magnitudes) were found for selected dates during the irradiation by minimizing the RMSE between calculated temperatures and the actual measurements from operational TCs. Typical offsets in the range of 0.002 to 0.004 in. changed the compact temperatures in the range of 100°C to 200°C, as compared to the zero offset for Capsules 1 and 2. Additionally, because of irradiation-induced shrinkage in the graphite holders, the holder offsets changed during irradiation .
For the later date when no TCs remained functional, the maximum possible holder offsets led to a 135°C increase in peak fuel temperature in Capsule 1 (1557°C versus 1422°C for zero offset) and a 117°C increase in peak fuel temperature in Capsule 2 (1111°C versus 994°C for zero offset). In addition, the maximum possible temperature along the TC lines in Capsule 1 exceeded 1200°C, which is a temperature at which a mechanism for nickel degradation in the fuel particles could be triggered, as suggested by the deposits found on the Capsule 1 graphite holder.
Acknowledgments
This work was supported by the U.S. Department of Energy (DOE), Next Generation Nuclear Plant Program, Idaho Operations Office Contract DE-AC07-05ID14517. This research made use of Idaho National Laboratory’s high-performance computing systems, located at the Collaborative Computing Center and supported by the DOE Office of Nuclear Energy and the Nuclear Science User Facilities.
Disclosure Statement
No potential conflict of interest was reported by the author(s).
Additional information
Funding
References
- G. L. HAWKES et al., “Daily Thermal Predictions of the AGR-1 Experiment with Gas Gaps Varying with Time,” Proc. Int. Congress Advances in Nuclear Power Plants (ICAPP 2012), Chicago, Illinois, June 24–28, 2012, American Nuclear Society (2012); https://www.osti.gov/biblio/1054296.
- P. A. DEMKOWICZ et al., “Results of the AGR-2 TRISO Fuel Performance Demonstration Irradiation Experiment in the Advanced Test Reactor,” Ann. Nucl. Energy, 150, 107833 (2021); https://doi.org/10.1016/j.anucene.2020.107833.
- G. L. HAWKES, J. W. STERBENTZ, and B. T. PHAM, “Thermal Predictions of the AGR-2 Experiment with Variable Gas Gaps,” Nucl. Technol., 190, 3, 245 (2015); https://doi.org/10.13182/NT14-73.
- G. L. HAWKES et al., “Thermal Predictions of the AGR-3/4 Experiment with Post Irradiation Examination Measured Time-Varying Gas Gaps,” ASME J. Nuclear Rad. Sci., 3, 4, 041007 (2017); https://doi.org/10.1115/1.4037095.
- B. T. PHAM et al., “Impact of Gap Size Uncertainty on Calculated Temperature Uncertainty for the Advanced Gas Reactor Experiments,” Nucl. Eng. Des., 329, 1, 110 (2018); https://doi.org/10.1016/j.nucengdes.2017.08.009.
- G. L. HAWKES, J. W. STERBENTZ, and M. PLUMMER, “Thermal Model Details and Description of the AGR-5/6/7 Experiment,” Proc. Int. Congress Advances in Nuclear Power Plants (ICAPP 2019), Juan-les-Pins, France, May 12–15, 2019, Paper 000142; https://www.osti.gov/biblio/1599861/.
- “ABAQUS Version 6.14-2,” Dassault Systèmes (2014); https://www.simulia.com.
- “MCNP Code Manual,” Los Alamos National Laboratory; https://mcnp.lanl.gov/references.shtml (current as of Dec. 2017).
- A. J. PALMER et al., “Development and Test Results of Thermocouples Used in the TRISO-Fuel Irradiation Experiment AGR-5/6/7,” Nucl. Technol., 209, 3, 448 (2023); https://doi.org/10.1080/00295450.2022.2065873.
- R. GONTARD and H. NABIELEK, “Performance Evaluation of Modern HTR TRISO Fuels,” KFA-HTA-IB-05/90, Forschungszentrum Jülich (1990); https://inis.iaea.org/search/search.aspx?orig_q=RN:52011643.
- E. GONZO, “Estimating Correlations for the Effective Thermal Conductivity of Granular Materials,” Chem. Eng. J., 90, 3, 299 (2002); https://doi.org/10.1016/S1385-8947(02)00121-3.
- ASTM C781-08(2014), Standard Practice for Testing Graphite and Boronated Graphite Materials for High-Temperature Gas-Cooled Nuclear Reactor Components,” ASTM International, West Conshohocken, Pennsylvania (2014).
- W. WINDES et al., “AGC-2 Graphite Preirradiation Data Analysis Report,” INL/EXT-13-28612, Rev. 1, Idaho National Laboratory (2013); https://doi.org/10.2172/1097190.
- D. SWANK et al., “AGC-2 Graphite Pre-Irradiation Data Package,” INL/EXT-10-19588, Rev. 1, Idaho National Laboratory (2010); https://doi.org/10.2172/1070123.
- W. WINDES, D. ROHRBAUGH, and D. SWANK, “AGC 2 Irradiated Material Properties Analysis,” INL/EXT-17-41165, Rev. 0, Idaho National Laboratory (2017); https://doi.org/10.2172/1369362.
- T. SHIBATA et al., Draft of Standard for Graphite Core Components in High Temperature Gas-Cooled Reactors, JAEA-Research-2009–042, Japan Atomic Energy Agency Research (2010); https://inis.iaea.org/search/search.aspx?orig_q=RN:42011318.
- J. W. STERBENTZ, “JMOCUP Physics Depletion Calculation for the As-Run AGR-5/6/7 TRISO Particle Experiment in ATR Northeast Flux Trap,” ECAR-5321, Idaho National Laboratory (2020); https://www.osti.gov/biblio/1774808.
- J. STEMPIEN and L. CAI, “AGR-5/6/7 Irradiation Disassembly and Metrology First Look,” INL/RPT-23-71033, Rev. 0, Idaho National Laboratory (2023); https://doi.org/10.2172/1960206.
- J. KESTIN et al., “Equilibrium and Transport Properties of the Noble Gases and Their Mixtures at Low Density,” J. Phys. Chem. Ref. Data, 13, 229 (1984); https://doi.org/10.1063/1.555703.
- G. L. HAWKES, B. T. PHAM, and C. M. OTANI, “AGR-5/6/7 Thermal Model with Non-Uniform Gas Gaps,” INL/RPT-23-73074, Rev. 1, Idaho National Laboratory (2023); https://www.osti.gov/biblio/2229723.