
 ?Mathematical formulae have been encoded as MathML and are displayed in this HTML version using MathJax in order to improve their display. Uncheck the box to turn MathJax off. This feature requires Javascript. Click on a formula to zoom.
Abstract
Achieving full decarbonization of all economic sectors remains a challenge, especially in niche markets. For example, remote communities and industrial or mining activities detached from the main electric grid heavily rely on fossil fuels, similar to urban and industrial microgrids with combined heat and power needs. A combination of renewables and energy storage is often not suitable due to cost, reliability, intermittency, and large storage requirements. Small nuclear reactors with a flexible purpose could serve these applications. Microreactors (MR) are a class of reactors that are compact, factory manufactured, transportable, and self-regulating. Typically, they generate much less power than their large reactor counterparts. The main advantages of microreactors include the versatile nature of the energy produced, the reliability of supply, and freedom from having to transport and store large quantities of fuels on-site, coupled with the absence of dependence on an electrical grid. A strong business case is needed to move from the microreactor prototype to the commercialization phase. In fact, fossil fuels are still relatively inexpensive, and in the near term, carbon credits will be available to virtually compensate for emissions. For microreactors, one of the main costs in operation and maintenance (O&M) is their staffing levels. In this study, we investigate how to optimize the number (and thus the cost) of workers, moving from a traditional, fully manned, on-site personnel approach to an unmanned, remote personnel approach. We examine four different staffing models that can be implemented as the technology matures and evolves. We estimate the staffing needs of each model and build a business case to justify the substitution of on-site personnel with adequate technologies. To do so, we propose a cost model to quantify potential cost reductions from automating O&M activities. The model accounts for both the reduction in cost derived from the reduced number of full-time-equivalent (FTE) employees and the increase in cost derived from the need to buy new control hardware as needed. Applying the cost model that we created to different scenarios, an on-site O&M cost reduction exceeding 80% can be expected. Additionally, we found that it is more impactful to focus on automating routine O&M tasks rather than attempting to automate transient management (shutdowns, restarts, monitoring condition deviations). In fact, transients typically account for less than 1% of the total FTE time spent on the reactors.
I. INTRODUCTION
Microreactors are compact nuclear reactors with a small power output. In Ref. [Citation1], they are defined as systems with a thermal power output up to 20 MW, which classifies them as Category B reactors under the U.S. Department of Energy (DOE) definition and, thus, Category 2 hazards for 10 CFR 830Footnotea and Ref. [Citation2]. They are factory manufactured and assembled.[Citation3] Their transportation and installation on-site are expected to be simpler than for larger reactors (e.g., transport by truck or rail). Some microreactor concepts envision initial fueling and subsequent refueling to occur at a central refueling facility, thus avoiding handling and storing fresh or spent fuel on-site.
These reactors are expected to be a reliable, dispatchable, low-carbon energy source and are therefore seen as a possible alternative or replacement for the small- to medium-size fossil fuel turbines and diesel engine power generators in use today. These generators are used both in remote locations—to provide power to assets disconnected from the electric grid—and in urban and industrial applications in cogeneration plants for industrial purposes or for large public facilities, such as hospitals and universities.
To prove their viability, microreactors must demonstrate they can be economically competitive with respect to the fossil fuel alternatives, taking into account the possible introduction of a carbon tax. Renewable energies may not be viable in the aforementioned contexts because of their intermittency and large land requirement. In fact, many applications demand a high stability and reliability base supply of energy since their stand-alone power generators could be the only source of power and some critical operations cannot be disrupted.
This study revolves around applying an established trend in power plants to microreactors: seeking a higher degree of autonomy for operations. Here, we define autonomy as the system’s inherent capability to perform maneuvers within a prescribed envelope of operations, including the ability to handle certain upset conditions that can be brought under control without exceeding the limiting safety system settings. We use the verb “automate” to describe the techniques and solutions used to achieve autonomy.
One example of seeking autonomy in power plants is the large-scale, combined cycle plant that Mitsubishi Power is actively striving to make fully autonomous.[Citation4] Further, Siemens was able to perform a remote startup and power adjustment of a gas turbine.[Citation5] On-site staff is a cost and logistical challenge for oil and gas platforms and for mining sites. In the oil and gas context, Ref. [Citation6] studies ways to achieve lower staffing of offshore platforms, in particular, lowering staffing requirements for the platform power unit, which is based on an aeroderivative gas turbine. One applicable takeaway from this study is that to reduce or eliminate full-time-equivalents (FTEs) on-site, high-frequency tasks (from as high as per-shift tasks to as low as weekly or monthly tasks) must be automated or eliminated. Instrument reading, equipment monitoring, and visual inspections need to be performed via online-monitoring instrumentation to achieve this. Reference [Citation7] addresses this topic and presents a roadmap to convert to online monitoring (OLM) activities in nuclear power plants that are currently managed with manual processes. Mining is also pushing toward unmanned sites.[Citation8]
Inspired by examples from these other industries, the absence of permanent on-site operational staff should be integrated into the design of microreactors from the start. Conventional light water nuclear reactors in the United States run with 500 to 1000 staff per plant. This model cannot be adopted for microreactors. Microreactors are economically feasible only if they can achieve a significant level of autonomy to allow several units to be operated and maintained by one plant crew. Ideally, overall staff requirements should be <1.5 FTE/MW(electric), including staff for maintenance and security.[Citation9] This leaves little room for operators in a competitive microreactor layout.
Reference [Citation10] approached our same topic from a different perspective. We focused only on the economic worst-case scenario, i.e., a single reactor per site, whereas they also analyzed the case in which multiple microreactors are located at the same site, which is generally more economically convenient. Moreover, we used a bottom-up approach for the single reactor to calculate staffing needs while they scaled staffing needs. In addition, our paper explores a step-by-step staffing reduction approach, from the first units to a fully developed fleet of microreactors after safety and feasibility demonstration to the nuclear regulator. The authors of Ref. [Citation10] performed a Monte Carlo analysis to study the variations whereas we performed a sensitivity analysis on single parameters to show the behavior of the model to changes.
This study attempts to optimize the cost of operation and maintenance (O&M) for microreactors, focusing primarily on plant operators and maintenance workers. We also briefly discuss the challenges involving security staffing. A comprehensive, optimal O&M model is proposed, along with two other transition models between the first expected units to the final goal. We also identify the technologies that are essential to achieving the optimal staffing model. Then, we estimate the staffing needs for each scenario to perform monitoring maintenance tasks (not repair maintenance tasks) and operation tasks. By the term “monitoring maintenance,” we mean all the tasks that are performed to monitor the health of components. In particular, during their daily and weekly routines, workers generally check sensors whose values can predict abnormal operating conditions. With repair or service maintenance, we intend for all the interventions on components to correct or prevent faulty conditions. Operation tasks are the tasks strictly related to power maneuvering.
A key question explored in this study is, what is the economic value of automating certain tasks? Automating usually implies (1) installing more instrumentation and control (I&C) hardware and software on the microreactor and (2) reducing personnel on-site or off-site. To answer this question, a clear understanding of the process (i.e., the task or role) and the costs related both to I&C and staffing are needed. A model intended for designers of microreactors is presented in this paper so that they may make informed decisions on whether automation would result in reduced O&M costs per megawatt hour. This model is mainly focused on direct costs and does not consider other impacts such as increased (or decreased) availability, risk, or organizational complexity.
We apply this model to scenarios that analyze microreactor economics and estimate the possible savings associated with relocating staff off-site. In our analyses, we evaluate how the additional technologies impact the number of monitoring maintenance workers and operators. We do not include repair maintenance and other categories of workers (e.g., off-site engineering, administrative, management, procurement, and training). In fact, repair maintenance needs an extended focus that cannot be part of this work. It will need to be examined in future work.
Last, we perform some sensitivity analyses by varying several parameters: the number of sensors, frequency of transients without shutdown, cost of I&C, annual cost of an FTE, refueling interval, load-following frequency, and time between sensor checks.
II. DESCRIPTION OF THE WORK
In this study, we assume a fleet-type centralized service business unit that shares the staff among multiple reactors and locations. In our model, staff are present on-site for the first microreactor units deployed and consist of operators, security staff, and on-site maintenance workers. These three categories are the ones that we focus on in this study. There is additional staff working off-site, but they are excluded from our analysis and optimization strategy. As mentioned earlier, staff that belong to the engineering, administrative, management, procurement, and training categories are out of scope since they do not need to be on-site in any considered scenario. The employees in those categories will be only indirectly influenced by the optimization, with some exceptions. For example, more I&C means more engineering support is required. However, if the fleet of microreactors reaches a substantial size, say, on the order of 100 units, variations in these staff should have a small impact on the cost of energy generated by the fleet.
II.A. O&M Models for Microreactors
The optimal staffing model (Model 4 in ) that we propose entails a new organization of microreactor O&M with respect to existing large-size nuclear power plants. Most staff of current large-size nuclear power plants work full time for the same plant, and almost all the staff that are necessary during normal operation (with exception of outages) are based on site.
TABLE I Staffing Models for Microreactors
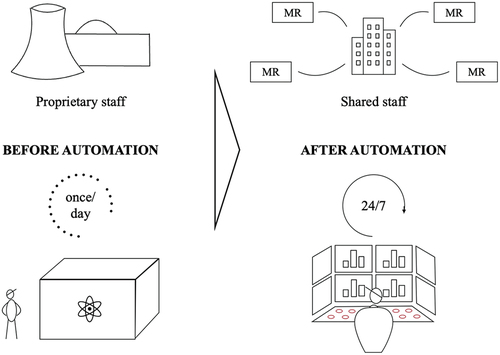
In our scenario, a microreactor is no longer a stand-alone plant; rather, it becomes an asset supported by a service company that employs the staff whose work is shared among multiple microreactor units and sites. This is a fleet-type O&M model, as shown in . No personnel will be permanently on-site. Instead, workers will monitor a fleet of microreactors simultaneously, 24 hours a day, 7 days a week (24/7) from a remote location. In our study, we calculate the average number of reactors that should be monitored remotely on the basis of the time required by each microreactor. We did not investigate if it is feasible for a person to effectively monitor the resulting number of reactors. Thus, the number of microreactors that can be effectively monitored in parallel by a single person has to be confirmed by human performance analyses, which is not part of this study.
Fig. 1. Fleet-type O&M model for microreactors with remote monitoring and no personnel on-site.
The remote monitor, who is not an operator in a traditional sense, has a supervisory role and can intervene when needed. For example, the remote monitor can trigger a controlled shutdown via the reactor control system (RCS) rather than the reactor protection system (RPS), which is safety grade and thus cyber isolated on-site. The remote monitor cannot and does not have to perform any reactivity manipulation during the normal operation of the microreactor. In fact, the remote monitor has no access to remote operation of any system on-site. The only signal they can send to the plant is the shutdown signal, in case of deviation from normal operational parameters. They could in principle intervene on the power-following signal, but this is not something that is generally expected or envisaged. In fact, their main function is monitoring transients. As the remote monitor assignments are very limited with respect to an existing nuclear power plant, it may be possible for remote monitors not to be licensed nuclear operators, once the technology is well demonstrated. This approach alone should significantly reduce operations personnel and training costs.
Each microreactor operates autonomously, with load-following capabilities determined by the energy demand at any given time. In this approach, all operational decisions and actuations remain within the nonsafety domain. Thus, the independence of the safety-grade protection system is preserved. In the event of upset conditions that push the system beyond the prescribed setpoints, the fully automated and isolated protection system initiates reactor shutdown and possibly other emergency safety features to guarantee shutdown with reliable heat rejection to the ambient and radioactivity retention. There is therefore no need for human intervention either on-site or remotely to achieve a safe shutdown state. For safety and security reasons, once shut down, the reactor cannot be restarted remotely (i.e., a human operator must visit the site, manually reset the trip condition, and again manually initiate the restart procedures). In general, personnel will be on-site only to perform maintenance activities, planned in advance with the aid of predictive maintenance.
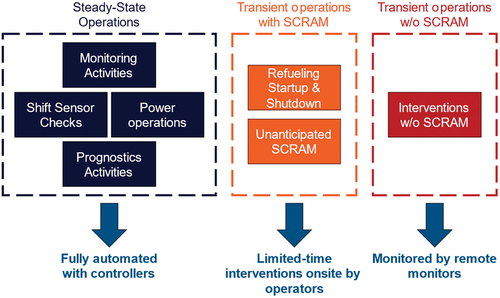
With the hypothesis made in this study, steady-state operations occupy, on average, more than 99% of the total operational time per year in our reference model. For this reason, we chose to study the automation of the steady-state operations, as they are the ones that, if automated, will result in the strongest reduction of FTEs needed. As already mentioned, for security reasons we choose to require a human operator action on-site to restart the reactor after a planned or unplanned shutdown. Every transient that may occur with parameters that could deviate from the expected range, but not enough to cause an automatic shutdown, will be monitored from the remote-monitoring facility. As will be evident in Sec. III, transient operations management involves a very low FTE cost per year—0.02 million of United States dollars per year (MUSD/yr)—which reduces the incentive to automate these operations further. illustrates the subdivision between steady-state operation and transients and how they are managed.
Fig. 2. Steady-state and transient operations tasks subdivision and management.
Additional instrumentation may be useful to significantly increase OLM capabilities of key structures, systems, and components of interest; improve early detection of failure precursors and potentially estimate the remaining useful life; and help with the planning for predictive maintenance. Grouping staff in a centralized hub will optimize the organization of work and will reduce the inefficiencies and extra costs of having workers distributed at several locations. With this approach, worker downtime is reduced, as they continuously perform O&M for a fleet of microreactors according to a carefully planned schedule.
We also present three models of O&M that may be implemented in sequence from the very first microreactor units deployed to the ultimate goal of a large fleet of microreactors. For the first units (Model 1 in ), we envision a very conservative staffing scenario. In fact, we assume that they will be staffed according to the same philosophy of a current nuclear power plant. That is, we assume the presence on-site of armed guards and operators 24/7, plus maintenance workers on-site on one shift, and off-site on call. For the second model (Model 2 in ), we hypothesize that a consequence-based analysis of security threats could justify the elimination of armed guards on-site and rely on external security force intervention instead. This model differs from the first one only for the absence of armed guards on-site. This scenario has been selected as the reference model for our cost calculations. We selected it as it represents the baseline staffing cost for any scenario with no operation and monitor maintenance off-site staff. The number of FTEs chosen to ensure site security, depending on each specific case, can then be added on the top of this baseline. The third model (Model 3 in ) is still based on the presence on-site of operators, whereas the presence on-site of maintenance staff is eliminated by the introduction of I&C for predictive maintenance. In this way, the repair maintenance operations can be planned in advance, and both monitoring and repair maintenance staff does not have to be on-site full time. Operators will also be impacted, as some of the predictive maintenance tasks they usually perform during each shift are now automated.
The transition from the highest to the lowest staffing models will likely occur in steps, driven by the demonstration of safe operation for an extended period of time at each step. The nuclear regulators will need reliable operating data to gain confidence that moving from the current regulations for nuclear power plant licensing to such a new and different model of operation is acceptable. The absence of armed guards on-site is already a reality in a number of experimental nuclear facilities, including the Massachusetts Institute of Technology Research Reactor (MITR). In these cases, as deemed sufficient by the U.S. Nuclear Regulatory Commission, security is assured by external forces, i.e., Massachusetts Institute of Technology (MIT) police and Cambridge police in the case of the MITR, who are able to intervene in case of intrusion or attack before unacceptable damage can be done to the reactor or, in case of damage, an unacceptable radiological release. The security analysis is out of the scope of this study but is being performed concurrently by other research teams.[Citation11] Here, we simply assume that such consequence-based analysis has demonstrated that a constant armed force presence on-site is not necessary.
Moving the maintenance staff off-site should not pose a regulatory challenge, as it has a negligible impact on safety. Of course, it can have operational implications if predictive maintenance and maintenance planning are not properly managed, leading to unplanned shutdowns of the reactor. This would be an economic performance and reliability concern, not a safety concern. It is expected to become more manageable as reactor life is accrued and as more experience is gained from operating the microreactors.
The transition from on-site nuclear operators to off-site monitors could necessitate greater regulatory scrutiny because it could have safety implications. It will have to be demonstrated that on-site operators are not needed during either normal operations or abnormal occurrences. This can be done by the vendors and regulator through a carefully supervised series of tests on the first unit(s) deployed to show that the autonomous control system can reliably manage normal operations. The tests would need to demonstrate that protection and safety systems can be adequately engaged to shut down the reactor and ensure core cooling after postulated abnormal occurrences. In addition, to further reduce costs, reactor vendors could also make a convincing case that given its very limited responsibilities, the remote monitor might not need to be a licensed nuclear operator. In fact, the only capability a remote monitor has in our model is to send on-site a signal that shuts down the reactor. Remote monitors do not perform power maneuvering and do not influence any accident scenario. They just review the data sent from the site to the centralized monitoring room and intervene only in a case where they notice values outside the acceptable range that the systems on-site failed to consider abnormal. The only workers who need to be licensed nuclear operators are those called on-site to restart the reactor after a shutdown.
II.B. Potential Cost-Reducing Technologies
Technologies for autonomous operation, remote monitoring, and predictive maintenance enable the optimized O&M models described in the previous paragraphs. We can distinguish two types of I&C systems: the RPS and the RCS. The RPS is a safety-grade system that ensures the safe shutdown of the reactor and the actuation of safety systems to remove the residual heat from the core under all abnormal conditions. Any I&C system that is part of the RPS must be safety grade with a high degree of reliability. In our study, none of the cost-reducing technologies were intended to interact or be part of the RPS. In fact, we propose that (1) I&C enhancements to enable autonomous operations be part of the RCS; (2) I&C used for the remote shutdown function actuation be part of a new system, completely separate from the RPS, and separated but interacting with some components of the RCS; and (3) I&C for predictive maintenance read measurements from the sensors included in the RCS and elaborate these data to create plant health indicators and the desired maintenance planning, as shown in . Hence, the RPS is not influenced by our analysis and will be designed and licensed in a traditional fashion. For cybersecurity reasons, the RPS must be disconnected from all the remote network routes and, thus, have no connections with the RCS.
Fig. 3. I&C systems and interconnections among them.
II.B.1. I&C System
The I&C system concept presented here follows a mature approach and establishes design practices to minimize risk. Despite vast differences in core fuel design, coolant types, and connected systems, most I&C designs possess similar features with minor differences due to the individual attributes of each concept. Principally, we adopt the separation of protection and control functions consistent with 10 CFR 50, Appendix A.Footnoteb To the extent possible, we identify components (i.e., sensors, transmitters, front-end electronics for signal conditioning and processing, and I&C platforms) that are commercially available for deployment and, particularly, all those components with nuclear pedigree. For certain reactors, we note technology gaps given the challenging environmental conditions, such as high operating temperatures, that may increase cost and delay procurement of these devices.
The envisioned I&C architecture includes two top-level systems: (1) the RPS and (2) the RCS. Additionally, the architecture employs two user interfaces: (1) main control room consoles to interact with the RPS and RCS and (2) remote control consoles.
Briefly, the RPS automatically initiates trip for limiting fault conditions and provides additional posttrip functions for uninterrupted heat rejection. It is designated as a safety system and can be implemented as an analog or digital platform. Typically, the RPS includes the trip system, commonly referred to as the reactor trip system, and the engineered safeguards features actuation system.
The RPS design entails instrumentation that includes neutron flux monitors (wide range and power range), core inlet/outlet thermocouples, differential pressure transmitters (primary side), flow transmitters (secondary), and seismic accelerators, to mention a few.
As a use case for this study, a similar number to the number of sensors in the MITR is used as a proxy for a commercial microreactor.[Citation12] Its thermal power output of 6 MW(thermal) is taken to be representative of concepts under consideration by industry. While the MITR does not include a balance of plant for power generation, many of its sensors are for experiment irradiation testing. As a result, it is assumed that the overall number of sensors is representative of potential commercial designs. Specifically, this microreactor-scale facility has approximately 250 total sensors, of which approximately 75 are connected to power maneuvering actions, plus approximately 55 actuators. In Sec. III, we perform a sensitivity analysis on the cost reduction by variating the number of sensors. In this case, we maintain the ratio of power maneuvering sensors to total sensors and actuators to total sensors similarly as in the MITR use case.
II.B.2. Autonomous Operation
The I&C used for autonomous operation will be an integral part of the RCS, representing an upgrade of the baseline system, which typically needs operator action for power maneuvering and adjustments. The new system will be similar to aeroderivative gas turbine operations, which can be manually operated but can also operate in autonomous mode. The use of artificial intelligence and machine learning techniques may enable adjustment of the operating parameters to ensure real-time optimal performance.[Citation13] This also eliminates the need for manual tuning and human intervention. For example, General Electric makes autonomous operation solutions available for plants up to 53 MW of power output.[Citation13] Further, Mitsubishi Power is on the path to operate the first autonomous large-scale combined-cycle plant[Citation4]: T-Point 2 delivers 566 MW of power, and step-by-step automation systems are being added, with the final goal of achieving a fully autonomous plant. These solutions need to be translated to the nuclear context.
The regulatory and implementational challenges connected to transferring autonomous operation from other industries to the nuclear industry are detailed in Ref. [Citation14]. Cyberattack concerns are relevant, as the autonomous operation infrastructure has to receive data from the remote-monitoring room. The reception and implementation by the microreactor of a fraudulent power-following signal could cause two main problems. On one hand, it could cause nuclear safety concerns, for example, if characterized by frequent oscillations that may cause component fatigue cycles, which could be detrimental to the lifetime of a microreactor’s components. On the other hand, a signal that causes a mismatch between demand and generation may result in economic loss or, even worse, serious disruption of customer activity, especially if the microreactor is serving critical infrastructures or providing energy to communities that depend on its power to cover basic needs (e.g., hospitals).
II.B.3. Remote Monitoring
The proposed vision for remote monitoring is to have on-site infrastructure that processes all the parameters received by the sensors and systems and then stores the parameters on-site, sending to the off-site monitoring room useful information that can be processed for better understanding of the plant operating conditions and health. The transmission of information happens through monodirectional data transmission systems with optical separation or similar solutions to minimize the threat of cyberattacks. An illicit shutdown signal from the remote monitor room is the main cyberattack concern for this infrastructure. We foresee it being the only other system able to receive a signal from off-site, in addition to the power-following signal received by the autonomous operation infrastructure. The cybersecurity objectives can be realized by, for example, the integrity of the uplink between the remote-monitoring room and the site that—along with certain message-encoding features for authenticity—could be conceived as a basis for continuity of operations. That is, if the microreactor site were to lose connectivity with the remote-monitoring center beyond a prescribed period of time, this might justify initiation of reactor shutdown procedures.
The most important point here is that the I&C system architecture and the entire communication infrastructure must be designed for potential cybersecurity infractions. The remote shutdown signal should thus be connected to an independent system that can trigger the shutdown by actuating the same reactivity control system that the RCS has control of, but in an independent way, and not the same reactivity control system the RPS is in charge of. Moreover, the signal that can be sent from the remote-monitoring room should be limited to a full insertion of the shutdown system. Reference [Citation15] presents a framework to determine cybersecurity risks and best practices to be implemented in microreactor designs.
II.B.4. Predictive Maintenance
An appropriate plant health diagnostic system should be deployed to allow predicting and planning necessary maintenance and, in case of failures, alert the maintenance staff of the necessity of an intervention. Sensors and the associated data acquisition systems are inevitably a costly investment, so it makes sense to prioritize the inventory of components for monitoring based on their safety and/or operational significance. Moreover, for a given component, the modalities of monitoring will be determined by its failure modes. Evidently, the breadth and depth of this investment are a trade-off between up-front capital investment versus lifetime gain in availability and reduction of staff cost.
As an example, the decision strategy proposed in Ref. [Citation16] is to (1) identify the components that have more influence on the analyzed system’s total probability of failure; (2) depending on the results from the failure mode and effects analysis, decide which parameters to monitor; and (3) identify the type and number of sensors needed. This strategy provides a reasonable model to optimize the I&C costs. In fact, once the components and failure modes are listed in order of importance, a business case can identify which are worthy of continuous monitoring and which are not. This optimization is particularly important for small reactors, for which the cost of I&C can quickly become a considerable share of the capital cost, as shown in Refs. [Citation17] and [Citation18]. Unfortunately, within the current regulatory framework, and based on precedent, I&C system costs are basically fixed and are almost equal for both small and large reactors since they do not scale significantly with power output.
The thesis advanced here is that substituting personnel with technology for monitoring the plant health realizes a more reliable and potentially less costly system. Workers can perform visual inspections and check basic parameters only periodically, once or several times per day. On the other hand, I&C can monitor the plant health 24/7, providing a more complete picture of the plant conditions. Moreover, the data and information collected by workers during daily inspections are generally not recorded if there is no deviation from the normal operating conditions. Instead, information collected continuously by dedicated sensors is recorded and can be used to infer the long-term health of the plant, analyzing the trends and small deviations that can pass unnoticed in worker’s inspections.
This data collection and signal processing, or data analysis in more general terms, may be assisted or complemented by artificial intelligence and machine learning methods. The use of advanced analytics has been demonstrated to reduce maintenance costs, on average, by 25% and increase productivity by 25%.[Citation19] For maintenance information to be available on-site to workers even in a case of disconnection from the remote-monitoring room, data elaboration and storage should occur on-site. Then, predictive maintenance information is transmitted off-site to the remote-monitoring room.
II.C. Estimation of Staffing Needs
With the four O&M models identified, we investigate each one’s staffing needs as described in the following paragraphs. When needed, we use the fact that one person working 24/7 is generally equivalent in the U.S. nuclear industry to 5 FTEs.[Citation20] This derives from the practice of organizing 24/7 work into five shifts, to cover shifts, associated training, and personal leave.
On the operations side, we made three different hypotheses. For the first and second O&M models (Models 1 and 2 in ), we estimated the number of operators needed on-site to cover the different activities expected in the day-by-day operation of the microreactor on a per-shift basis. These activities are the ones strictly related to the reactor’s operation: load-following power operations and the monitoring maintenance activities performed on a shift basis, which include shift checks of sensors and shift sensors’ monitoring activities.
We also estimated whether operators had the availability to perform some of the other monitoring maintenance activities, which are due on a weekly basis. To do so, we calculated how many hours per shift the operators have left after performing their main activities and whether these hours are sufficient to perform other activities. In the third model (Model 3 in ), operators are asked to perform only the load-following power operations, as the other two tasks are now transferred to the predictive maintenance I&C.
For the optimized microreactor fleet remote-monitoring staffing scenario (Model 4 in ), we made the hypothesis that the I&C for autonomous operation and predictive maintenance can manage the day-by-day regular power activities and regular monitoring. In this scenario, we calculated the equivalent average number of remote monitor FTEs needed off-site per reactor by estimating the number of unanticipated transients without shutdown for the reactors that are monitored from the remote-monitoring room. As previously explained, the workers at the off-site monitoring room do not have any other control over the reactor apart from making the decision to send a shutdown signal to the reactor. Thus, these transients are situations in which data coming from the reactor deviates somehow from the normal operation envelope but not enough to result in a shutdown decision. The monitoring room is called upon to monitor the reactor status for a certain amount of time and if the monitors adjudicate if the reactor must be shut down.
Equivalently, to identify the monitoring maintenance staff needs, we started by identifying the monitoring maintenance activities needed by the systems on a nonshift basis. These are prognostic sensor checks programmed, for example, on a weekly basis. For the first two models, these tasks are assigned to the operators on-site if they have enough time during shifts to perform them, or to additional FTEs that work on one daily shift (8 h/day, 5 days a week), whichever is more cost-effective.
In addition, the model ensures that people regularly on-site can manage additional activities needed during unanticipated transients, both with and without a reactor shutdown, and when the reactor is disconnected from the local grid to be shipped to the centralized refueling and maintenance facility. If they cannot, additional staff may need to be sent on-site, so their cost is added to the total FTE cost.
For the third and fourth scenarios, the equivalent number of FTEs that travel to the sites to manage unanticipated transients with a reactor shutdown and shipping preparation is calculated while accounting for the traveling time to the site. As these workers’ duties include also restarting the reactor after a shutdown, they must be licensed nuclear operators.
The frequency of checks per shift or per week is based on standard industrial practices. Surveillances, which are activities required to demonstrate regulatory compliance, are performed at various frequencies. In addition to measurement, they involve testing equipment (e.g., starting a pump to confirm it will run when needed). Inspections are also performed on systems that do not perform safety functions to enable predictive maintenance. Whether for inspections or surveillances, the frequencies of those activities are equipment and age specific or condition specific.
On the security side, we assume the presence of security staff on-site only for the very first scenario and thus only for the first microreactor units deployed. In particular, we assume two armed guards 24/7 on-site only for the first O&M model. For all the other models, we hypothesize that a consequence-based analysis could justify the elimination of armed guards on-site altogether.
II.D. Cost Model
An important part of this work is demonstrating that an optimized O&M staffing approach is economically competitive with respect to the baseline heavily staffed approach. To do so, we compare the approaches on the basis of two costs: staffing and I&C. A model was generated based on the total number of sensors for a given system. While the values for the MITR are used as an example, in theory, this model can be applied to any microreactor design.
On the staffing side, as a reference annual base wage for the personnel, we assume 110 000 in U.S. dollars (USD), in line with the estimates from the U.S. Bureau of Labor Statistics[Citation21] for nuclear operators. We chose to use the same wage for all the workers. We added the costs the company incurs for staffing, following the example of a cost estimate report published by Dominion Energy.[Citation20] These additional costs are (1) staff overtime, 7.5% of the base salary; (2) staff retirement and benefits, 38.5% of the base salary; (3) staff bonus and incentives, 8% of the base salary; and (4) staff payroll tax, 7.7% of the base salary, plus the staff overtime. In total, the cost per FTE to the company is 178 500 USD/yr. On the I&C side, from a cost subdivision perspective, I&C could be categorized under either the capital cost or the running cost of the microreactor. The cost is based on the number of sensors, I&C hardware, and software. Note that the I&C may have a short lifetime compared to the other microreactor equipment and thus require frequent maintenance, testing, and replacement.
To compare the staffing cost, expressed in USD per year, and the additional I&C cost, expressed in USD, we levelized the I&C cost to an equivalent annual cost in USD per year assuming a lifetime of 10 years as a reference and using a weighted average cost of capital of 8%. The equivalent annual cost can be found by multiplying the initial capital cost of I&C by the annuity factor:
with
where
| EAC = | = | equivalent annual cost |
| IC = | = | initial capital cost |
| = | annuity factor | |
| = | weighted average cost of capital | |
| = | number of years. |
The model can then be used to conduct a comparative analysis and determine if the substitution of labor with an increased I&C capability is economically beneficial. For this, we compute the difference in yearly costs between the reference on-site staffing scenario and the fully remote one with the following formula:
with
where
| = | utilization (% of time) for fully manual operation | |
| = | utilization (% of time) during transients for autonomous operations | |
| = | frequency of sensor | |
| = | duration of sensor | |
| = | processing time of sensor | |
| = | number of sensors | |
| = | controller cost per sensor (USD) | |
| = | annual wireless transmission costs (USD/yr) | |
| = | annuity factor (1/yr) | |
| = | cost per FTE (USD/yr). |
II.E. Assumptions Used
lists the various assumptions used in the model along with their corresponding source or basis. The study here should be interpreted as a reasonable estimate rather than a detailed cost estimation. The assumptions identified as “expert-based” are based on the authors’ judgment.
TABLE II Assumptions Used in the Cost Model
III RESULTS
The results are presented in two sections: (1) estimation of security, operation, and maintenance staffing needs, and (2) application of the cost model to estimate the savings deriving from the automation of different tasks.
III.A. Estimation of Staffing Needs: Security Staff, Operators/Monitors, and Maintenance Workers
As previously described, for each on-site scenario (Models 1 and 2 in ), the model estimates the number of operators needed, and then, it calculates if and how many monitoring maintenance workers on one shift are needed on-site to complement the work of the operators. In particular, we divide routine tasks between operation activities (load-following) and monitoring maintenance activities (sensor shift checks, monitoring shift checks, and prognostic sensor checks). Moreover, we distinguish between shift activities, which need to be performed during each shift and thus by people working on three shifts/day (load-following, sensor shift checks, and monitoring shift checks), and weekly activities (prognostic sensor checks), which may be also carried out by people working on one daily shift, meaning 8 h/day and 5 days/week. With this information, the model estimates the minimum number of operators needed per shift, dividing by 8 (the duration of one shift in hours) the total hours of work required by the various shift activities. The total number of operators required is then the number of operators per shift multiplied by 5 (i.e., the number of FTEs needed to cover three shifts/day plus training and personal leave). Then, the model calculates how many total hours per week the operators could devote to weekly activities. If the operators are not able to cover all the weekly activities during their shifts, the extra weekly hours are allocated to maintenance FTEs working on one shift. Last, the model checks if the people on-site can also manage transients, that is, unanticipated transients without reactor shutdown, unanticipated reactor shutdowns, and activities in preparation for the transportation off-site for refueling and main repair maintenance activities. If the number of people on-site is not sufficient, the model calls for extra help from people off-site to manage transients, and it thus will add an additional portion of FTE time.
The first microreactor units (Model 1 in ) require security staff on-site. We estimate that at least two people per shift will be needed, which means at least 10 FTEs in total, taking into account the 24/7 factor. Even with this number, which may be a lower bound, when comparing ’s Models 1 and 2, the huge impact that security staff have on the total number of FTEs needed can be seen, which supports the previously described need to develop and demonstrate with the first units a strong security case to justify the absence of armed guards on-site for the fleet.
TABLE III Maintenance Workers, Plant Operators, and Security Staff Models Considered for Microreactors
In the third model (Model 3 in ), predictive maintenance eliminates the need for manually monitoring maintenance activities (sensor shift checks, monitoring shift checks, and prognostic sensor checks). Thus, in a way similar to Models 1 and 2, the number of operators is calculated for the load-following activities plus transient management.
The optimized model (Model 4) foresees no personnel permanently on-site. In this case, predictive maintenance, remote monitoring, and autonomous operation substitute most of the human activities during normal operations. Thus, the personnel are needed only to manage transients. As described in previous sections, two types of personnel are trained to manage transients in this model: remote monitors, who monitor several reactors from a centralized monitoring room, and field operators, who are not permanently on-site and travel on-site only when needed to restart the reactor or prepare it for shipment. The FTE time that these activities involve is the same as in the previous cases, plus additional travel time that has to be taken into account to move the operators from the central facility to each site where intervention is needed. As can be seen from the results presented in , this analysis confirms the idea that transient management has a very low impact on cost and FTE numbers, and thus, their automation, if feasible, would probably not be economically attractive.
In all the models, the annual cost of personnel is calculated by multiplying the number of FTEs by the previously cited annual cost of 178 500 USD/yr.
summarizes the results of the staffing analysis from the previously introduced four models of O&M. We think these four models may be implemented in sequence from the very first microreactor units deployed to the ultimate goal of a large fleet of microreactors for a reactor of a complexity with the number of sensors similar to the MITR. In all of these models, we consider the highest-cost case from the organizational point of view (i.e., a single unit at each site). Again, only monitoring of maintenance workers, plant operators, and security staff is included, as those categories are the only staffing categories the optimization is focused on. As expected, the highest impact on FTE numbers is due to 24/7 activities. Thus, eliminating the need for any 24/7 position should be the priority in an optimization exercise.
As previously described, the operators, remote monitors, and maintenance staff for the remote scenario represent the average number of FTEs allocated to each reactor. This average cost allocation works only if the number of systems managed is high enough (calculation outside the scope of this paper), so that the average number of FTEs allocated multiplied by the number of systems well represents the actual number of people employed by the service company in that role. At the opposite extreme, in the case of servicing a single microreactor, this averaging would not work at all, as the necessary workers would be equal to the number of workers needed in parallel to execute the most demanding task.
For example, if one task needed five people working in parallel, the service company would employ at least five people, independent of the total number of reactors it is effectively servicing. The result of our analysis is that one remote monitor worker can devote enough time to monitor 20 reactors at the same time (1/0.05 = 20). This capability should be confirmed in future studies by a human performance analysis. In fact, this number may have to be lowered in order for the workers to be able to devote more attention to each individual reactor, especially in the instance of more than one reactor transient occurring at the same time. We reaffirm that only monitoring of maintenance workers and plant operators is included. Other categories of staffing must be added if the goal is to estimate the total number of FTEs needed by, for example, the service company that will provide the O&M service to the microreactor fleet (e.g., repair maintenance, engineering, administrative, management, procurement, and training staff categories).
For the case with on-site staff, we assume one person has skills in all reactor systems. This is a very unlikely assumption since plant maintenance staff are qualified by engineering field (e.g., electrical, mechanical, I&C) and by system. This number may be higher (e.g., six different people).
III.B. Application of the Cost Model to Estimate Savings Derived from Task Automations
The cost differential with respect to the baseline scenario of the various O&M models applied to a reactor of a complexity and number of sensors similar to the MITR is illustrated in . As can be seen, the first units will have significantly more expensive O&M with respect to the eventual optimized fleet, which achieves an ~82% savings with respect to the reference scenario.
TABLE IV Cost Differential of Analyzed Maintenance Workers, Plant Operators, and Security Staffing Versus Technologies Enabling Operation with Off-Site Staff
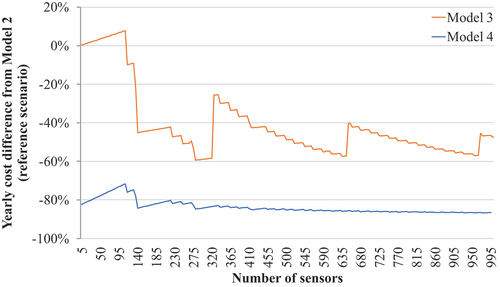
Next, we perform sensitivity analyses on the results. In particular, for this model to be useful to reactors of different complexity and numbers of sensors, we calculate how the cost differential between the reference model (Model 2) and the improved models (Models 3 and 4) varies by varying the total number of sensors per reactor. Starting from 50 and going up to 10 000 sensors/reactor, the trend decreases, as shown in . It can be seen that the potential savings may be greater for reactors that require a higher number of sensors. The function reaches a plateau of about −88% for over 22 000 sensors (not shown in figure).
Fig. 4. Percentual cost difference when varying the number of sensors. Discontinuities are due to rounding to integers in the function.
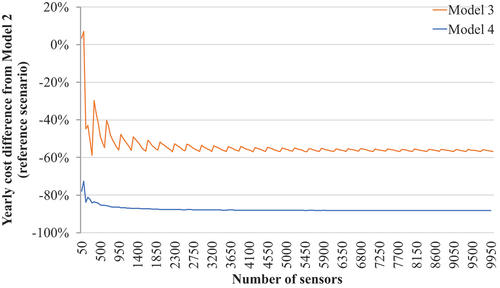
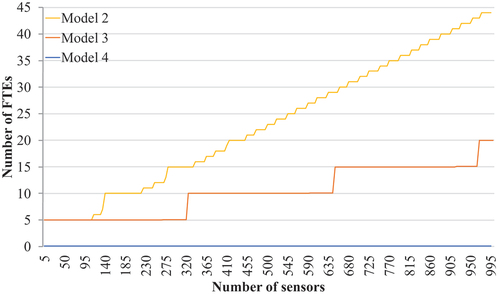
The curve is not smooth and shows discontinuities because of rounding to integers in calculating the number of monitoring maintenance FTEs on-site (which appear in Model 2 only) and to multiples of 5 of operators on-site (Models 2 and 3 only). shows the number of FTEs calculated for Models 2, 3, and 4 for the first 1000 sensors. As already stated, FTEs in Model 4 manage only transients from off-site, the occurrence of which is not related to the number of sensors installed. Thus, as shown in , the number of FTEs for Model 4 remains constant (0.10 FTEs) varying the number of sensors. The number of FTEs for Model 3 shows evident step increases as the FTEs on-site are operators that work on five shifts, and thus, each time one operator more per shift is needed, the total number of FTEs increases by five units. In Model 2, both operators and monitoring maintenance workers are present on-site. As monitoring maintenance workers work on one daily shift only, their number can be incremented by one unit at each time.
Fig. 5. Number of FTEs when varying the number of sensors. Detail on the first 1000 sensors.
shows the calculated yearly cost of each model for the first 1000 sensors. The trend is a superposition of the FTE cost trend (which has the same behavior of the number of the FTE trend) plus linear trends, which represents the cost of I&C for predictive maintenance (both Models 3 and 4), remote monitoring (Model 4 only), and autonomous operation (Model 4 only). Up to approximately 100 sensors, the number of FTEs is the same in both Models 2 and 3; thus, their staffing costs are the same. However, in Model 3 there is an additional cost for predictive maintenance I&C. Thus, the cost of Model 3 is higher in this range, meaning that the implementation of only predictive maintenance without eliminating the presence of operators on-site is not economically advantageous for reactors with a low number of sensors. This trend explains the first positive peak evident in . zooms in to show the behavior of the curve in for the first 1000 sensors.
Fig. 6. Yearly cost when varying the number of sensors. Detail on the first 1000 sensors.
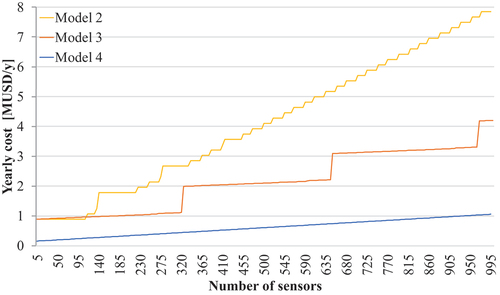
Fig. 7. Percentual cost difference when varying the number of sensors. Detail on the first 1000 sensors.
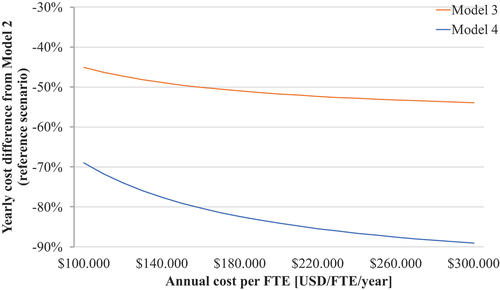
Another trend that we analyzed is the variation of savings when the annual cost per FTE is varied. As can be seen in , even with a cost per FTE of 100 000 USD/yr, for Model 4, the savings are ~69%, and they increase as the cost per FTE increases up to ~89% for a cost per FTE of 300 000 USD/yr. The savings for Model 3 start from ~45% and go to ~54%.
Fig. 8. Cost difference when varying the annual cost per FTE.
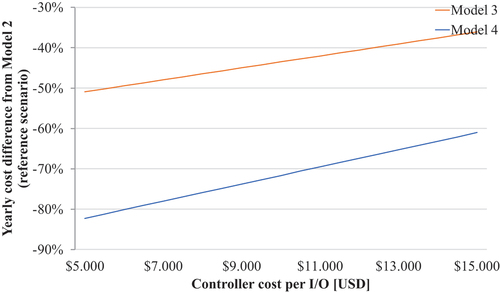
Even incrementing the controller cost per input/output (I/O) from the calculated 5000 USD to 15 000 USD, the business case is still robust. Tripling this cost, the savings for Model 4 pass from ~82% to ~61% and for Model 3 from ~51% to ~36%, as shown in .
Fig. 9. Cost difference when varying the controller cost per I/O.
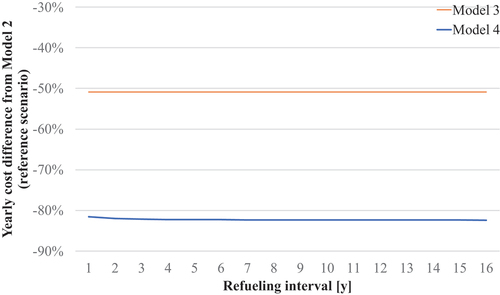
We also checked if the refueling interval had any impact on savings. shows that managing transients has a very low impact on costs, as already mentioned.
Fig. 10. Cost difference when varying the refueling interval.
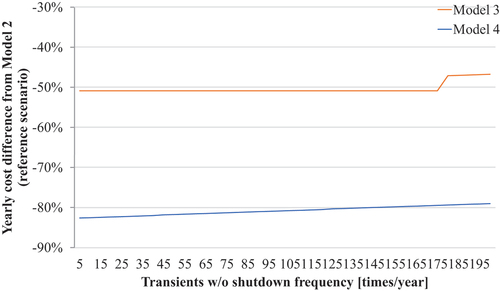
A similar trend that confirms again the low impact of transients on cost is the variation of the number of unanticipated interventions without shutdown, as shown in . It is interesting to note that at a very high frequency (which would probably be unjustifiable by design), there is a jump in Model 3, where the operators on-site can no longer manage the transients and thus need off-site support.
Fig. 11. Cost difference when varying the transients without shutdown frequency.
Another interesting trend is the variation in savings with the number of load-following increments per day (which depend on the variations in power demand) that operators need to manage, shown in . Model 4 shows a monotone descending curve whereas Model 3 shows an ascending, nonmonotonic behavior. These two behaviors can be explained looking at the curves representing the number of FTEs for the three models, shown in . In fact, FTE costs, which derive directly from FTE numbers, are the only costs affected in this sensitivity analysis, as a reasonably higher number of actions per day do not influence the cost of I&C. As load-following is one of the routine tasks that I&C manages in Model 4, the number of FTEs for Model 4 is not impacted by any variation of load-following increments per day. Thus, the cost of Model 4 remains constant with this variation.
Fig. 12. Cost difference when varying the load-following increments per day.
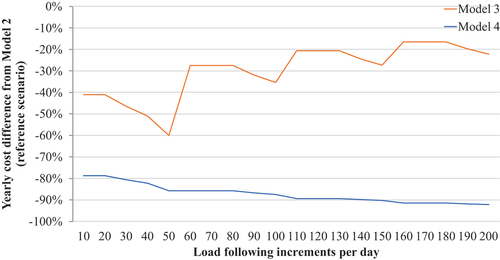
Fig. 13. Number of FTEs when varying the load-following increments per day.
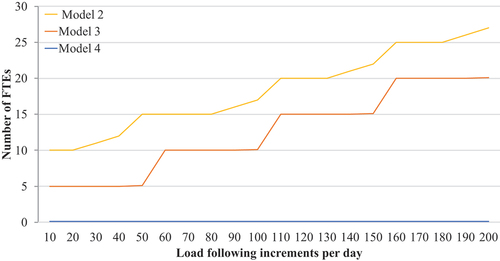
On the other side, if the load-following is managed by operators as in Model 3 and in the baseline case (Model 2), the higher the number of activities connected to load-following is, the higher the number of operators needed to manage it is. For this reason, the number (and the cost) of personnel in the baseline scenario and in Model 3 always increases. The difference between Models 2 and 3 is that predictive maintenance I&C in Model 3 takes over the routine monitoring maintenance tasks, which correspond to the work of an average of 1.1 FTE/shift in Model 2. This number can be decomposed in 1 FTE/shift plus 0.1 FTE/shift. One FTE/shift corresponds to 5 FTEs in total, which is the distance between the plateaus shown by Models 2 and 3 in . The workload corresponding to the additional 0.1 FTE/shift for Model 2 can be managed by operators doing power maneuvering—if they have enough time available—or, as previously described, by people on one daily shift. Looking at the curve representing Model 2 in , the plateaus, which occur at a number of FTEs that are multiples of 5, represent all situations in which the operators are able to manage the additional workload corresponding to 0.1 FTE. Between two subsequent plateaus, there is a transition zone in which extra FTEs on one shift are needed to take care of the 0.1 FTE workload. As can be noticed in , this implies that the difference between the FTEs needed in Models 2 and 3 periodically oscillates with a maximum of 5 FTEs.
Examining again , the periodic local minimum peaks shown by the curve representing Model 3 correspond to the transition zones just described, whereas the plateaus correspond to the situations in which both Models 2 and 3 show a plateau in the number of FTEs. The curve for Model 3 in has an ascending trend because as stated, the difference in the number of FTEs between the two models is at maximum 5 FTEs. This implies that the difference between the costs of the two models does not increase with the number of load-following increments per day. Thus, as the total cost of both models increases, the difference calculated in percentage becomes smaller. The curve representing Model 4 in is descending as the cost of the baseline case (Model 2) is monotonic ascendent whereas the cost of Model 4 is constant.
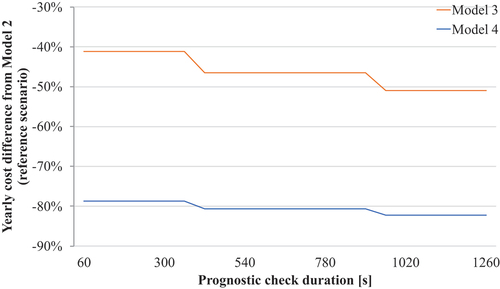
, and display the trends obtained by varying three of the parameters that influence the regular monitoring maintenance tasks. In this case, since predictive maintenance I&C manages these regular tasks in both Models 3 and 4, the costs do not vary. The only cost that varies is the cost of the baseline scenario (Model 2) and, thus, the difference illustrated on the y-axis of these figures. The cost of the baseline increases with increasing duration as these checks are made manually. Thus, at some point, it is necessary to hire more personnel to manage these activities. This also explains the discontinuous behavior due to the increase in cost for each new hire.
Fig. 14. Cost difference when varying the monitoring check duration.
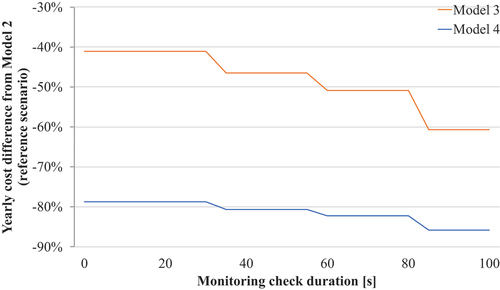
Fig. 15. Cost difference when varying the shift check duration.
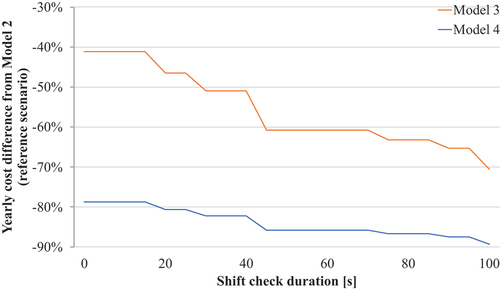
Fig. 16. Cost difference when varying the prognostic check duration.
IV. CONCLUSIONS AND FUTURE WORK
In this work, we proposed a pathway to optimize staffing resources for microreactors. In particular, the study demonstrated how to shift from an O&M model in which security staff, maintenance workers, and operators are permanently on-site to a model in which the staff visit the site only to execute programmed interventions. To equip the microreactor for optimized staffing, we identified autonomous operation, remote monitoring, and predictive maintenance as the enabling technologies. We calculated the staff needs for four analyzed scenarios. Moreover, we presented a model to estimate whether it is economically advantageous to increase the autonomy of a system by introducing more I&C into its design and reducing the number of FTEs working on the O&M of the system.
The conclusions are that automation can help save more than 80% in costs for on-site O&M of microreactors. In fact, for the scenario with on-site staff, our model calculated the need for 12 FTEs/microreactor (or 22 FTEs if armed safeguards are present on-site). In the optimal scenario, an average of only 0.10 FTEs is needed. Of these 0.10 FTEs, 0.05 FTEs are operators going site to site when the reactor needs to be restarted or when it needs to be prepared for shipment. The other 0.05 FTEs are remote monitors, who monitor the reactor parameters from a remote-monitoring room. In other words, on average, one person monitors as many as 20 reactors. These 0.10 FTEs are needed to manage the very low fraction of time represented by operational transients (shutdowns, restarts, slightly deviating conditions that need to be monitored). In the optimal scenario, all the normal routine tasks that represent the vast majority of FTE time spent on the reactor are carried out by I&C. Based on these findings, we argue that there is limited reason to focus on automating transient operation management. Transient operation management represents a very small fraction of the cost of operation, and transients are substantially more difficult to automate than normal operations.
We then performed sensitivity analyses on parameters of interest. These analyses confirmed the low impact of transients on the total cost and highlighted some interesting trends to take into account during the design phase. In particular, the business case for full automation of routine tasks looks robust, but attention should be paid to small reactors for which a partial remotization of personnel could, in fact, be economically detrimental. The path from the first units (which realistically will be required to have personnel on-site 24/7) to the eventual unmanned fleet will require accumulation of extensive operating experience from the first units themselves. This experience should demonstrate that the technology that allows the proposed O&M off-site organization is reliable and human presence on-site is not essential for the safe and reliable operation of the system.
The main limitation of this study is the lack of sufficient detailed information about current microreactor designs. To address this shortcoming, the MITR was used as a proxy. However, the model can be easily modified to assess the viability of autonomous operation for any given scenario.
When more detailed information about microreactor design and I&C is available, future work should build a more detailed business case to confirm the validity of the initial findings presented here. Moreover, future work should study the optimal number of microreactors that one remote monitor can effectively monitor. A human performance study should confirm whether the number estimated in this study, i.e., one remote monitor for 20 microreactors, is feasible and if there is space for further optimization. Additional work can also explore how the proposed model with no maintenance workers or operators permanently on-site impacts the other off-site staff and what would be the total amount of staff that a microreactor fleet would need to operate.
Last, the benefits of combined responsibilities for on-site staffing (e.g., security staff functioning also as maintenance staff) were not considered here and could influence the final conclusions from this analysis.
Acknowledgments
This work was supported by the U.S. Department of Energy (DOE) as part of Nuclear Energy University Program Project 20-19042, “Flexible Siting Criteria and Staff Minimization for Micro-Reactors.” The authors would like to thank everyone who made this work possible, in particular, Sacit Cetiner and Edward Lau from the MIT Nuclear Reactor Laboratory for their collaboration and for the information provided about the MITR.
This manuscript was co-authored by Battelle Energy Alliance LLC, Operator of Idaho National Laboratory under contract number DE-AC07-05ID14517 with the DOE. Part of the work was sponsored by the Microreactor Program.
The United States government retains for itself, and others acting on its behalf, a paid-up nonexclusive, irrevocable worldwide license in said paper to reproduce, prepare derivative works, distribute copies to the public, and perform publicly and display publicly, by or on behalf of the government. The DOE will provide public access to these results of federally sponsored research in accordance with the DOE Public Access Plan: energy.gov/downloads/doe-public-access-plan.
Disclosure Statement
No potential conflict of interest was reported by the author(s).
Additional information
Funding
Notes
a Code of Federal Regulations, Title 10, “Energy,” Part 830, “Nuclear Safety Management,” U.S. Nuclear Regulatory Commission.
b Code of Federal Regulations, Title 10, “Energy,” Part 50, “Domestic Licensing of Production and Utilization Facilities,” Appendix A, “General Design Criteria for Nuclear Power Plants,” U.S. Nuclear Regulatory Commission.
References
- D. OWUSU et al., “Regulatory and Licensing Strategy for Microreactor Technology,” INL/EXT-18-51111-Rev000, Idaho National Laboratory (2018); http://dx.doi.org/10.2172/1565916.
- “DOE Standard: Hazard Categorization of DOE Nuclear Facilities,” DOE-STD-1027-2018, U.S. Department of Energy (Nov. 2018); https://www.standards.doe.gov/standards-documents/1000/1027-astd-2018/@@images/file (current as of May 13, 2024).
- A. ABOU-JAOUDE et al., “Assessment of Factory Fabrication Considerations for Nuclear Microreactors,” Nucl. Technol., 209, 11, 1697 (2023); https://doi.org/10.1080/00295450.2023.2206779.
- J. WOOD, “Inside What Could Be the World’s First Autonomous Power Plant,” SPECTRA (Feb. 4, 2021); https://spectra.mhi.com/inside-what-could-be-the-worlds-first-autonomous-power-plant (current as of May 13, 2024).
- “Siemens Carried Out First Remote Start-Up and Adjustment Work in Russia at Nyagan GRES,” Fortum (2020); https://www.fortum.com/media/2020/06/siemens-carried-out-first-remote-start-and-adjustment-work-russia-nyagan-gres (current as of May 13, 2024).
- E. LAGRANGE, “Building a Low-Manned Production Installation: Considerations for Rotating Equipment, Electrical & Automation Systems, and Digitalization,” SPE-205427-MS, presented at Society of Petroleum Engineeers Offshore Europe Conference & Exhibition, Virtual Meeting, September 7–10, 2021; http://dx.doi.org/10.2118/205427-MS.
- A. Y. AL RASHDAN et al., “Development of a Technology Roadmap for Online Monitoring of Nuclear Power Plants,” INL/EXT-18-52206-Rev000, Idaho National Laboratory (2018); https://lwrs.inl.gov/Advanced%20IIC%20System%20Technologies/Development_of_a_Technology_Roadmap_for_Online_Monitoring_of_NPP.pdf (current as of May 13, 2024).
- O. ALI, “The Unmanned Mine: A Review of Current and Future Developments,” AZO Mining (2022); https://www.azomining.com/article.aspx?ArticleID=1654 (current as of May 13, 2024).
- J. BUONGIORNO et al., “Can Nuclear Batteries Be Economically Competitive in Large Markets?” Energies, 14, 4385 (2021); http://dx.doi.org/10.3390/en14144385.
- H. C. BRYAN et al., “Remote Nuclear Microreactors: A Preliminary Economic Evaluation of Digital Twins and Centralized Offsite Control,” Front. Nucl. Eng., 2, 1293908 (2023); http://dx.doi.org/10.3389/fnuen.2023.1293908.
- J. MANGIN et al., “Consequence-Based Security of a Sodium-Cooled Graphite-Moderated Thermal Microreactor (SGTR),” MIT-ANP-TR-200, Massachusetts Institute of Technology (2024); https://www.researchgate.net/publication/380001008_Consequence-based_security_of_a_sodium-cooled_graphite-moderated_thermal_microreactor_SGTR (current as of May 13, 2024).
- “Nuclear Reactor Facility Description Manual,” Massachusetts Institute of Technology Nuclear Reactor Laboratory (2024).
- “Gas Turbine Performance Software,” GE Vernova; https://www.ge.com/digital/applications/asset-performance-management-apm-software/gas-turbine-performance-software (current as of May 13, 2024).
- A. Y. AL RASHDAN et al., “Integration of Control Methods and Digital Twins for Advanced Nuclear Reactors,” INL/RPT-22-69937-Rev000, Idaho National Laboratory (2022); https://inldigitallibrary.inl.gov/sites/sti/sti/Sort_64262.pdf (current as of May 13, 2024).
- M. CHEW and J. BUONGIORNO, “A Cybersecurity Framework for Nuclear Microreactors,” MIT-ANP-TR-197, Massachusetts Institute of Technology Center for Advanced Nuclear Energy Systems (June 2023); https://canes.mit.edu/cybersecurity-framework-nuclear-microreactors (current as of May 13, 2024).
- C. W. KANG, “Advanced Monitoring and Advice Integrating a Comprehensive Sensor Network for Improved Operational Availability,” Massachusetts Institute of Technology (1998); https://dspace.mit.edu/handle/1721.1/50495 (current as of May 13, 2024).
- A. ABOU JAOUDE et al., “An Economics-by-Design Approach Applied to a Heat Pipe Microreactor Concept,” INL/EXT-21-63067-Rev000, Idaho National Laboratory (2021); http://dx.doi.org/10.2172/1811894.
- K. SHIRVAN et al., “UO2-Fueled Microreactors: Near-Term Solutions to Emerging Markets,” Nucl. Eng. Des., 412, 9, 112470 (2023); http://dx.doi.org/10.1016/j.nucengdes.2023.112470.
- “Predictive Maintenance—Taking Pro-Active Measures Based on Advanced Data Analytics to Predict and Avoid Machine Failure,” Deloitte Analytics Institute (July 2017); https://www2.deloitte.com/content/dam/Deloitte/de/Documents/deloitte-analytics/Deloitte_Predictive-Maintenance_PositionPaper.pdf (current as of May 13, 2024).
- “Study of Construction Technologies and Schedules, O&M Staffing and Cost, Decommissioning Cost and Funding Requirements for Advanced Reactor Designs,” Dominion Energy Inc. (2004); https://www.nrc.gov/docs/ML1018/ML101820632.pdf (current as of May 13, 2024).
- “Occupational Employment and Wage Statistics,” U.S. Bureau of Labor Statistics (May 2023); https://www.bls.gov/oes/current/oes518011.htm# (current as of May 13, 2024).