
Jørgen Frost, Ernst Ottem, Catherine E. Snow, Bente E. Hagtvet, Solveig Alma Helaas Lyster & Claire White (2013): The Conceptual Nature of Gain in Vocabulary Research: An Analysis of Vocabulary Data from Schoolchildren, Scandinavian Journal of Educational Research, DOI:10.1080/00313831.2013.773560
When the above article was first published an important figure was omitted. The correct version with figures in situ is reprinted below (from page 12):
Figure 3. The associations between the “true” gain and background variables. Standardized variables
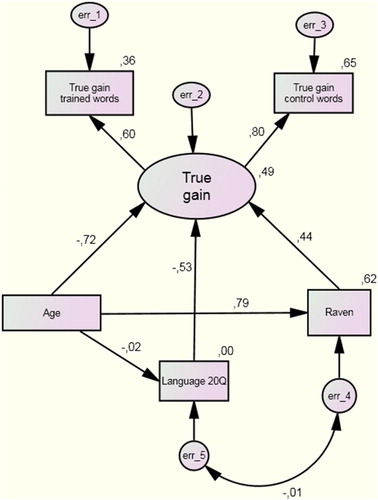
portrays the model used to explore the relationships between the three criterion variables and the “true” gains for trained and control words. The large circle in the model represents a gain factor into which the “true” gains for trained and control words were loaded, and the small circles represent the error variance. The variables Age, Language 20Q, and Raven, are represented by the boxes below the large circle. The model fits the data quite well, as judged by Chi-square and other fit statistics (Chi-square = 3.72, do = 2, p = .16, CFI = .99, RMSEA = .08). The single-headed arrows represent regression weights that were significant at the .001 or .01 level. The arrow pointing from age towards the gain factor has a value of −.72 (S.E. = .037, C.R. = −4.12, p < .001) suggesting a strong effect for age; this indicates that younger children had larger “true” gains than older children. The arrow pointing from Language 20Q towards the gain factor has a value of −.53 (S.E. = .076, C.R. = −4.47, p < .001). In this case, the negative value indicates that children with a high problem score on the Language 20Q have smaller gains than children with lower problem scores. The third arrow pointing towards the gain factor represents the effect of Raven on the gain factor. This weight has a value of .44 (S.E. = .073, C.R. = 2.87, p < .01), indicating that when Raven increases by one standard deviation, the gain factor goes up by .44 standard deviation. Taken together, these variables explained 49% of the variance in the gain factor. On this basis, we may conclude that the “true” gain is valid in the sense that it can be well predicted from relevant criterion variables.
Figure 4. The associations between traditional gain and background variables (standardized values)
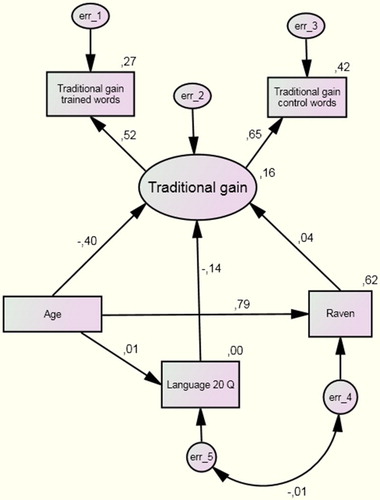
The model for the conventional gain () also fits the data quite well (Chi-square = 1.01, df = 2, p = .61, CFI = .1.00, RMSEA = .000).