
ABSTRACT
The aim of the study was to focus on whether visual processing differs between distinct levels of reading competence in young adults, from a regular orthography. We compared the 10% highest scoring (HRC) and the 10% lowest scoring groups (LRC) of reading competence (using the word chain test, WCT) in visual processing of global coherent motion and global coherent form among young adults in Norway. Results showed that the lowest scoring reading group had higher thresholds for detecting coherent motion, than the highest scoring reading group, indicating lower motion sensitivity in adults with low reading competence of a regular orthography. There was no significant difference between the groups in the coherent form control task. These results may indicate reduced sensitivity to temporally defined stimuli such as coherent motion in the group with low reading competence possible related to vulnerability of the visual dorsal stream.
Introduction
Reading can be understood as consisting of two different, but related skills; word decoding and reading comprehension. Word decoding is efficient and correct recognition of the phonological code of words (Verhoeven, Citation2011) and their meaning (Høien & Lundberg, Citation2012; Revlin, Citation2012), while reading comprehension being able to interpret sentence and discourse is the product of word decoding and language comprehension (Gough & Tunmer, Citation1986; Hoover & Gough, Citation1990).
Although prevalence varies depending on definition, a common cut off criterion is set at 1.5 standard deviations below the mean of age-matched reading skill and therefore classifies approximately 7% of the population as dyslexic (Peterson & Pennington, Citation2012). According to World Health Organization (Citation1992), specific reading difficulties or developmental dyslexia is characterized by difficulties in developing literacy, without this being explained by teaching, general intelligence, age or vision problems. Mixing of letters and words are examples of reading errors. It has been shown that people with dyslexia primarily have difficulties with the technical side of reading, word decoding (Elbro, Nielsen, & Petersen, Citation1994; Rack, Snowling, & Olson, Citation1992). Reading difficulty also seem to vary with orthography, with reading difficulties in regular orthographies being more characterized by speed difficulties than difficulty with accurate reading (Serrano & Defior, Citation2008).
Several theories describe causes of inadequate development of word decoding skills found in dyslexia. Currently the most dominant view of dyslexia states that specific reading difficulties originate from language deficits (Catts, Kamhi, & Adlof, Citation2012). According to the phonological theory, dyslexia (and poor reading skills in general) is characterized by a deficit in the processing, access to or representation of speech sounds (a phonological deficit) (Liberman, Citation1973; Ramus & Szenkovits, Citation2008; Snowling, Citation1981, Citation2001, Citation2014; Stanovich, Citation1988). Several tests are used to measure phonological skills, such as verbal short term memory and rime awareness (Melby-Lervåg, Lyster, & Hulme, Citation2012). Another phonological skill that has received prominent attention in relation to dyslexia is phonemic awareness, which refers to the ability to identify and manipulate phonemes in spoken words (Liberman, Shankweiler, Fischer, & Carter, Citation1974). Phonemic awareness has been shown clearly to be associated with dyslexia (Castles & Coltheart, Citation2004) and is described as the most central predictor for individual differences in word reading (Melby-Lervåg et al., Citation2012).
Reading difficulties have also historically been linked to visual processing (Morgan, Citation1896; Orton, Citation1925). In 1896 the term “word blindness” was used by Morgan (Citation1896, p. 1) to describe the condition of a young boy named Percy. With the term, Morgan described a hereditary state that made the boy almost blind to words and letters. Percy had major problems learning to read despite high intelligence, normally functioning vision and great educational efforts around him. He could only read correctly short words like “and” and “the” without hesitant spelling. Furthermore, when he was writing words, he tended to mix the letters as in the writing of his own name “Precy” (Percy) (Morgan, Citation1896, p. 1). Later, authors elaborated on this idea and suggested that dyslexia is caused by visual processing problems and that these are caused by specific deficits in the visual system (Stein, Citation2019; Stein & Walsh, Citation1997; Vidyasagar & Pammer, Citation2010).
Following Ungerleider and Mishkin (Citation1982) model of two visual systems, it is customary to distinguish a visual ventral and a visual dorsal pathway in the brain. From retina, visual information is sent to magnocellular and parvocellular layers in lateral geniculate nucleus (LGN) in the thalamus. The magnocellular system here is associated with perceiving stimuli that changes rapidly, while the parvocellular system responds to color and detail information (Callaway, Citation2005; Milner & Goodale, Citation2006).
The two visual pathways move on to separate layers of the primary visual cortex (PVC) of the occipital lobe in the back of the brain (Casagrande & Xu, Citation2004). While the dorsal pathway is largely dominated by magnocellular signals (Maunsell, Nealey, & DePriest, Citation1990) and projects to the posterior parietal cortex (PPC), the ventral stream receives a mix of magno- and parvocellular signals and projects to the inferior temporal cortex (IT) (Milner & Goodale, Citation2006). The streams have been referred to as “what” (form and color) and “where” (motion and depth) as it is found that the ventral and dorsal pathways are linked to object recognition in IT and object location in PPC, (Mishkin, Ungerleider, & Macko, Citation1983; Ungerleider & Mishkin, Citation1982; see for overview Taylor, Olulade, Luetje, & Eden, Citation2018). Subsequently the importance of motor control in the dorsal stream has also been highlighted (Goodale & Milner, Citation1992). IT cortex is also widely accepted to be the area in which visual word decoding takes place (Dehaene & Cohen, Citation2011), termed Visual Word Form area (VWFA).
Stein and Walsh (Citation1997) suggested that visual processing problems associated with dyslexia could be explained by the function of the visual system of the brain. According to their theory, mild magnocellular weaknesses in LGN could cause visual confusions that disrupt reading. It is suggested that magnocellular weaknesses could create these visual impairments through the dorsal streams connection with PPC, as PPC is involved in eye movement and visual spatial attention (Andersen, Citation1989; Bisley & Goldberg, Citation2010; Pouget, Citation2015; Stein, Citation2019; Stein & Walsh, Citation1997) which should be crucial factors for reading.
A mechanism for how the dorsal stream impacts on word decoding has been described by Vidyasagar and Pammer (Citation2010). According to these authors, reading is a visual search task. In this task the dorsal stream, which is involved in visual search (Bueichekú et al., Citation2016; Mangano et al., Citation2015), acts as an attentional spotlight and provides information about the order of the letters in a word and passes this information to the ventral stream (where VWFA is located). It is suggested that deficits along the dorsal stream would disrupt visuospatial attention and therefore also have effects on functions of the ventral stream where words are recognized (Vidyasagar & Pammer, Citation2010).
VWFA seems to be involved with sight word reading skill (Ben-Shachar, Dougherty, Deutsch, & Wandell, Citation2011) and has repeatedly been found less active in dyslexic subjects (Martin, Kronbichler, & Richlan, Citation2016; Van der Mark et al., Citation2009), probably reflecting their inefficient reading. Level of visuospatial attention is indeed also found to be associated with word decoding (Franceschini, Gori, Ruffino, Pedrolli, & Facoetti, Citation2012; Pammer, Lavis, Cooper, Hansen, & Cornelissen, Citation2005; Pammer, Lavis, Hansen, & Cornelissen, Citation2004). And this association is found with both letter (Reilhac, Peyrin, Démonet, & Valdois, Citation2013) and non-letter stimuli (Franceschini et al., Citation2012; Pammer et al., Citation2005).
Several studies have used tests involving coherent motion to investigate dorsal stream functionality. Typically, such tasks involve several white dots moving coherently. The tasks often also contain disturbing stimuli in the form of dots that have a random motion. Participants are asked to select the stimulus with coherent motion or direction of such motion (Benassi, Simonelli, Giovagnoli, & Bolzani, Citation2010). Coherent motion has been shown to activate a part of the dorsal stream called MT/V5 (Braddick et al., Citation2001; Eden et al., Citation1996). And this area is dominated by magnocellular signals (Maunsell et al., Citation1990). Studies have shown that subjects with dyslexia have lower motion sensitivity than have controls (Benassi et al., Citation2010; Gori, Seitz, Ronconi, Franceschini, & Facoetti, Citation2016; Rodrigues et al., Citation2017). Study by Boets, Vandermosten, Cornelissen, Wouters, and Ghesquière (Citation2011) support the view that coherent motion is related to reading.
Studies using unselected samples in which groups are defined not by diagnosis but by skill level have also been conducted. If word decoding is related to visual processing in the dorsal stream, magnocellular and dorsal stream measures should differ between levels of reading skill. There appears to be a difference between high and low skill level of word decoding in unselected samples among children (Gori et al., Citation2016; Talcott et al., Citation2002; Talcott et al., Citation2003) and an association between reading skill and motion sensitivity in unselected samples (Cornelissen, Hansen, Hutton, Evangelinou, & Stein, Citation1998; Talcott et al., Citation2000) although with bigger samples the variance explained is smaller (Gori et al., Citation2016; Talcott et al., Citation2002).
Relatively few studies have investigated motion sensitivity in unselected and normal reading adult samples (Conlon, Sanders, & Zapart, Citation2004; Cornelissen, Hansen, Gilchrist, et al., Citation1998; Levy, Walsh, & Lavidor, Citation2010). Conlon et al. (Citation2004) found among students that poor word decoders (in terms of both accuracy and speed) had lower motion sensitivity compared to a group of skilled word decoders. Cornelissen, Hansen, Gilchrist, et al. (Citation1998) compared groups of good and poor coherent motion detectors among an unselected sample of students and found that poor motion detectors made more errors on anagrams of a lexical decision task than good motion detectors. Levy et al. (Citation2010) also compared motion sensitivity in normal reading skill and found that good motion detectors identified words (accurately) faster in a lexical decision task than poorer motion detectors, indicating dorsal stream involvement in intact reading. However, they were not more accurate in the anagram condition as found in the Cornelissen, Hansen, Gilchrist, et al. (Citation1998) study.
From these reports motion sensitivity appears to differ between levels of word decoding, where those subjects who are more proficient in word decoding also appear to have higher sensitivity to motion. To our knowledge few studies have assessed motion sensitivity among readers of a regular orthography. Gori et al. (Citation2016) showed that Italian children’s early motion sensitivity predicted later word decoding skill (normal or poor reading). Talcott et al. (Citation2003) found significant higher motion sensitivity in good readers compared to poor readers in Norwegian children. However, it seems that fewer studies like this have investigated adult samples. Study by Lawton (Citation2016) demonstrated that visual movement direction-discrimination could be used for both detecting dyslexia early and for a successful treatment.
We wanted to investigate if visual processing in an unselected sample of young adults from a regular orthography, Norwegian readers, differ between distinct level of reading competence.
That contrasts with most studies using motion tests in the literature. Normally the studies have selected dyslexic and controls. Based on previous reports on motion sensitivity, especially in children, we think visual processing of coherent motion should differ among high and low level of reading competence. To find out, we compared visual processing between a group with the 10% highest scores of reading competence, which we will refer to as the high reading competence group (HRC) and a group with the 10% lowest scores of reading competence termed the low reading competence group (LRC). The groups were drawn from a larger unselected sample (primarily young students) of adults in Norway.
Methods
Participants
One hundred and ninety-one subjects participated in the study. Five subjects were removed due to self-reported visual problems and testing errors (e.g., the experimenter gave participant too much time to complete the word chain test). Therefore 186 subjects were included in the statistical analysis (mean age 24.70, SD 5.98). From this sample two groups were selected; one scoring high (HRC group) and other low (LRC group) on reading competence. The HRC group consisted of 18 participants (9 females and 9 males) with the 10% highest scores from the word chain test, with a mean score of 74.67 (SD 4.51). The LRC group consisted of 18 participants (7 females and 11 males) with the 10% lowest scores from the word chain test with a mean score of 33.72 (SD 3.14). The average age in the HRC group was 23.50 (standard deviation = 3.85). The average age of the LRC group was 24.06 (standard deviation = 5.52).
The information registered about the participants were anonymous (age and gender). Information about any dyslexia diagnosis was not registered and the test of reading competence used was not diagnostic, so the group of poorer word decoding cannot be characterized as dyslexic. Recruitment was primarily conducted among university students from NTNU (Norwegian university of science and technology). The participants were randomly selected. The participants were tested on word decoding test (the Wordchain Test) and on visual processing (the Motion and the Form test) “Magno app”.
Stimuli and Procedure
“Magno App”
A visual processing app “Magno app” that run on an Android tablet has been developed recently based on the work of Hansen, Stein, Orde, Winter, and Talcott (Citation2001). The Visual Processing tasks that are possible to evaluate using the app have been described in detail previously (Hansen et al., Citation2001). They comprised psychophysical measures of global motion – and global form – processing, were each of the measures requires the detection of target visual stimuli embedded in a field of distracter elements. The system was implemented in a way to both be possible to generate applications running on a PC and on an android tablet. As for mobile platform we choose Android, since it made it easier to distribute the app to testers than using iOS. An early version of the app is described in Wold, Krogstie, and Sigmundsson (Citation2016).
The Global Motion Test
The motion test was tested using a computer. Either a Dell Latitude e6400 was used or a Dell Latitude e6320, in a calm environment at a place and time suitable for the participants. The participants were seated in approximately 40–50 cm from the computer screen.
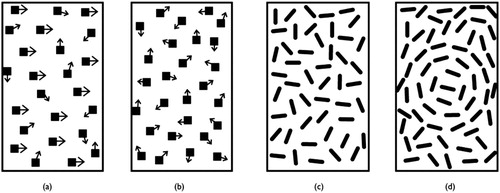
The test displays two boxes. Each box contains 300 dots that move. The boxes are displayed in intervals. For each interval, one of the boxes will be randomly selected to contain systematic motion, also called coherent motion. A portion of the dots will move systematically back and forth between left and right. The movement changes side (left/right motion) every 0.57 s. The rest of the dots in this box will move randomly. In the second box, all dots will move randomly. Random motion means that the dots change direction when colliding with other dots and after 0.57 s. 10% of the dots are removed after 0.085 s to prevent participants from following individual dots (Hansen et al., Citation2001; Wold, Citation2016; Wold et al., Citation2016).
Animation time was 5 s, after which the participants were asked to identify which of the two boxes showed systematic motion. The coherence of the dots is changed for the next trial based on response, using a weighted staircase procedure. For correct response, “coherence” is set lower by 1dB (equivalent to a factor of 1.222) making the task more difficult. In the case of a wrong response coherence is increased by 3 dB (equivalent to a factor of 1.413) making the task easier. The final test result is a geometric mean of the last eight reversal values (Wold, Citation2016). This detection threshold is defined as the smallest proportion of coherently moving dots required for detection of coherent motion, in which lower threshold indicates higher sensitivity (Hansen et al., Citation2001; Sigmundsson, Hansen, & Talcott, Citation2003).
The Global Fixed Form Test
The fixed form test was tested using a computer. Either a Dell Latitude e6400 and a Dell Latitude e6320 was used, in a calm environment at a place and time suitable for the participants. The participants were seated in approximately 40–50 cm distance from the computer screen.
This test shows two boxes. Each box contains 600 small static lines. The boxes are displayed in intervals. For each interval, the lines in one box will form a circle shape in the middle of the box. Which box this will be for each interval is random. The boxes with stimuli are displayed for 4 s. The participants were then asked to identify which box contained the circle shape. The same type of staircase procedure was used as in the motion test (Wold, Citation2016) with correct answers leading to a lowering coherency by 1 dB (factor of 1.222) and wrong answers increasing coherency by 3 dB (factor of 1.413) (see ). The detection threshold is defined as the proportion of coherently oriented lines necessary to detect the circle shape. Lower threshold indicates higher sensitivity (Hansen et al., Citation2001; Sigmundsson et al., Citation2003).
Figure 1. Schematic diagrams of the coherent motion (panels (a) and (b)) and coherent form (panels (c) and (d)) paradigms. For the coherent motion stimuli, the arrows represent the motion vector of each dot in the panel. Panel (a) depicts 50% coherence; half of the dots are moving together (in this case reversing left and right), whereas the rest of the dots are moving in random directions. Panel (b) depicts the random motion in the non-target RDK patch. Each dot moves in a random direction so the average coherence value is close to 0%. Panels (c) and (d) depict the coherent form task. In this measure subjects detect a circle which is comprised of coherently oriented line segments. The outline depicts the region within the panel that contained the coherent target. Threshold is defined as the percent coherent signal averaged over a number of staircase reversals for each stimulus type. See text for details (stimuli are not drawn to scale) (Sigmundsson et al., Citation2003).
The Wordchain Test (WCT)
Reading competence was measured using the Wordchain Test (WCT) in Norwegian, the ordkjeder (Wordchains), which is a valid and reliable test of word decoding proficiency (Høien & Tønnesen, Citation1997; Jacobson, Citation1993; Miller-Guron, Citation1999). The test consists of a total of 90 wordchains. One wordchain is four words that are assembled without spaces presented in the following way daycanhousenow. The wordchain can be divided by drawing three vertical lines segmenting the letters into words. The subjects were asked to divide as many wordchains as possible within a 4-min time window. Points were assigned to each correctly solved wordchain, with a maximum score of 90 points. The test is thus a measure of both speed and accuracy of word recognition, and higher scores indicate better word decoding skill (Høien & Tønnesen, Citation1997). The participants were able to familiarize themselves with the test in advance.
Data Analysis
In the literature on skill versus ability there is usual to have cutoff points on 10% or 5% with low and high competence in the skill the focus is on. For example when dealing with the question whether children on different level in mathematic (high and low) differ in visual processing (see Sigmundsson, Anholt, & Talcott, Citation2010). In this study we did choose the cutoff point at 10% as the Sigmundsson et al., Citation2010 study. If we take for example cutoff of 5% low (N = 9) and 5% high (N = 9) we get significance .047 (2-tailed) for the coherent motion and .566 (2-tailed) for the form test. For the group as a whole (N = 186) the correlation between reading competence score and the motion score is: r = −.205, that is, significant at the .01 level. The correlation between reading competence score and the form score is: r = −.105 (not significant).
Results
A Mann–Whitney U test was used to investigate if there was a difference between the LRC and HRC group on visual processing. Motion threshold for the HRC group was significantly lower than for the LRC group, U = 86.000, p = .016. Fixed form threshold for the LRC and the HRC groups was not significantly different, U = 137.000, p = .429.
From the descriptive statistics in we can see that the LRC group on average scored higher on the motion test than the HRC group, indicating lower sensitivity to motion (see and (A)). In the fixed form test the two groups scored approximately the same on average (see (B)).
Figure 2. The individual subjects in high reading competence (HRC) and low reading competence (LRC) group score in motion. The line indicate the 1 SD from the mean score HRC group.
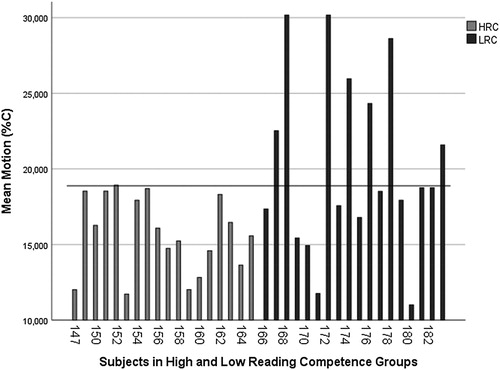
Figure 3. Box plots depicting the HRC (n = 19) and LRC (n = 18) performance on the psychophysical tests of visual performance. (A) Coherent Motion (U = 86.000, p = .016). (b) Coherent Form (U = 137.000, p = ns.). Horizontal lines within boxes represent the group medians. Box edges define the first and third quartiles, whiskers define the 10th and 90th percentile.
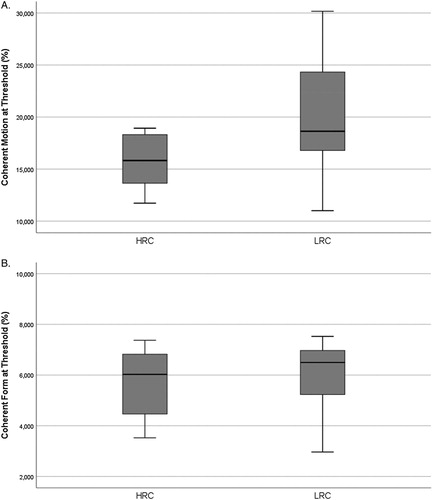
Table 1. Mean and standard deviation for HRC and LRC groups on the psychophysical tasks of visual coherent motion and form.
Discussion
We tested if visual processing, specifically coherent motion threshold and fixed form threshold, differ between distinct levels of reading competence in young unselected adults, from a regular orthography, comparing the HRC and the LRC groups. In contrast to most of the studies using motion tests in the literature, we did not compare a sample of selected dyslexic and controls but compared the 10% of the highest and 10% of the lowest scoring subjects from a large unselected sample, on visual processing. The results are in line with what has been reported in selected samples, with lower reading skill showing lower motion sensitivity (Benassi et al., Citation2010; Taylor et al., Citation2018). Coherent motion threshold differed between our groups with distinct levels of reading competence, measured with the WCT. The results, therefore, support theories suggesting that visual processing through the dorsal visual stream is involved in word decoding skill (Stein & Walsh, Citation1997; Vidyasagar & Pammer, Citation2010) and that magnocellular signals might influence word decoding in a perceptual bottom-up manner (Stein & Walsh, Citation1997). However, a closer look on indicates that visual processing problems are not necessary for the development of reading difficulties but may be one of potentially many causes of such difficulties. Importantly our word decoding measure (WCT) differ in important ways from reading measures used in similar studies, such as lexical decision tasks with letter transpositions vs. words (Cornelissen, Hansen, Gilchrist, et al., Citation1998; Levy et al., Citation2010). All words in the test were real words. Moreover, as the WCT was presented on paper, there were no time constraint on presentation of the individual stimuli, although the participants were asked to divide as many word chains as they could in the 4-min time window. Moreover, the difference between the two groups on the fixed form test was not significant.
Furthermore, previous studies have used samples who were mostly English speaking (Conlon et al., Citation2004; Cornelissen, Hansen, Gilchrist, et al., Citation1998; Talcott et al., Citation2002). Reading difficulties across orthographies differ. For example, struggling readers of regular orthographies often have a main problem with reading speed (Serrano & Defior, Citation2008). Visual processing might be more important for reading of irregular orthographies in which the grapheme-phoneme correspondence is more complex. Still, our results with Norwegian subjects replicated differences between high and low reading skill (word decoding skill) in motion sensitivity in previous English speaking samples (Conlon et al., Citation2004). This suggests that visual processing ability in reading is also important in regular orthographies.
Early reading development involves learning how to map letters with speech sounds (Sigmundsson, Eriksen, Ofteland, & Haga, Citation2017; Sigmundsson, Haga, Ofteland, & Solstad, Citation2020), and experience with reading words causes reading to eventually become automatic and effortless (Ehri, Citation2005). Adults and children’s reading differ in terms of reading experience, and dorsal stream processing might be more relevant in children because their reading is more demanding of attention. However, our results suggest that different reading skill level among adults also differ in motion sensitivity, which is consistent with similar research in adults (Hansen et al., Citation2001) and in children (Talcott et al., Citation2003).
Ethical approval: All procedures performed in studies involving human participants were in accordance with the ethical standards of the institutional and/or national research committee and with the 1964 Helsinki declaration and its later amendments or comparable ethical standards.
Disclosure Statement
No potential conflict of interest was reported by the authors.
References
- Andersen, R. A. (1989). Visual and eye movement functions of the posterior parietal cortex. Annual Review of Neuroscience, 12(1), 377–403. doi: 10.1146/annurev.ne.12.030189.002113
- Ben-Shachar, M., Dougherty, R. F., Deutsch, G. K., & Wandell, B. A. (2011). The development of cortical sensitivity to visual word forms. Journal of Cognitive Neuroscience, 23(9), 2387–2399. doi: 10.1162/jocn.2011.21615
- Benassi, M., Simonelli, L., Giovagnoli, S., & Bolzani, R. (2010). Coherence motion perception in developmental dyslexia: A meta-analysis of behavioral studies. Dyslexia, 16(4), 341–357. doi: 10.1002/dys.412
- Bisley, J. W., & Goldberg, M. E. (2010). Attention, intention, and priority in the parietal lobe. Annual Review of Neuroscience, 33, 1–21. doi: 10.1146/annurev-neuro-060909-152823
- Boets, B., Vandermosten, M., Cornelissen, P., Wouters, J., & Ghesquière, P. (2011). Coherent motion sensitivity and reading development in the transition from prereading to reading stage. Child Development, 82(3), 854–869. doi: 10.1111/j.1467-8624.2010.01527.x
- Braddick, O., O’Brien, J. M., Wattam-Bell, J., Atkinson, J., Hartley, T., & Turner, R. (2001). Brain areas sensitive to coherent visual motion. Perception, 30(1), 61–72. doi: 10.1068/p3048
- Bueichekú, E., Miró-Padilla, A., Palomar-García, M-Á, Ventura-Campos, N., Parcet, M.-A., Barrós-Loscertales, A., & Ávila, C. (2016). Reduced posterior parietal cortex activation after training on a visual search task. NeuroImage, 135, 204–213. doi: 10.1016/j.neuroimage.2016.04.059
- Callaway, E. M. (2005). Structure and function of parallel pathways in the primate early visual system. The Journal of Physiology, 566(1), 13–19. doi: 10.1113/jphysiol.2005.088047
- Casagrande, V. A., & Xu, X. (2004). Parallel visual pathways: A comparative perspective. In L. Chalupa & J. S. Werner (Eds.), The visual neurosciences (pp. 494–506). Cambridge, MA: MIT Press.
- Castles, A., & Coltheart, M. (2004). Is there a causal link from phonological awareness to success in learning to read? Cognition, 91(1), 77–111. doi: 10.1016/S0010-0277(03)00164-1
- Catts, W. C., Kamhi, A. G., & Adlof, S. M. (2012). Defining and classifying reading disabilities. In A. G. Kahmi & H. W. Catts (Eds.), Language and reading disabilities (pp. 45–111). Boston, MA: Pearson Education.
- Conlon, E., Sanders, M., & Zapart, S. (2004). Temporal processing in poor adult readers. Neuropsychologia, 42(2), 142–157. doi: 10.1016/j.neuropsychologia.2003.07.004
- Cornelissen, P., Hansen, P., Gilchrist, I., Cormack, F., Essex, J., & Frankish, C. (1998). Coherent motion detection and letter position encoding. Vision Research, 38(14), 2181–2191. doi: 10.1016/S0042-6989(98)00016-9
- Cornelissen, P., Hansen, P., Hutton, J., Evangelinou, V., & Stein, J. (1998). Magnocellular visual function and children’s single word reading. Vision Research, 38(3), 471–482. doi: 10.1016/S0042-6989(97)00199-5
- Dehaene, S., & Cohen, L. (2011). The unique role of the visual word form area in reading. Trends in Cognitive Sciences, 15(6), 254–262. doi: 10.1016/j.tics.2011.04.003
- Eden, G. F., VanMeter, J. W., Rumsey, J. M., Maisog, J. M., Woods, R. P., & Zeffiro, T. A. (1996). Abnormal processing of visual motion in dyslexia revealed by functional brain imaging. Nature, 382(6586), 66. doi: 10.1038/382066a0
- Ehri, L. C. (2005). Learning to read words: Theory, findings, and issues. Scientific Studies of Reading, 9(2), 167–188. doi: 10.1207/s1532799xssr0902_4
- Elbro, C., Nielsen, I., & Petersen, D. K. (1994). Dyslexia in adults: Evidence for deficits in non-word reading and in the phonological representation of lexical items. Annals of Dyslexia, 44(1), 203–226. doi: 10.1007/BF02648162
- Franceschini, S., Gori, S., Ruffino, M., Pedrolli, K., & Facoetti, A. (2012). A causal link between visual spatial attention and reading acquisition. Current Biology, 22(9), 814–819. doi: 10.1016/j.cub.2012.03.013
- Goodale, M. A., & Milner, A. D. (1992). Separate visual pathways for perception and action. Trends in Neurosciences, 15(1), 20–25. doi: 10.1016/0166-2236(92)90344-8
- Gori, S., Seitz, A. R., Ronconi, L., Franceschini, S., & Facoetti, A. (2016). Multiple causal links between magnocellular–dorsal pathway deficit and developmental dyslexia. Cerebral Cortex, 26(11), 4356–4369. doi: 10.1093/cercor/bhv206
- Gough, P. B., & Tunmer, W. E. (1986). Decoding, reading and reading disability. Remedial and Special Education, 7, 6–10. doi: 10.1177/074193258600700104
- Hansen, P. C., Stein, J. F., Orde, S. R., Winter, J. L., & Talcott, J. B. (2001). Are dyslexics’ visual deficits limited to measures of dorsal stream function? Neuroreport, 12(7), 1527–1530. doi: 10.1097/00001756-200105250-00045
- Hoover, W. A., & Gough, P. B. (1990). The simple view of reading. Reading and Writing, 2(2), 127–160. doi: 10.1007/BF00401799
- Høien, T., & Lundberg, I. (2012). Dysleksi–fra teori til praksis, 5. Utgave. Oslo: Gyldendal akademisk. (ca 300 sider).
- Høien, T., & Tønnesen, G. (1997). Håndbok til ordkjedetesten. Stavanger: Stiftelsen Dysleksiforsking.
- Jacobson, C. (1993). Manual till Ordkedjetestet [ The wordchains test; manual]. Stockholm: Psykologiförlaget.
- Lawton, T. (2016). Improving dorsal stream function in dyslexics by training Figure/ground motion discrimination improves attention, reading fluency, and working memory. Frontiers in Human Neuroscience. doi: 10.3389/fnhum.2016.00397
- Levy, T., Walsh, V., & Lavidor, M. (2010). Dorsal stream modulation of visual word recognition in skilled readers. Vision Research, 50(9), 883–888. doi: 10.1016/j.visres.2010.02.019
- Liberman, I. Y. (1973). 1. Segmentation of the spoken word and reading acquisition. Annals of Dyslexia, 23(1), 64–77.
- Liberman, I. Y., Shankweiler, D., Fischer, F. W., & Carter, B. (1974). Explicit syllable and phoneme segmentation in the young child. Journal of Experimental Child Psychology, 18(2), 201–212. doi: 10.1016/0022-0965(74)90101-5
- Mangano, G. R., Oliveri, M., Turriziani, P., Smirni, D., Zhaoping, L., & Cipolotti, L. (2015). Repetitive transcranial magnetic stimulation over the left parietal cortex facilitates visual search for a letter among its mirror images. Neuropsychologia, 70, 196–205. doi: 10.1016/j.neuropsychologia.2015.03.002
- Martin, A., Kronbichler, M., & Richlan, F. (2016). Dyslexic brain activation abnormalities in deep and shallow orthographies: A meta-analysis of 28 functional neuroimaging studies. Human Brain Mapping, 37(7), 2676–2699. doi: 10.1002/hbm.23202
- Maunsell, J., Nealey, T. A., & DePriest, D. D. (1990). Magnocellular and parvocellular contributions to responses in the middle temporal visual area (MT) of the macaque monkey. The Journal of Neuroscience, 10(10), 3323–3334. doi: 10.1523/JNEUROSCI.10-10-03323.1990
- Melby-Lervåg, M., Lyster, S.-A. H., & Hulme, C. (2012). Phonological skills and their role in learning to read: A meta-analytic review. Psychological Bulletin, 138(2), 322–352. doi: 10.1037/a0026744
- Miller-Guron, L. (1999). Wordchains: A word reading test for all ages. Windsor: NFER-Nelson.
- Milner, D., & Goodale, M. (2006). The visual brain in action (Vol. 27). Oxford: Oxford University Press.
- Mishkin, M., Ungerleider, L. G., & Macko, K. A. (1983). Object vision and spatial vision: Two cortical pathways. Trends in Neurosciences, 6, 414–417. doi: 10.1016/0166-2236(83)90190-X
- Morgan, W. P. (1896). A case of congenital word blindness. British Medical Journal, 2(1871), 1378. doi: 10.1136/bmj.2.1871.1378
- Orton, S. T. (1925). Word-blindness in school children. Archives of Neurology and Psychiatry, 14(5), 581–615. doi: 10.1001/archneurpsyc.1925.02200170002001
- Pammer, K., Lavis, R., Cooper, C., Hansen, P. C., & Cornelissen, P. L. (2005). Symbol-string sensitivity and adult performance in lexical decision. Brain and Language, 94(3), 278–296. doi: 10.1016/j.bandl.2005.01.004
- Pammer, K., Lavis, R., Hansen, P., & Cornelissen, P. L. (2004). Symbol-string sensitivity and children’s reading. Brain and Language, 89(3), 601–610. doi: 10.1016/j.bandl.2004.01.009
- Peterson, R. L., & Pennington, B. F. (2012). Developmental dyslexia. The Lancet, 379(9830), 1997–2007. doi: 10.1016/S0140-6736(12)60198-6
- Pouget, P. (2015). The cortex is in overall control of “voluntary” eye movement. Eye, 29(2), 241–245. doi: 10.1038/eye.2014.284
- Rack, J. P., Snowling, M. J., & Olson, R. K. (1992). The nonword reading deficit in developmental dyslexia: A review. Reading Research Quarterly, 27(1), 29–53. doi: 10.2307/747832
- Ramus, F., & Szenkovits, G. (2008). What phonological deficit? Quarterly Journal of Experimental Psychology, 61(1), 129–141. doi: 10.1080/17470210701508822
- Reilhac, C., Peyrin, C., Démonet, J.-F., & Valdois, S. (2013). Role of the superior parietal lobules in letter-identity processing within strings: FMRI evidence from skilled and dyslexic readers. Neuropsychologia, 51(4), 601–612. doi: 10.1016/j.neuropsychologia.2012.12.010
- Revlin, R. (2012). Cognition: Theory and practice. CA: Worth Publishers.
- Rodrigues, A. P., Rebola, J., Jorge, H., Ribeiro, M. J., Pereira, M., van Asselen, M., & Castelo-Branco, M. (2017). Visual perception and reading: New clues to patterns of dysfunction across multiple visual channels in developmental dyslexia. Investigative Ophthalmology & Visual Science, 58(1), 309–317. doi: 10.1167/iovs.16-20095
- Serrano, F., & Defior, S. (2008). Dyslexia speed problems in a transparent orthography. Annals of Dyslexia, 58(1), 81. doi: 10.1007/s11881-008-0013-6
- Sigmundsson, H., Anholt, S. K., & Talcott, J. B. (2010). Are poor mathematics skills associated with visual deficits in temporal processing? Neuroscience Letters, 469, 248–250. doi: 10.1016/j.neulet.2009.12.005
- Sigmundsson, H., Eriksen, A. D., Ofteland, G. S., & Haga, M. (2017). Letter-sound knowledge: Exploring gender differences in children when they start school regarding knowledge of large letters, small letters, sound large letters, and sound small letters. Frontiers in Psychology. doi: 10.3389/fpsyg.2017.01539
- Sigmundsson, H., Haga, M., Ofteland, G. S., & Solstad, T. (2020). Breaking the reading code: Letter knowledge when children break the reading code the first year in school. New Ideas in Psychology. doi: 10.1016/j.newideapsych.2019.100756
- Sigmundsson, H., Hansen, P., & Talcott, J. (2003). Do “clumsy” children have visual deficits. Behavioural Brain Research, 139(1), 123–129. doi: 10.1016/S0166-4328(02)00110-9
- Snowling, M. J. (1981). Phonemic deficits in developmental dyslexia. Psychological Research, 43(2), 219–234. doi: 10.1007/BF00309831
- Snowling, M. J. (2001). From language to reading and dyslexia. Dyslexia, 7(1), 37–46. doi: 10.1002/dys.185
- Snowling, M. J. (2014). Dyslexia: A language learning impairment. Journal of the British Academy, 2(1), 43–58.
- Stanovich, K. E. (1988). Explaining the differences between the dyslexic and the garden-variety poor reader: The phonological-core variable-difference model. Journal of Learning Disabilities, 21(10), 590–604. doi: 10.1177/002221948802101003
- Stein, J. (2019). The current status of the magnocellular theory of developmental dyslexia. Neuropsychologia, 130, 66–77. doi: 10.1016/j.neuropsychologia.2018.03.022
- Stein, J., & Walsh, V. (1997). To see but not to read; the magnocellular theory of dyslexia. Trends in Neurosciences, 20(4), 147–152. doi: 10.1016/S0166-2236(96)01005-3
- Talcott, J. B., Gram, A., Van Ingelghem, M., Witton, C., Stein, J. F., & Toennessen, F. E. (2003). Impaired sensitivity to dynamic stimuli in poor readers of a regular orthography. Brain and Language, 87(2), 259–266. doi: 10.1016/S0093-934X(03)00105-6
- Talcott, J. B., Witton, C., Hebb, G. S., Stoodley, C. J., Westwood, E. A., France, S. J., … Stein, J. F. (2002). On the relationship between dynamic visual and auditory processing and literacy skills; results from a large primary-school study. Dyslexia, 8(4), 204–225. doi: 10.1002/dys.224
- Talcott, J. B., Witton, C., McLean, M. F., Hansen, P. C., Rees, A., Green, G. G., & Stein, J. F. (2000). Dynamic sensory sensitivity and children’s word decoding skills. Proceedings of the National Academy of Sciences, 97(6), 2952–2957. doi: 10.1073/pnas.040546597
- Taylor, C. M., Olulade, O. A., Luetje, M. M., & Eden, G. F. (2018). An fMRI study of coherent visual motion processing in children and adults. NeuroImage, 173, 223–239. doi: 10.1016/j.neuroimage.2018.02.001
- Ungerleider, L. G., & Mishkin, M. (1982). Two cortical visual systems. In D. J. Ingle, M. A. Goodale, & R. J. W. Mansfield (Eds.), The analysis of visual behavior (pp. 549–586). Cambridge: MIT press.
- Van der Mark, S., Bucher, K., Maurer, U., Schulz, E., Brem, S., Buckelmüller, J., … Martin, E. (2009). Children with dyslexia lack multiple specializations along the visual word-form (VWF) system. NeuroImage, 47(4), 1940–1949. doi: 10.1016/j.neuroimage.2009.05.021
- Verhoeven, L. (2011). Second language reading acquisition. In M. Kamil, P. D. Pearson, E. Moje, & P. Afferbach (Eds.), Handbook of reading research (Vol. IV, pp. 661–683). New York: Routledge.
- Vidyasagar, T. R., & Pammer, K. (2010). Dyslexia: A deficit in visuo-spatial attention, not in phonological processing. Trends in Cognitive Sciences, 14(2), 57–63. doi: 10.1016/j.tics.2009.12.003
- Wold, B. H. (2016). App for early detection of dyslexia (Master). NTNU, Trondheim.
- Wold, B. H., Krogstie, J., & Sigmundsson, H. (2016). App for early detection of dyslexia – Implementation and ongoing evaluation. NOKOBIT – Norsk konferanse for organisasjoners bruk av informasjonsteknologi 2016.
- World Health Organization. (1992). The ICD-10 classification of mental and behavioural disorders: Clinical descriptions and diagnostic guidelines. Geneva: Author.