
ABSTRACT
Even though the importance of extensive reading practice is well documented, as are students’ changing leisure-time reading habits, knowledge of how much students read at school is still limited. Therefore, this study investigates how many pages of continuous text, nonfiction as well as fiction, students in middle (Grades 4–6) and lower secondary (Grades 7–9) school read during an ordinary school day. Comparing data from two large-scale surveys, in 2007 and 2017, our analyses indicate that the proportion of students who read one full page or more has decreased significantly. More students in middle school compared to lower secondary still read nonfiction, whereas the reading of fiction is now equally low. We conclude that the growing achievement gap among Swedish students on reading literacy tests is mirrored in the widening divide between students who still read extensively at school and those who do not read at all.
Introduction
There are three main developments in contemporary Swedish society which lie behind the present study’s focus on the amount of school-related reading taking place in compulsory school. Firstly, reading comprehension among students in Swedish compulsory school has decreased since the turn of the century according to large international knowledge tests like Progress in International Reading Literacy Study (PIRLS), and Programme for International Student Assessment (PISA). Even though the former concerns students in Grade 4 (10-year-olds in Sweden) and the latter students who are 15 years old (Grade 9 in Sweden), both studies show a similar trend when it comes to first-language reading competence. From a position clearly above OECD-average in PIRLS 2001, performance among Swedish fourth graders fell to average in 2011 and then increased to just above average again in 2016, even though results are not fully on par with 2001 (Skolverket, Citation2017). Likewise, PISA-results show that Swedish 15-year-olds have followed a similar pattern of a decrease from the turn of the century. Despite partial recoveries in 2015 and 2018, results are still significantly lower than those in 2000. The most striking trend, however, is the growing gap between low- and high-achieving Swedish students. In 2000 13% of the students were low performers who scored below level 2, indicating they have not reached “the point at which they have acquired the technical skills to read, and can learn from reading” (Schleicher, Citation2019, p. 17), while 11% performed at level 5 or above, indicating top-level skills. In 2018 these figures have increased to 18% and 13% respectively (Skolverket, Citation2019), indicating an increasing achievement gap.
Secondly, during the past two decades, it has also become increasingly clear that there is a general connection between students’ socioeconomic background and their school performance, even if this has been known for much longer (Broer et al., Citation2019; Coleman et al., Citation1966; OECD, Citation2017; Skolverket, Citation2009, Citation2016, Citation2017; White, Citation1982; Yang Hansen et al., Citation2011). In combination with growing school segregation (Östh et al., Citation2013; Skolverket, Citation2018; Yang Hansen & Gustafsson, Citation2016), this development has led to an increased inequality which has become particularly visible in Swedish secondary school in comparison to other “rich countries” (UNICEF, Citation2018), thus highlighting the importance of school’s compensatory mission to ensure equal opportunities.
Thirdly, during this very same period reading habits among Swedish children and teenagers have changed steadily as new digital screen media have taken over their attention. Only between 2012 and 2018 the proportion of 15-year-olds who say they read books or newspapers daily has dropped from 21 to 9 percent (Statens medieråd, Citation2019), whereas the figure for 12-year-olds have stayed almost the same (from 26% to 24%). Even though 94% of 12-year-olds and 98% of 15-year-olds in Sweden have their own smartphone with internet access, the reading of continuous text is not what they are used for; and playing screen games does not make up for lack of reading (Lieury et al., Citation2016).
At the same time as we have witnessed these developments, we know from previous research that the amount of reading is of vital importance for the development of students’ reading ability (Allington, Citation2013; Cunningham & Stanovich, Citation1997; Kuhn et al., Citation2010; Rasinski et al., Citation2005; Taylor et al., Citation1990; Topping et al., Citation2007), which, in turn, is decisive for their success, not only in school but also in life more generally (Cunningham & Stanovich, Citation1998; European Commission, Citation2012; Krashen, Citation2009). Moreover, high levels of literacy are not only important for the individual to thrive; to sustain a democratic society, its citizens need to go beyond learning how to read and become practicing readers who can engage critically with different types of texts (Morais, Citation2018).
Although the importance of school-based reading practice is well known, we still have very limited knowledge of the extent of student reading in Swedish school. As of today, we have not been able to find any large-scale studies that have sought to measure the actual amount of reading of continuous text that students undertake as part of their schoolwork during an ordinary day. Therefore, the purpose of the present study is to investigate how much reading of continuous text actually takes place in Swedish compulsory school. More specifically, the study compares results from two large-scale surveys, one in 2007 and one in 2017, in order to investigate what trends can be seen concerning the extent of students’ reading of continuous text, nonfiction as well as fiction, in Swedish middle (Grades 4–6) and lower secondary (Grades 7–9) school.
Literature Review
How much (amount, frequency or duration) students read at school is not as well-investigated as the extent of their leisure-time reading. Studies of school-related reading habits most often focus on the kinds of text media used, types of text read, and frequency of reading. When it comes to large-scale studies with trends included, the context for an individual’s reading habits most often concerns out-of-school reading (e.g., Anderson et al., Citation1988; Guthrie et al., Citation1995; Senechal & LeFevre, Citation2002).
However, from the PIRLS studies we have some knowledge of the main trends in school-related reading practices in Grade 4. In a ten-year perspective, comparing results from PIRLS 2006 and PIRLS 2016, there is a clear trend of less time spent on reading instruction, including reading across the curriculum, in all three Scandinavian countries participating in both these studies (Mullis et al., Citation2007, Citation2017). The total of instructional time spent on reading dropped from 17% to 12% in Sweden, from 21% to 13% in Denmark, and from 30% to 17% in Norway, compared to the international average which went from 20% to 18%. Moreover, according to Swedish teachers in the PIRLS studies, the reading of shorter texts has increased slightly at the expense of longer texts between 2006 and 2016. In PISA, concerning 15-year-old students’ reading, no equivalent data is available for the school context.
When searching for international studies on the amount of school-related reading we found only a few studies related to the present study. These international studies all report a small amount of reading practice in middle and secondary schools. Swanson et al. (Citation2016) studied reading among middle and high-school students in Social studies and Language arts classrooms in the USA and found that students were engaged in text reading in Social studies 10.4% of the time, while the corresponding percentage for English language arts classrooms was 14.8%. These findings are thus similar to the above-mentioned Swedish results in PIRLS 2016 (Mullis et al., Citation2017).
Results from the 1980s showed that silent reading in middle school occupied students between 8 and 15 minutes per day (Greenwood et al., Citation1981; Ysseldyke & Algozzine, Citation1982) and that only 10 minutes of a one-hour reading lesson was actually spent on reading (Kurth & Kurth, Citation1987). Similarly, Taylor et al. (Citation1990) found that students read on average 15.8 minutes during a 50-minute reading class. In a large-scale study, Topping and Paul (Citation1999) measured over 659,000 K-12 students’ literature-based reading practice from 13,000 schools all over the USA during one school year. They found that students’ amount of reading was very low and that on average the amount of literature-based reading practice increased until the sixth grade and then dropped to half as students reached nineth grade.
In a more contemporary survey study involving 520 Australian students between 13 and 16 years, Merga (Citation2018) found that a majority of students in Grade 8 (65%) experienced silent reading, but only 13% of the students still had a regular silent reading period at school when they reached Grade 10. A similar pattern can be discerned in a Swedish interview study with 259 students in Grade 6 and Grade 9. A majority of students in Grade 6 report that they have a book for independent reading at school in which they read silently for about 20 minutes every day or every other day, while none of the students in Grade 9 mention such a book (Alatalo et al., Citationin progress).
Taken together, the few previous studies that have been published on the amount and extent of in-school reading practice in middle and lower secondary (junior high) school indicate: (1) that students who are engaged in some kind of daily (or weekly) sustained silent reading practice on average spend some 10–15 minutes actually reading; and (2) that usually after middle school (when students are about 12 years old) the time spent reading in class steadily decreases. However, what we do not know from previous research is: (1) what proportion of students that read one or more pages of continuous text during a regular school day, and what proportion that do not read one full page; (2) whether that reading consists of mainly fiction or nonfiction; and (3), how these school-related reading practices have developed over the past decade.
The Present Study
In this study, we compare results from two large-scale studies on students’ school-related reading in middle school and lower secondary school, one conducted in 2007 and the other in 2017. The main purpose of the study is to investigate trends between 2007 and 2017 concerning the extent of student’s reading of continuous text, nonfiction as well as fiction. To fulfil the purpose of the study, the following research question is addressed: What differences are there between the 2007 and 2017 cohorts in terms of students’ amount of reading in middle school and lower secondary school? Separate analyses are made for nonfiction reading and fiction reading when tracing trends both within and between the two school levels.
The results presented in this study are based on two surveys where the students were asked to answer anonymous questions about the number of whole pages of continuous nonfiction and fiction text they had read during lessons on an ordinary school day, when the regular schedule was not interrupted by other activities.
The Swedish School System
Swedish compulsory school consists of Grades 1–9 and starts the year students turn seven, with the option to start a year earlier or later. Since 2018 a one-year preschool class has also become obligatory. Compulsory school, in turn, is divided into Grades 1–3, Grades 4–6 and Grades 7–9. Since the early 1990s, Sweden has a system of both municipal and independent schools which are fully funded through a public voucher system. The independent schools have full autonomy to allocate other resources and to make a profit as long as they conform to national school regulations. Around the same time a system of “free school choice” was introduced. In 2007 9% of all students in compulsory school attended independent schools; in 2017 the proportion had risen to 15% (Skolverket, Citationn.d.a).
Method
Participants
The 2007 investigation was carried out among whole bodies of student populations in two different grades in one of Sweden’s largest municipalities with schools in both densely populated centres and in rural areas and with different socioeconomic settings. The municipal director of education gave permission for the investigation to encompass all students in Grade 5 and Grade 8. All students in those grades who attended school on the day of the questionnaire were invited to take part in the investigation. Grade 5 was chosen because it could be expected that by then all the students would have had at least two years in the middle school and then also a broader experience of both fiction and nonfiction. At the time of the investigation Grade 5 was also a milestone in the curriculum when students were expected to have reached certain goals and were tested on national level. Grade 8 was chosen to reach a group of older students who were in their second year of lower secondary school.
The results from the 2007 study are based on responses from a total of 1526 students, 698 (50% female, 0.1% unknown) in Grade 5 and 828 (51% female, 0.4% unknown) in Grade 8. The non-completion rate was 3.8% among the students in the participating classes, which roughly corresponds to the average proportion of students absent because of sick-leave and other personal reasons. The few students who chose not to participate were concentrated in a few classes. The non-completion rate is therefore considered not to have had any major influence on the results. There were 92 classes involved in the study from 40 different schools in the municipality. The students in Grade 5 were in 49 classes and the students in Grade 8 were in 43 classes.
In the 2017 study, the investigation was carried out after the directors (or corresponding) of 199 public and independent school units in 18 municipalities in mid-Sweden had given their consent to let the students in Grade 6 and Grade 9 in their school district take part in the project by answering a web-based survey at the end of an ordinary school day. Grade 6 was chosen instead of Grade 5 since that is now the year when national tests are conducted. Such tests are also mandatory for Grade 9, which was the reason for also choosing this grade. The participants who completed the questionnaire came from 144 schools. Two-sided independent sample t-tests indicate that there were no significant differences between these schools and the 55 that did not participate, concerning socioeconomic and academic aspects (Skolverket, Citationn.d.b), shown in .
Table 1. Statistics from t-test of differences between schools in the 2017 cohort that participated (A) and schools that that opted out of participation (B).
A total of 3308 students remained after data was screened for questionable responses, 1704 in Grade 6 (48.6% females, 1.5% unknown) and 1604 in Grade 9 (51.7% females, 1.8% unknown). In total 2.9% of the surveys submitted were removed from the dataset, which we considered to be without major influence on the result and therefore acceptable.
The 2007 and 2017 cohorts show only minor differences in terms of academic and socioeconomic context, except the proportion of students with foreign background, as illustrated in (Skolverket, Citationn.d.b). The differences in proportions of students with foreign background between 2007 and 2017 reflect the demographic development in Sweden at large during this ten-year period.
Table 2. Description of the 2007 and 2017 cohorts, compared to the national average.
Data Collection
To make sure that the questionnaires would be answered on an ordinary school day, the schools could choose which day in a certain week the students were to conduct the survey. All principals were gathered to a meeting for personal instructions by the researchers. Written instructions were thereafter distributed to the principals who, in turn, informed the teachers in detail on how to instruct the students. In the 2007 study, students completed a paper-and-pen questionnaire, while the questionnaire was web-based in the 2017 study. The following question and instructions were used in both the 2007 and the 2017 survey: How many pages of continuous text have you read during class today?
– Add up all whole pages that you have read, in books, on the internet, or from other sources.
– Only include text related to schoolwork.
– Do not include parts of pages read here and there.
The students were asked to specify the number of pages for nonfiction and fiction and for each subject separately.
The questionnaires were distributed to the students at the end of the chosen school day by the teacher who was teaching that lesson. The teachers were instructed to inform the students about the purpose of the study and that their participation was voluntary. They were also instructed to explain to the students what was meant by “continuous” text in the context of the study. It was defined as “whole bodies of text consisting of complete and consecutive sentences where the content is linked together as a whole”, thus excluding short text fragments taken from different parts of the text. Furthermore, the students were to be informed that text with embedded pictures, where text and pictures form a unit, was also to be counted as continuous text. Fiction was explained as narratives, often made-up stories, while nonfiction was explained as informational texts. Students were instructed to estimate the total number of pages read from any reading source, including for example textbooks, handouts, newspapers, texts on the Internet, or other print or digital sources, in any subject. According to pilot studies conducted before both surveys, completing the questionnaire took approximately 10–15 minutes including the information and instructions from the teacher.
Data Analysis
Tests of the significance of differences between grades and cohorts (2007 and 2017) regarding the total number of pages read on the day of the survey were made by independent samples t-tests in SPSS. Histograms were produced to visualise the reading patterns among students, that is, the proportion of students who had read 0 pages, 1–2 pages, 3–4 pages, 5–9 pages, 10–19 pages, and more than 19 pages, respectively. These bins of reading amount are hereafter termed reading groups. As students’ responses could not be considered independent, Chi-square analyses with complex samples in SPSS were used for analysing overall differences in the distributions among these reading groups between grades and cohorts. This analysis produces a variant of the second-order Rao-Scott adjusted Chi-square statistic (Rao & Scott, Citation1984; Thomas & Decady, Citation2004) to accommodate the fact that students are clustered in classes. The significance levels produced by this analysis are based on an adjusted F-test, which are the statistics reported in this paper. In the analyses, students were clustered according to a composite variable comprising school and class belonging.
Because generalised linear modelling with complex samples generated non-normally distributed residuals, we instead used the Spearman rank-order correlation test to give an indication of the magnitude of the correlation between the amount of nonfiction and fiction the students read. The test was performed for the students in the respective grades in the 2007 and 2017 cohorts.
Ethical Considerations
Before the study was launched, informed consent was ensured from the local school authorities of each of the participating municipalities. Next, all principals and teachers of the classes involved were informed about the project and asked to participate and to allot time from their teaching for the completion of a questionnaire among their students. All students in Grades 5 and 8 in the 2007 study and all students in Grades 6 and 9 in the 2017 study who attended school on the day chosen for the investigation were invited to take part in the project. The students and their parents (or legal guardians) were informed about the aim of the project, about the research methods, that participation would be anonymous and voluntary, and of their right to decline or cease participation at any time. The questions asked were considered to be of the kind that did not expose the students to any harm.
Results
The Reading of Nonfiction in Middle School
The group of students that did not read any continuous text at all on the day of the investigation (labelled zero-readers) was found to make up 22% of the students in middle school in the 2007 study, as can be seen in , which means that a little more than one fifth of all students did not read a single whole page of continuous nonfiction text during an ordinary school day.
Figure 1. The proportion of students grouped according to the number of pages of nonfiction read in middle school in 2007 and 2017.
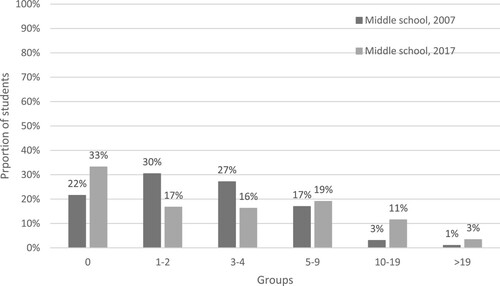
Ten years later the group of zero-readers in middle school made up 33% of the student population, which means that the proportion of zero-readers has increased with more than half its size over this decade. It can also be noticed that the proportion of readers of 1–4 pages dropped by almost half from 57% in 2007 to 33% in 2017. However, the trend is the opposite when it comes to reading more than four pages; the proportion of students reading five or more whole pages of continuous nonfiction text increased from 21% in 2007 to 33% in 2017. These results thus indicate that the gap has widened between students who do not read any or very little continuous nonfiction and those who read more extensively. This expanding gap is corroborated when we compare the average number of pages read by the students in the two cohorts. In 2007 the average number of pages of nonfiction text read was 3.93 (SD = 3.64), and in 2017 it had increased to 6.10 (SD = 7.38), despite the larger proportion of zero-readers. As also indicated by the more than doubled standard deviation figure, the practices of nonfiction reading in middle school have become much more unequal over this ten-year period. The overall difference in distribution among the reading groups between the two cohorts was statistically significant, F(3.097, 801.010) = 5.529; p < .001.
The Reading of Nonfiction in Lower Secondary School
As can be seen in , the proportion of zero-readers of nonfiction in lower secondary school increased by more than half over this ten-year period, from 33% to 50%. Similar to the younger students, the proportion of readers who read 1–4 pages decreased significantly, from 43% to 24%, while the groups reading 5–9 pages and 10–19 pages stayed about the same. The group of students reading more than 19 pages remained small, even though proportionally it increased from 1% to 3%.
Figure 2. The proportion of students grouped according to the number of pages of nonfiction read in lower secondary school in 2007 and 2017.
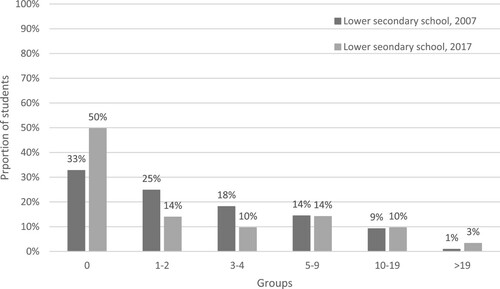
The large increase of zero-readers and the comparatively smaller proportions of students reading 1–4 pages, in combination with the increase of the small group of 19-plus readers, indicate a more polarised pattern in 2017 compared to 2007, although not as strong as in middle school. This increased polarisation among students in lower secondary school is also evidenced by the fact that, in spite of the growing group of zero-readers, the average number of pages of nonfiction text read increased from 4.43 (SD = 4.41) in the 2007 cohort to 6.27 (SD = 7.38) in the 2017 cohort, mostly because of the larger proportion of students reading more than 19 pages. Also here the difference in distributions between the 2007 and the 2017 cohorts was statistically significant F(3.425, 589.125) = 5.507; p = .001.
The Reading of Fiction in Middle School
As illustrated in , the proportion of zero-readers almost doubled from 44% in 2007 to 81% in 2017, while the proportion of students who read five pages or more of fiction dropped to less than a fifth of its size ten years earlier, from 44% to 8%.
Figure 3. The proportion of students grouped according to the number of pages of fiction read in middle school in 2007 and 2017.
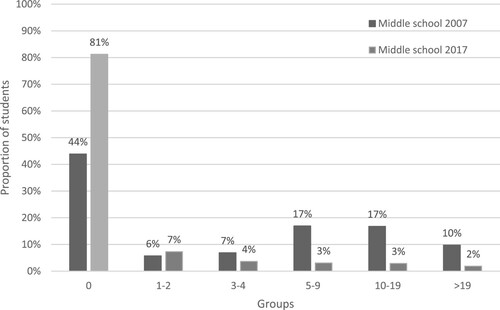
It was only the groups of students reading 1–4 pages that remained roughly the same, with relatively few readers in both cohorts. Consequently, the clear polarisation in fiction reading among middle-school students in 2007 almost disappears in 2017, as a very small proportion of students (12%) still read more than two whole pages. In contrast to the reading of nonfiction, the average number of pages of fiction read in middle school thus dropped from 12.26 (SD = 13.31) in 2007 to 6.65 (SD = 10.50) in 2017. The distributions among the groups of readers differed significantly between the 2007 and the 2017 cohorts F(3.336, 683.861) = 28.179; p < .001.
The Reading of Fiction in Lower Secondary School
As indicated in , the proportion of zero-readers of fiction in lower secondary school was 62% in the 2007 cohort compared to 87% in the 2017 cohort, an increase of more than a third. Whereas the group of students reading 1–4 pages remained the same (7%), the proportion of students reading 5 pages or more of continuous fiction dropped to less than a quarter of its earlier size, from representing a total of 31% of the student population in the 2007 cohort to only 6% in the 2017 cohort.
Figure 4. The proportion of students grouped according to the number of pages of fiction read in lower secondary school in 2007 and 2017.
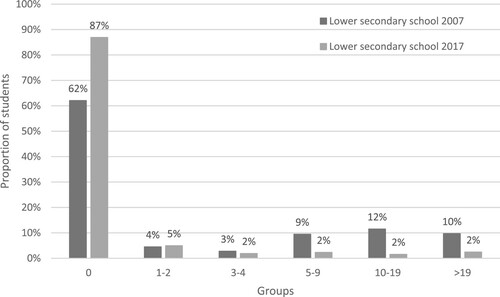
The overall picture for fiction reading in lower secondary school in 2017 is one where almost nine out of ten students do not even read one full page of continuous text during an ordinary school day. Consequently, the polarisation between students who do not read at all and those who read five pages or more, which was clearly noticed in 2007, disappears almost completely in 2017. Similar to the case in middle school, the average number of pages of fiction read thus dropped from 13.32 (SD = 11.40) in the 2007 cohort to 7.51 (SD = 15.66) in the 2017 cohort, as the proportion of students reading five pages or more dwindled to less than a quarter of its earlier size. The reading of fiction in the 2007 and the 2017 cohorts differed significantly in their distributions, F(2.712, 466.501) = 18.312; p < .001.
The Reading of Nonfiction – a Comparison Between Middle School and Lower Secondary School
As illustrated in , the relation between middle school and lower secondary school concerning the reading of nonfiction remains basically the same in the 2017 cohort compared to that of 2007. That is, there is a notably higher proportion of zero-readers in upper secondary school compared to middle school, whereas the distribution is the opposite in the groups reading 1–9 pages, with proportionally fewer students in lower secondary school. However, when it comes to students reading 10–19 pages, the two cohorts differ; in 2007 this group was larger in lower secondary school compared to middle school, whereas in 2017 the relation is the opposite due to an increase of students in middle school reading 10–19 pages.
Figure 5. The proportion of students grouped according to the number of pages of nonfiction read in middle school compared to lower secondary school in 2007 and 2017.
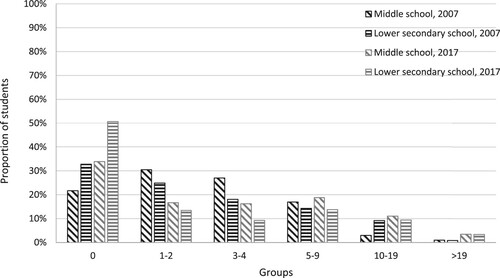
Although the overall relationship between reading patterns in middle school compared to those in lower secondary school remains basically the same, with a smaller proportion of students reading nonfiction in lower secondary school compared to middle school, the general trend is clear: the reading of continuous nonfiction has decreased significantly between 2007 and 2017 among the large group of students reading 1–4 pages, in middle as well as lower secondary school. The distribution among reading groups does not differ significantly between middle school and lower secondary school in the 2007 cohort, F(3.891, 354.102) = 2.239; p = .066, while the difference is highly significant in the 2017 cohort, F(4.091, 1157.822) = 4.091; p <.001.
The Reading of Fiction – a Comparison Between Middle School and Lower Secondary School
As illustrated in , also when it comes to the reading of fiction do the two cohorts exhibit a similar relative relation between middle and lower secondary school; the proportion of zero-readers is significantly higher in lower secondary school compared to middle school, while the proportion of students who do read one or more pages of fiction is higher in middle school, with the exception of those reading 19 pages or more who behave similarly across the school stages.
Figure 6. The proportion of students grouped according to the number of pages of fiction read in middle school compared to lower secondary school in 2007 and 2017.
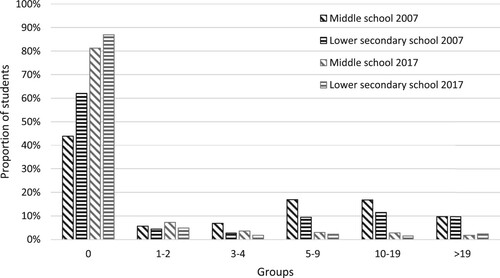
However, when we look at how the differences in fiction reading between the two school stages have developed over this ten-year period, we see some clear trends. The large differences in reading patterns between middle and lower secondary school almost disappears over this ten-year period. From a situation where middle-school students read significantly more fiction than those in lower secondary school, we now have a situation where more than eight out of ten students, at both school stages, do not even read one full page on an ordinary school day. The distribution among reading groups are significantly different between middle school and lower secondary school in the 2007 cohort, F(2.488, 226.417) = 3.204; p = .032, but not in the 2017 cohort, F(3.471, 982.232) = 2.284; p = .068.
The Correlation Between Nonfiction and Fiction Reading
The amount of nonfiction individual students read show a weak positive correlation with the amount of fiction they read in the 2007 cohort, (Grade 5: ρ = .080, p < .001 and Grade 8: ρ = .100, p = .004) and in the 2017 cohort (Grade 6: ρ = .245, p < .001 and Grade 9: ρ = .265, p < .001). We found no support that students who read no or few pages of nonfiction in general compensate for this by reading more fiction. For example, in the 2007 and 2017 cohorts, 46% and 94% respectively of the zero-readers of nonfiction in middle school, and 69% and 95% respectively in lower secondary school, did not read any whole page of fiction either. Students who read many pages (≥10) of nonfiction read relatively more fiction than zero-readers. In middle school 89% (2007) and 29% (2017) of the ≥10-readers read fiction compared to 49% and 30% respectively of the zero-readers. In lower secondary school 54% (2007) and 6% (2017) of the ≥10-readers read fiction compared to 31% and 5% respectively of the zero-readers.
Discussion
The study shows a school where a majority of the of students do not read one whole page or only a few pages of continuous nonfiction or fiction during a regular school day. Our results point in the same direction as previous studies, indicating that most students only engage in reading for a short moment once a day or week as part of their school work (Kurth & Kurth, Citation1987; Taylor et al., Citation1990; Ysseldyke & Algozzine, Citation1982). In our study, this overall pattern was the same for nonfiction and for fiction, and for middle and lower secondary school, even though there are still relatively more students reading in middle school. That students tend to read less in secondary school is in line with the findings of other researchers (Merga, Citation2018; Topping & Paul, Citation1999). But as our results indicate, the reading patterns of middle-school students are starting to look more like those in lower-secondary school.
An important contribution of this study is that it measures the actual number of pages of continuous fiction and nonfiction text students read at school across the whole curriculum, in contrast to previous studies which either measured the amount of time students spend on reading activities, or focused on specific school subjects. Another contribution is that our study measures students’, rather than their teachers’, estimates of the extent of school-related reading, thus measuring what students indicate they have done, rather than what they were supposed to do.
A clear trend from 2007 to 2017 is that the proportion of students, both in middle and lower secondary school, who do not read even one full page of continuous text during a regular school day has increased considerably. This trend of more zero-readers applies for both nonfiction and fiction, even though the trend is strongest for fiction in middle school. In other words, the younger students now follow the same in-school reading pattern as the older students. In a recent study by the Swedish Media Council a similar trend of media habits among Swedish adolescents was discovered, concluding that “13 has become the new 16” (Statens medieråd, Citation2019, p. 8).
At first sight, our results might appear to be contradictory to the trend of virtually unchanged amounts of time Swedish students spend reading in middle school according to a recent study of PIRLS 2006–2016 (Mullis et al., Citation2017), as well as the trend of rising reading literacy among 15-year-olds according to PISA 2018 (OECD, Citation2019). The difference in relation to PIRLS, however, is that whereas we have measured students’ reading of continuous texts of a page or more, PIRLS includes the reading of any type of text regardless of length. Moreover, while our study is based on students’ estimates, PIRLS bases its data on teachers’ estimates. As previous research has shown, students may spend as little as 10 minutes actually reading during a one-hour reading lesson (Kurth & Kurth, Citation1987; Taylor et al., Citation1990; Ysseldyke & Algozzine, Citation1982). Similarly, in contrast to PISA, which measures students’ ability to understand and use text, our study focuses on the amount of text students read. In other words, whereas PISA measures students’ reading proficiency as such, we have measured the necessary prerequisites for developing such a reading proficiency. But how can Swedish 15-year-olds improve their reading literacy at the same time as they read less, both in their spare time and at school? The explanation for this apparent contradiction, we argue, is twofold.
Firstly, the latest PISA results for reading literacy can only be interpreted as an upward trend if the focus is on students’ average results. If, however, one looks at the proportions of students achieving different levels of proficiency, another pattern, much more consistent with our results, emerges. In fact, although the 2018 PISA study shows that the proportion of high-achieving students (above level 4) has increased from 11% in 2000 to 13% in 2018, the proportion of low-achieving students (below level 2) increased much more, from 13% to 18% (Skolverket, Citation2019). This widening achievement gap is consistent with the trend of increased polarisation of students’ nonfiction reading, both in middle and lower secondary school, observed in our study.
Secondly, and as our study shows, not all students read less. If we, like many interpreters of PISA, were to base our conclusions on students’ average number of pages read, we would see a similar rise in the reading of nonfiction, and a much smaller decline in fiction. These apparently conflicting results, however, are explained by the small proportion of students reading a large number of pages. Consequently, even though we observed a significantly larger proportion of students who did not read at all in the 2017 cohort, the average number of pages could still rise. Our study thus points toward the problem of focusing solely on average numbers when drawing conclusions. Therefore, the clear trend of a growing divide between the relatively small group of students who still read extensively at school and the much larger group who do not read at all, highlighted in our study, is fully consistent with the growing achievement gap among Swedish students’ reading literacy observed in studies like PIRLS and PISA.
Limitations
The selection of schools for the different cohorts is not the same in the two surveys, which may have had some bearing on the outcome. However, the high number of participants together with the similar demographic setup of the two populations vouch for the validity of our results. Still, some differences between the two survey populations and between these and the national average deserve further comments. The fact that the proportion of students with foreign background in the 2007 cohort (9%) was less than half of that in the 2017 cohort (22%) does not reflect geographical differences as much as the general demographic development in Sweden during these ten years. The proportion of students with foreign background was very similar (9% and 10%) in the two different regions when these data first were put on record in 2009 (Skolverket, Citationn.d.b). Moreover, that the decrease in the amount of school-related reading over this ten-year period could be explained by the relatively larger proportion of students with foreign background in 2017 is contradicted by the facts that the average merit points in Grade 9, the proportion of students in Grade 9 meeting the minimum requirements in all subjects, and the proportion of students with at least one parent with post-secondary education, are all very similar in the two cohorts. Moreover, if the proportion of students with foreign background were of importance to the number of pages read at school, our results based on the 2017 cohort would rather be too positive, as the average proportion of students with foreign background is even higher in Sweden as a whole. The same can be said about the result based on the 2007 cohort, where the proportion of students with foreign background was only half compared to the national average.
That the two surveys were conducted with students from different grades, 5/6 and 8/9, is another limitation. Our results would have been more precise had we chosen the same grades to represent the different school stages. Still, the same interval of three years between the two stages in combination with the unambiguous results convince us that this minor grade difference has had no significant impact on the general trend discovered.
Asking students to estimate their reading amount may have given rise to some overestimation of the actual number of pages read, since self-reported data might reflect wishes rather than fact (McNamara, Citation2011). Another source of overestimation could be that schools themselves chose which day of the week to conduct the survey. It is therefore quite likely that students’ actual amount of school reading is even lower than our measurements indicate.
Another objection that could be raised against the results presented in this study is that they do not consider school-related reading done as homework. In the 2017 survey such questions were asked; still, the proportion of zero-readers was not considerably reduced when homework reading was included in the analyses (zero-readers decreased from 34% to 30% in Grade 6 and from 51% to 48 in Grade 9).
Concluding Remarks and Future Directions for Research
The conclusions we can draw from our study in the light of previous research is that Sweden has a compulsory school system that does not manage to ensure equal opportunities for students to develop their reading literacy in middle and lower secondary school. On the contrary, the trend is that students’ changing leisure-time media habits are mirrored by an equally diminishing amount of school-related reading, resulting in a drastic decrease in young people’s engagement with long and continuous texts.
The reasons behind this trend need to be examined more closely in relation to recent changes in the Swedish school system, such as “free school choice” and an increasing proportion of students attending independent schools (from 4% in 2000 to 15% in 2018; Skolverket, Citationn.d.c). It could be further investigated how the increased school segregation in Sweden (Skolverket, Citation2018) is reflected in the schools in our two cohorts and in relation to our results. The impact of factors such as more and earlier national tests, the shift from print to more digital platforms, and the decreasing proportion of qualified teachers also need to be examined. We can only speculate about the long-term consequences for democratic and highly literate societies like Sweden if this trend of decreased reading practices is allowed to continue.
Disclosure Statement
No potential conflict of interest was reported by the author(s).
Additional information
Funding
References
- Alatalo, T., Tegmark, M., Winberg, M., & Vinterek, M. (in progress). What makes students read at school? The relation between students’ reader self-concept and their views on reading practices in in Grades 6 and 9. Journal of Research in Reading.
- Allington, R. L. (2013). What really matters when working with struggling readers. The Reading Teacher, 66(7), 520–530. https://doi.org/10.1002/TRTR.1154
- Anderson, R. C., Wilson, P. T., & Fielding, L. G. (1988). Growth in reading and how children spend their time outside of school. Reading Research Quarterly, 23(3), 285–303. https://doi.org/10.1598/RRQ.23.3.2
- Broer, M., Bai, Y., & Fonseca, F. (2019). Socioeconomic inequality and Educational Outcomes: Evidence from Twenty years of TIMSS. IEA research for education (A Series of In-depth analyses based on data of the international Association for the Evaluation of Educational achievement (IEA), vol 5. Springer.
- Coleman, J. S., Campbell, E., Hobson, C., McPartland, J., Mood, A., & Weinfeld, F. (1966). Equality of educational opportunity. United States Department of Health, Education, and Welfare. https://files.eric.ed.gov/fulltext/ED012275.pdf
- Cunningham, A. E., & Stanovich, K. E. (1997). Early reading acquisition and its relation to reading experience and ability 10 years later. Developmental Psychology, 33(6), 934–945. https://doi.org/10.1037/0012-1649.33.6.934
- Cunningham, A. E., & Stanovich, K. E. (1998). What reading does for the mind. American Educator, 22(1-2), 8–15.
- European Commission. (2012). EU high level group of experts on literacy: Final Report https://ukla.org/downloads/LITERACY_FINAL_REPORT_v_9.pdf
- Greenwood, C. R., Delquadri, J., & Hall, R. V. (1981). Code for instructional structure and student academic response. Juniper gardens children’s project. Bureau of child research, University of Kansas.
- Guthrie, J. T., Schafer, W., Wang, Y. Y., & Afflerbach, P. (1995). Relationships of instruction to amount of reading: An exploration of social, cognitive, and instructional connections. Reading Research Quarterly, 30(1), 8–25. https://doi.org/10.2307/747742
- Krashen, S. (2009). Anything but reading. Knowledge Quest, 37(5), 18–25.
- Kuhn, M. R., Schwanenflugel, P. J., Meisinger, E. B., Levy, B. A., & Rasinski, T. V. (2010). Aligning theory and assessment of reading fluency: Automaticity, prosody, and definitions of fluency. Reading Research Quarterly, 45(2), 230–251. https://doi.org/10.1598/RRQ.45.2.4
- Kurth, R., & Kurth, L. (1987). The use of time in formal reading instruction in elementary schools [Paper presentation]. At the annual meeting of the American Educational research Association, April 20–24, Washington DC. (ERIC ED281158)
- Lieury, A., Lorant, S., Trosseille, B., Champault, F., & Vourc’h, R. (2016). Video games vs. Reading and school/cognitive performances: A study on 27000 middle school teenagers. Educational Psychology, 36(9), 1560–1595. https://doi.org/10.1080/01443410.2014.923556
- McNamara, D. S. (2011). Measuring deep, reflective comprehension and learning strategies: Challenges and successes. Metacognition and Learning, 6(2), 195–203. https://doi.org/10.1007/s11409-011-9082-8
- Merga, M. K. (2018). Should silent reading feature in a secondary school English programme? West Australian students’ perspectives on silent reading. English in Education, 47(3), 229–244. https://doi.org/10.1111/eie.12026
- Morais, J. (2018). Literacy and democracy. Language, Cognition and Neuroscience, 33(3), 351–372. https://doi.org/10.1080/23273798.2017.1305116
- Mullis, I. V. S., Martin, M. O., Foy, P., & Hooper, M. (2017). PIRLS 2016. International Results in Reading. International Association for the Evaluation of Educational Achievement (IEA).
- Mullis, I.V.S., Martin, M.O., Kennedy, A.M., & Foy, P. (2007). PIRLS 2006. International Report. International Association for the Evaluation of Educational Achievement (IEA).
- OECD. (2017). Understanding the socio-economic divide in Europe. http://oe.cd/cope-divide-europe-2017
- OECD. (2019). PISA 2018 Results (Volume I): What students know and can do. http://www.oecd.org/education/pisa-2018-results-volume-i-5f07c754-en.htm
- Östh, J., Andersson, E. K., & Malmberg, B. (2013). School choice and increasing performance difference: A Counterfactual Approach. Urban Studies, 50(2), 407–425. https://doi.org/10.1177/0042098012452322
- Rao, J., & Scott, A. (1984). On chi-squared tests for multiway contingency tables with cell proportions estimated from survey data. The Annals of Statistics, 12(1), 46–60. https://doi.org/10.1214/aos/1176346391
- Rasinski, T. V., Padak, N. D., McKeon, C. A., Wilfong, L. G., Friedauer, J. A., & Heim, P. (2005). Is reading fluency a key for successful high school reading? Journal of Adolescent & Adult Literacy, 49(1), 22–27. https://doi.org/10.1598/JAAL.49.1.3
- Schleicher, A. (2019). PISA 2018: Insights and Interpretations. OECD. https://www.oecd.org/pisa/PISA%202018%20Insights%20and%20Interpretations%20FINAL%20PDF.pdf
- Senechal, M., & LeFevre, J. (2002). Parental involvement in the development of child’s reading skill: A five year longitudinal study. Child Development, 73(2), 445–460. https://doi.org/10.1111/1467-8624.00417
- Skolverket. (2009). Vad påverkar resultaten i svensk grundskola? Kunskapsöversikt om betydelsen av olika faktorer [What affects the results in Swedish compulsory school? Knowledge overview on the importance of various factors].
- Skolverket. (2016). PISA 2015, 15-åringars kunskaper i naturvetenskap, läsförståelse och matematik, Rapport 450 [PISA 2015, 15-year-olds knowledge in science, reading comprehension and mathematics, report 450].
- Skolverket. (2017). PIRLS 2016. Läsförmågan hos svenska elever i årskurs 4 i ett internationellt perspektiv [PIRLS 2016. The reading ability of Swedish students in grade 4 in an international perspective].
- Skolverket. (2018). Analyser av familjebakgrundens betydelse för skolresultaten och skillnader mellan skolor. Rapport 467 [Analyses of the importance of the family background for school results and differences between schools. Report 467].
- Skolverket. (2019). PISA 2018. 15-åringars kunskaper i läsförståelse, matematik och naturvetenskap [PISA 2018. 15-year-olds knowledge in reading comprehension, mathematics and science].
- Skolverket. (n.d.a). Statistik. [Statistics] Skolenheter och elever läsåren 2012/13–2017/18; 2002/03–2007/08. https://www.skolverket.se/skolutveckling/statistik
- Skolverket. (n.d.b). Statistik. [Statistics] All statistik om en skola, en kommun eller en huvudman. Retrieved 2019 from https://www.skolverket.se/skolutveckling/statistik
- Skolverket. (n.d.c). Statistik. [Statistics] Samtliga skolformer och fritidshem. Barn/elever läsåret 2017/18; Grundskolan – Organisation. Skolor och elever läsåren 1996/97–2000/01. https://www.skolverket.se/skolutveckling/statistik
- Statens medieråd. (2019). Ungar och medier 2019 [Youth and media 2019]. Statens medieråd.
- Swanson, E., Wanzek, J., McCulley, L., Stillman-Spisak, S., Vaughn, S., Simmons, D., Fogarty, M., & Hairrell, A. (2016). Literacy and text reading in middle and high school social studies and English language arts classrooms. Reading & Writing Quarterly, 32(3), 199–222. https://doi.org/10.1080/10573569.2014.910718
- Taylor, B. M., Frye, B. J., & Maruyama, G. M. (1990). Time spent reading and reading growth. American Educational Research Journal, 27(2), 351–362. https://doi.org/10.2307/1163013
- Thomas, D. R., & Decady, Y. J. (2004). Testing for association using multiple response survey data: Approximate Procedures based on the Rao-Scott Approach. International Journal of Testing, 4(1), 43–59. https://doi.org/10.1207/s15327574ijt0401_3
- Topping, K. J., & Paul, T. D. (1999). Computer-assisted assessment of practice at reading: A large scale survey using accelerated reader data. Reading & Writing Quarterly, 15(3), 213–231. https://doi.org/10.1080/105735699278198
- Topping, K. J., Samuels, J., & Paul, T. (2007). Does practice make perfect? Independent reading quantity, quality and student achievement. Learning and Instruction, 17(3), 253–264. https://doi.org/10.1016/j.learninstruc.2007.02.002
- UNICEF. (2018). An unfair start: Inequality in children’s education in rich countries. UNICEF Office of Reseacrh – Innocenti.
- White, K. R. (1982). The relation between socioeconomic status and academic achievement. Psychological Bulletin, 91(3), 461–481. https://doi.org/10.1037/0033-2909.91.3.461
- Yang Hansen, K., & Gustafsson, J.-E. (2016). Causes of educational segregation in Sweden –school choice or residential segregation. Educational Research and Evaluation, 22(1–2), 23–44. https://doi.org/10.1080/13803611.2016.1178589
- Yang Hansen, K., Rosén, M., & Gustafsson, J.-E. (2011). Changes in the multi-level effects of socio-economic status on reading achievement in Sweden in 1991 and 2001. Scandinavian Journal of Educational Research, 55(2), 197–211. https://doi.org/10.1080/00313831.2011.554700
- Ysseldyke, J. E., & Algozzine, R. (1982). Where to begin in diagnosing reading problems. Topics in Learning and Learning Disorders, 2, 60–68.