
ABSTRACT
This longitudinal study of 1,066 Finnish students examined bidirectional reciprocal relationships between changes in perceived supportive school climate and changes in self-reported truancy from the last year of primary school (Grade 6) to the last year of lower secondary school (Grade 9). The results of the random intercept cross-lagged panel model showed, first, that a decrease in positive perceptions of school climate at the previous time point predicted more self-reported truancy at the following time point. Second, an increase in self-reported truancy predicted less positive perceptions of supportive school climate. The study indicates that students’ perceptions of supportive school climate and truancy negatively predict each other over time. Thus, school climate can serve as a target for prevention and intervention efforts to tackle truancy. Moreover, effectively addressing truancy may lead to a more favorable student view of school climate.
Truancy, which is often defined as deliberately skipping classes or all of the school day without a valid reason (Gentle-Genitty et al., Citation2015), is a core educational concern (Van Der Woude et al., Citation2017) and the subject of recent research endeavors (Heyne et al., Citation2019; Kearney et al., Citation2019). Despite significant efforts in the United States to reduce truancy, the rates of skipping whole school days during a 30-day period among students 12–17 years old remained constant between 2002 (10.8%) and 2014 (11.1%; Maynard et al., Citation2017). Particularly, chronic absence is a core component of school accountability plans in many states (Hamlin, Citation2020). It is well established that truancy is associated with multiple school- and non-school-related negative outcomes, such as poor examination results, later unemployment, poorer levels of well-being (Attwood & Croll, Citation2015), early school leaving (Keppens & Spruyt, Citation2018), substance use (Henry & Thornberry, Citation2010), and criminal activity (Rocque et al., Citation2017). For example, Cabus and De Witte (Citation2015) showed that 12- to 23-year-old Dutch secondary school students who truant have a 34.7% higher likelihood of dropping out of school than regular school attendees. Moreover, truancy also has a negative influence on students who do not skip classes, schools, and society as a whole (Maynard et al., Citation2017; Van Eck et al., Citation2017).
A salient predictor of students’ academic, emotional, and behavioral outcomes is school climate (Maxwell et al., Citation2017; Way et al., Citation2007), broadly defined as the quality and character of school life (Hendron & Kearney, Citation2016). The focus of the present study is on adolescents’ perceptions of supportive school climate in terms of their experiences of safety and supportive social relationships at school (Hoferichter et al., Citation2021; Thapa et al., Citation2013). School climate is malleable; thus, it can serve as a target for prevention (Kearney & Graczyk, Citation2014) and intervention (Wang & Degol, Citation2016) efforts. Prior literature on the associations between school climate and truancy (Hendron & Kearney, Citation2016; Keppens & Spruyt, Citation2019; Van Eck et al., Citation2017) indicates that students’ negative perceptions of their school climate may precede skipping classes. Conversely, skipping classes may result in a student’s nonidentification with school (Finn, Citation1989) and, consequently, weakened perceptions of school climate. This implies that a student and their school environment continually influence each other in a reciprocal manner, thereby generating behaviors. Interactions between the student and the school environment are jointly influenced by both student characteristics, such as gender, knowledge and skills, and environmental characteristics (Bronfenbrenner & Morris, Citation2006; Gottfried & Gee, Citation2017; Melvin et al., Citation2019), including supportive school climate.
However, prior studies examining the associations between school climate and truancy are scarce (Keppens & Spruyt, Citation2019). Particularly, causal relationships between school climate and truancy have not been examined (Van Eck et al., Citation2017), although methods, such as autoregressive or cross-lagged designs, can strengthen causal inferences in correlational research (Wang & Degol, Citation2016). Consequently, the present study investigated longitudinal bidirectional reciprocal relationships between changes in how supportive students perceived school climate and changes in their self-reported truancy from Grade 6 to Grade 9.
Theoretical Perspectives
This study views the school as a complex developmental environment, in which academic and social contexts reciprocally influence each other. These reciprocal cyclical influences drive students’ development and academic achievement (see Wang & Hofkens, Citation2019), which can be positive or dysfunctional (Bronfenbrenner & Morris, Citation2006). Specifically, the current study concerns two theories, both of which include academic and social facets of the school. First, social control theory (Hirschi, Citation1969) emphasizes relationship quality and safety at school as important features in preventing delinquent behaviors and truancy (for the overlap between truancy and delinquency, see Van Der Woude et al., Citation2017) of youth (Wang & Degol, Citation2016). Social control theory holds that delinquency is likely to occur when individual’s attachment toward others, participation in various activities, and commitment to the moral value system of society are weakened (see also Keppens & Spruyt, Citation2017; Veenstra et al., Citation2010). In the school context, when students are regularly exposed to proximal processes (Bronfenbrenner & Morris, Citation2006), characterized by students perceiving the school climate as supportive, safe, approving, and encouraging, they are more likely to feel a sense of belonging and attachment to school-related people and to participate in academic activities. According to the theory, social bonds protect students from undesirable behavior, because they do not want to risk losing valued school-related relationships nor diminish the efforts they have made in their personal development and learning to fulfill short-term basic needs, such as excitement or status (see also Keppens & Spruyt, Citation2017). We, thus, assume that positive supportive school climate is a protective factor, because students’ increased positive perceptions of school climate at a given time point are predictive of their decreased truancy at the following time point.
Drawing from school dropout literature, the participation-identification model (Finn, Citation1989; Finn & Zimmer, Citation2012) aims to describe longitudinal relationships between participation, identification, and academic performance. Hence, the participation-identification model shares the same features as social control theory, since it also includes the participatory and attachment components. The primary emphasis is on a student’s participation in school activities, which leads to academic achievement and bonding with school (termed identification) over time. Identification, in turn, feeds back to continued participation. The participation-identification model also depicts a negative developmental cycle, which may result in a dysfunctional outcome. According to the negative cycle, a pattern of low student participation leads to poor academic achievement, non-identification with school, low participation, and, potentially, withdrawal from school with dropping out of school the end point (Finn, Citation1989; Finn & Zimmer, Citation2012). As suggested by the participation-identification model, it is assumed that students’ increased self-reported truancy at a given time point is predictive of their decreased positive perceptions of supportive school climate at the following time point.
Associations Between School Climate and School Absenteeism
In general, students’ emotional and behavioral functioning tends to decrease during early adolescence. Their overall level of engagement declines (Janosz et al., Citation2008), absences from school increase (Gubbels et al., Citation2019), and perceptions of school climate weaken (Wang & Dishion, Citation2012; Way et al., Citation2007). Although longitudinal studies on school climate are needed (Daily et al., Citation2020; Wang & Degol, Citation2016), there is evidence that changes in adolescents’ perceptions of supportive school climate are related to their behavioral outcomes. For instance, Wang and Dishion (Citation2012) found longitudinal associations between declining student-reported school climate, including teacher and peer social support, and increasing teacher-reported student behavioral problems (e.g., uncooperativeness, misbehaving, and physical fighting and/or bullying) from Grade 6 to Grade 8.
In recent years, scholars have started to focus specifically on the associations between school climate and absenteeism (Hendron & Kearney, Citation2016). A recent meta-analysis (Gubbels et al., Citation2019) showed a positive correlation (r = .18) between unexcused absences from school and negative school or classroom climate. Drawing from Baumrind’s (Citation1978) parenting typology, Keppens and Spruyt (Citation2019) investigated the relationship between an authoritative school climate and class skipping among 15-year-old students. They found that authoritative schools characterized by high responsiveness (sense of school belonging) and demandingness (school disciplinary climate) were less often plagued by students skipping classes than authoritarian and indifferent schools. One study (Van Eck et al., Citation2017) profiled students from Grades 6–12, and the schools they attended were segmented into subgroups based on 10 school climate subscales, including students’ perceptions of safety and school belonging. The study found three student-level and two school-level subgroups. Students who perceived their school’s climate as more negative were more likely to attend schools with higher rates of chronic absences (more than 10% missed school days of the school year including excused absences). A correlational study (Daily et al., Citation2020) showed negative associations between middle (estimates −.23 to −.30) and high school students’ (estimates −.11 to −.15) perceptions of three school climate dimensions (i.e., positive student–teacher relationships, order and safety, and opportunities for student engagement) and skipping school. Also, Hamlin (Citation2020) found negative associations (r’s −.03 to −.09) between four dimensions of perceived school climate (i.e., school safety, relational environment, personal connectedness, and academic engagement) and administrative data on total and chronic school absences among students from Grades 6–12 in New York. A qualitative study by Baskerville (Citation2020) found that students reported feeling unsafe and unaccepted and not feeling a sense of belonging among peers in school as factors contributing to truancy.
In general, prior literature shows small but robust associations between school climate and school absenteeism. This indicates that attending school depends on a number of factors, of which not all are related to how students experience school. However, understanding what schools can do to decrease the likelihood of school absenteeism remains critically important (Daily et al., Citation2020; Hamlin, Citation2020). Because prior studies on the associations between school climate and school absenteeism are cross-sectional (for an exception, see Hamlin, Citation2020), longitudinal bidirectional associations between school climate and truancy remain largely uncovered.
The Current Study
The present study investigated longitudinal bidirectional relationships between student-perceived supportive school climate and self-reported truancy. The following two research questions and hypotheses were set.
Research question 1. Does student-perceived supportive school climate predict student-reported truancy from Grade 6 to Grade 9? Based on social control theory (Hirschi, Citation1969), it was hypothesized that students’ decreased positive perceptions of supportive school climate increased their risk of truancy at the subsequent time point (Hypothesis 1).
Research question 2. Does student-reported truancy predict student perceptions of supportive school climate from Grade 6 to Grade 9? Based on the participation-identification model (Finn, Citation1989; Finn & Zimmer, Citation2012), it was hypothesized that students’ increased truancy dampened their perceptions of supportive school climate at the subsequent time point (Hypothesis 2).
Method
Participants
In total of 1,066 students participated in a longitudinal ANONYMIZED study. The study protocol was approved by the Ethics Committee of the ANONYMIZED university. The longitudinal study followed a community sample of adolescents through their transition from primary school to lower secondary school and further to upper secondary education in two medium-sized towns in central Finland with a combined population of 130,000. Both towns included semi-rural areas with smaller schools. The participants were recruited from one large town (about half of the age cohort) and one middle-sized town (whole age cohort) in Central Finland. Both towns included semi-rural areas with smaller schools. Target schools (n = 30) were selected according to their location and size, with the aim of achieving a sufficient sample size and enabling extensive data collections throughout the whole research project. The selection and recruitment of the schools was done in cooperation with the local school authorities.
Before the start of the longitudinal follow-up study, all sixth-grade students and their families (N ∼ 1,150) in the selected primary schools were contacted and the families gave their informed consent to participate in the study. When the study progressed, if new students moved from other schools and joined the participating classes, the new families were asked to participate as well. The students were followed from Grade 6 (the last year in primary school) fall term to Grade 9 (the last year in upper secondary school) fall term. Parents provided their informed written consent and children gave their assent to participate in the study.
The sample of this study consists of 1,066 adolescents (92% of the target population) who participated in the study at least once during the longitudinal follow-up. In Grade 6 fall term (September-October 2014, T1), the participants (N = 841; 54.1% females) were from 30 schools (57 classrooms) and were aged 11–14 years (median age 12 years). In Grade 7 fall term (September-October 2015, T2), the students (N = 834; 54.3% females) were from 23 schools (72 classrooms). In Grade 7 spring term (March-April 2016, T3), the students (N = 825; 54.8% females) were from 24 schools (75 classrooms). In Grade 9 fall term (September-October 2017, T4), the students (N = 884; 56.1% females) were from 30 schools (87 classrooms). On average, the majority of students came from 55–57 classrooms at each time point; however, the number of classrooms rose to 72–85 classrooms in Grade 7 and Grade 9, as we continued following also those students who moved to other schools or municipalities. The participation rates varied from 78% to 83% between different measurement points. Students’ data were collected in their classrooms on normal school days by two trained research assistants.
Measures
Perceived Supportive School Climate
Perceived supportive school climate was measured at all four time points via four items adapted from the Health Behaviour In School-Aged Children study (Currie et al., Citation2012; Kämppi et al., Citation2012; see also, Hoferichter et al., Citation2021). The items were I feel safe in this school, I feel like I belong in this school, Even students who are not like the others are accepted at school, and Our school’s rules are righteous, measuring adolescents’ perceptions of safety and supportive social relationships at school (Thapa et al., Citation2013). Items were rated on a 5-point scale (1 = strongly disagree; 5 = strongly agree); higher scores indicated higher perceptions of supportive school climate. One mean score for each of the four time points was created. Cronbach’s alphas at T1, T2, T3, and T4 were .78, .81, .82, and .79, respectively.
Self-reported Truancy
Truancy was defined as skipping classes or school without a valid excuse (Gentle-Genitty et al., Citation2015). It was measured at all four time points with one item I play truant from some classes or school. The time frame was the last six months. The response options were 1 = untrue; 2 = true to some extent; and 3 = clearly true. In total, 6.2%, 9.0%, 17.3%, and 16.1% of the students reported truancy at least to some extent at T1, T2, T3, and T4, respectively. These frequencies are in line with the relatively high occurrence of truancy observed in individualized educational systems such as the one in Finland (Keppens & Spruyt, Citation2018).
Analytical Strategy
A recent development in longitudinal research methodologies has led scholars to study processes that unfold within-person (intra-individual time-variant states) rather than between-person (inter-individual time-invariant traits) over time (Berry & Willoughby, Citation2017; Curran et al., Citation2014; Hamaker, Citation2012). The random intercept cross-lagged panel model (RI-CLPM; Hamaker et al., Citation2015) is a method that splits the variance between between-person stable traits and within-person fluctuations over time through the inclusion of a random intercept (Keijsers, Citation2016). By partitioning out between-person variances in the observed scores, RI-CLPM pertains to within-person dynamics (Hamaker et al., Citation2015). Therefore, RI-CLPM was an optimal method to examine longitudinal reciprocal associations between perceived supportive school climate and self-reported truancy at the level where causality takes place: the within-person level (Keijsers, Citation2016). In RI-CLPM, the autoregressive parameters imply that occasions when a person scored above (or below) his/her expected score (consisting of a time-specific group mean and a person’s mean score over all occasions) are likely to be followed by occasions when he or she scores above (or below) the expected score again. Cross-lagged parameters reflect whether changes from an individual’s expected score on one variable (y) are predicted from preceding deviations on a second variable (x), while controlling for the individual’s deviation from the preceding expected score on y and all possible time-invariant covariates (individual differences captured by random intercepts; Hamaker et al., Citation2015).
Using Mplus version 8.3. (Muthén & Muthén, Citation2017), the analyses were conducted in the following order. First, means, standard deviations, and correlations between the variables were examined (). Second, four nested models were estimated, and the fit of the models were compared to each other (). For well-fitting models, the following criteria were used: chi-square (χ2) test = ns (p > .05); root mean square error of approximation (RMSEA) < .05; comparative fit index (CFI) > .95, and Tucker-Lewis index (TLI) > .95 (Byrne, Citation2012). For model comparisons, the Satorra-Bentler scaled chi-square difference test (Satorra & Bentler, Citation2001) was applied. A statistically significant chi-square value indicates that the model with more estimated parameters fit the data better than the more parsimonious model. Third, the RI-CLPM parameters were estimated for the model selected as the most parsimonious, yet fit the data well. Fourth, a series of sensitivity analyses were conducted to check whether student characteristics interacted with the cross-lagged paths ().
Table 1. Variable Frequencies, Means, Standard Deviations, Intraclass Correlations, and Bivariate Correlations Between School Climate and Truancy
Table 2. Model fit indices
Table 3. Sensitivity analyses
The design effects (DEFF) less than 2 (McCoach, Citation2010) showed that the data on students’ perceptions on supportive school climate (DEFF 1.08-1.66) and self-reported truancy (DEFF 1.13-1.50) were not clustered at the school level at any time point. However, the data on supportive school climate (but not on truancy) were slightly clustered at the classroom level at T1 (2.24) and T3 (2.11). The clustered structure of the data (students nested within classrooms) was accounted for by adjusting standard errors by COMPLEX type analysis (Muthén & Muthén, Citation2017). Because the truancy variable was non-normally distributed at each time point, it was first log-transformed, and then the analyses were conducted using maximum likelihood estimation with robust standard errors (MLR). The robustness of the results were checked by running a series of multigroup analyses and running the final model with bootstrap standard errors based on 10,000 replications.
Little’s (Citation1988) MCAR test indicated that missingness was not completely random: χ2 = 127.16 (59), p < = .001. A series of chi-square tests of independence and Mann–Whitney U tests showed that there were more missing values for boys than girls for truancy at T3 (χ2 (1) 4.16, p = .041, V = 0.06) and T4 (χ2 (1) 6.50, p = .011, V = 0.08) and for lower educated parents’ children than higher educated parents’ children at T3 (χ2 (6) 13.38, p = .037, V = 0.13) and T4 (χ2 (6) 16.52, p = .011, V = 0.14). For perceived supportive school climate, there were more missing values for boys than girls at T4 (χ2 (1) 7.32, p = .007, V = 0.08) and for lower educated parents’ children than higher educated parents’ children at T4 (χ2 (6) 17.94, p = .006, V = 0.15). Moreover, U tests indicated that there were more missing values for truancy for students with lower self-reported Grade 5 grade point averages (GPA) than higher ones at T2 (U = 12321.50, p = .041, d = 0.15), T3 (U = 13341.00, p < .001, d = 0.41), and T4 (U = 27266.50, p < .001, d = 0.48). For supportive school climate, students with lower GPA had more missing values than students with higher GPA at T3 (U = 10803.00, p < .001, d = 0.27) and T4 (U = 27456.00, p < .001, d = 0.47). As seen by Cramer’s V and Cohen’s d values, the effect sizes were, however, small in magnitude (Cohen, Citation1988). For handling missing values, full information maximum likelihood (FIML) was employed (Muthén & Muthén, Citation2017).
Results
Descriptive Statistics
As shown in , the mean level of students’ perceptions of supportive school climate did not change across the transition from primary (T1) to lower secondary school (T2), t(785) −1.47, p = .141, d = 0.05. It, however, declined from Grade 7 fall (T2) to spring (T3), t(803) 7.40, p < .001, d = 0.25 and, further, from Grade 7 spring to Grade 9 fall (T4), t(673) 4.70, p < .001, d = 0.17. Student-reported truancy increased across the transition from primary to lower secondary school, t(776) −2.69, p = .007, d = 0.11 and, further, from T2 to T3, t(783) −6.55, p < .001, d = 0.21 but not from T3 to T4, t(664) −0.97, p = .334, d = 0.02. Intraclass correlations (ICC) indicated that about half of the variance of supportive school climate and two-thirds of the variance of truancy were within-student fluctuations over time. The vast majority of between-student rank order correlations were statistically significant and in expected direction: supportive school climate and truancy are inversely related. As expected, within-student correlations were smaller in magnitude than between-student correlations. Autocorrelations were either positive or non-significant; supportive school climate and truancy either correlated negatively or correlations were not significant. The association between perceived supportive school climate and self-reported truancy was slightly stronger in lower secondary than in primary school, indicating an increasing impact (escalating effect) of supportive school climate on truancy and vice versa across time.
Estimation of Nested Models
presents fit indices of the estimated models and comparisons between the nested models. Model 1 is a stability model that, in addition to correlation between random intercepts (r = −.46, p < .001) and within-time correlations, only included freely-estimated autoregressions of each construct. The model showed good fit to the data (CFI = .99; TLI = .98). Restricting the autoregressions time-invariant (Model 2) did not worsen the model fit (CFI = .99; TLI = .98) significantly as indicated by the statistically nonsignificant Δχ2 value in Comparison 1. Model 3 further restricted the model by equating autoregressions with each other and cross-lagged paths with each other, which resulted in a better fitting model (CFI = .99; TLI = .99) compared to Model 2 (Comparison 2). Finally, we estimated Model 4 with freely estimated autoregressions and a cross-lagged path model (CFI = .99; TLI = .97). As indicated by the statistically non-significant Δχ2 value in Comparison 3, the more restrictive Model 3 did not fit the data worse than Model 4. Therefore, due to its parsimony, Model 3 was chosen as the final model.
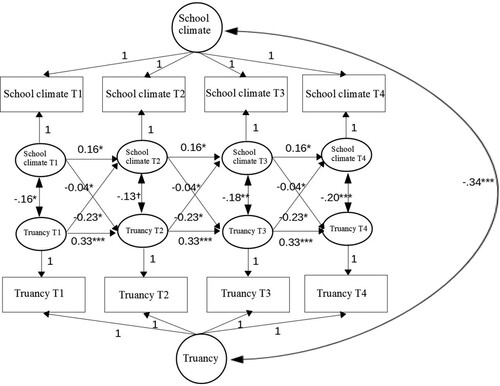
The results (unstandardized estimates) from Model 3 (see ) showed that the within-student autoregressive parameter from the previous to the subsequent time points was statistically significant for both perceived supportive school climate (B = 0.16, SE = 0.063, p = .011) and self-reported truancy (B = 0.33, SE = 0.070, p < .001), indicating a within-student carryover effect from the previous to the subsequent time point. The range of standardized βs was from 0.14 (p = .015) to 0.18 (p = .008) and from 0.24 (p < .001) to 0.33 (p < .001), respectively. The correlation between the random intercepts was −.34 (p < .001), indicating that students who perceive supportive school climate positively tend not to play truant. Moreover, intraindividual within-time correlations between perceived supportive school climate and self-reported truancy were all negative, ranging from −.13 (p = .051, SE = 0.067) at T2 to −.20 (p < .001, SE = 0.050) at T4.
Figure 1. Reciprocal longitudinal cross-lagged associations (unstandardized coefficients) between school climate and truancy. Note. T1 = Grade 6 fall, T2 = Grade 7 fall, T3 = Grade 7 spring, T4 = Grade 9 fall. ***p < .001, **p < .01, *p < .05, †p = .051. Circles represent between-person variance (random intercepts), ovals within-person variance, and rectangles observed variables. Observed variables’ residual variances were fixed at 0. Two-headed arrows represent correlations. Random intercepts and T1-T4 within-person variances (all p < .001) are not diagrammed.
Does Student-perceived Supportive School Climate Predict Self-reported Truancy from Grade 6 to Grade 9?
Research question 1 concerned whether student-reported supportive school climate predicted self-reported truancy from Grade 6 to Grade 9. The results indicated a small but statistically significant and negative within-student cross-lagged path (B = −0.04, SE = 0.017, p = .033); changes in supportive school climate scores above students’ expected scores at the previous time points predicted changes toward less truancy at the subsequent time points. The range of standardized βs was from −0.07 (p = .034) to −0.11 (p = .032).
Does Student-reported Truancy Predict Student Perceptions of Supportive School Climate from Grade 6 to Grade 9?
Research question 2 concerned whether student-reported truancy predicted perceived supportive school climate from Grade 6 to Grade 9. The results indicated a statistically significant and negative within-student cross-lagged path (B = −0.23, SE = 0.102, p = .024); changes in truancy scores above students’ expected scores at the previous time points predicted changes toward less positive supportive school climate perceptions at the subsequent time points. The range of standardized βs was from −0.07 (p = .026) to −0.11 (p = .029).
Sensitivity Analyses
Lastly, in line with Bronfenbrenner and Morris (Citation2006), a series of sensitivity analyses were conducted to check whether student characteristics interacted with the cross-lagged paths (see for model descriptions and fit indices). To summarize, sensitivity analyses indicated that the negative bidirectional longitudinal within-student relationships between changes in perceived supportive school climate and self-reported truancy held when the final model was estimated using regular CLPM (Model 1S) and RI-CLPM with bootstrapped standard errors (Model 2S). Moreover, the results were robust when students’ parents’ educational level was added as a predictor explaining school climate and truancy: school climate predicting truancy (B = −0.04, SE = 0.017, p = .008) and truancy predicting school climate (B = −0.25, SE = 0.126, p = .047) (Model 3S). When students’ gender was added to the model in addition to parents’ educational level, truancy still predicted school climate (B = −0.24, SE = 0.103, p = .021) but the predictive relationship between school climate and truancy was only marginally significant (B = −0.03, SE = 0.017, p = .091) (Model 4S). Finally, adding students’ academic achievement as a predictor, in addition to parents’ educational level and students’ gender, resulted in truancy predicting school climate (B = −0.22, SE = 0.108, p = .047) but not the other way round (B = −0.02, SE = 0.017, p = .214) (Model 5S).
Discussion
This study investigated longitudinal bidirectional relationships between changes in students’ perceptions of supportive school climate and changes in self-reported truancy. The results showed, first, that during the course from Grade 6 (last year in primary school) to Grade 9 (last year in lower secondary school), decreases in positive perceptions of supportive school climate at the previous time point predicted more self-reported truancy at the following time point. Second, increases in self-reported truancy predicted less positive perceptions of supportive school climate. This relationship was more robust than school climate predicting truancy as it held when a student’s parent’s educational level, a student’s gender, and students’ academic achievement were controlled for in the model. While the associations were small in magnitude, the study importantly indicates how early adolescents’ perceptions of supportive school climate and self-reported truancy predict each other over time. Thus, the study indicates that school-based efforts in improving students’ perceptions of supportive school climate can reduce truancy, and nimbly addressing truant behavior can make students feel that school is more supportive.
Confirming Hypothesis 1, decreases in positive perceptions of supportive school climate were associated with increased levels of subsequent self-reported truancy. According to social control theory (Hirschi, Citation1969), attachment to school-related norm-relevant people serves as a control mechanism for students, because they do not want to risk their relationships with significant others at school nor the efforts they made for their future educational aspirations and goals. Social controls thus buffer students from adverse school-related outcomes by increasing the probability that they will not skip classes. If a student is not feeling belongingness, acceptance, identification, and connectedness to others at school—in other words, perceives supportive school climate as poor—the emotional ingredient needed to maintain the student’s involvement, and to overcome the occasional adversity, is lacking and the likelihood of truancy increases (Finn, Citation1989; Finn & Zimmer, Citation2012). To ensure students continue to identify with school, their perceptions and experiences of school need to be systematically monitored (see Appleton, Citation2012) as school climate is not a static construct (Wang & Degol, Citation2016). A relative decrease in positive perceptions of school climate may be, to some extent, normative among adolescents (Janosz et al., Citation2008), but extensive decreases may also lead to occasional class skipping that escalates into chronic truancy (Keppens & Spruyt, Citation2017; Keppens & Spruyt, Citation2019) and, ultimately, dropping out of school (Cabus & De Witte, Citation2015; Finn, Citation1989; Finn & Zimmer, Citation2012; Kearney, Citation2008). Also, through the mechanism termed the Matthew effect (Merton, Citation1968), decreases in positive perceptions of supportive school climate may, in the long run, widen the gap between students who struggle at school and students who do not. Regular school attendance provides students with opportunities to develop their academic, language, social, and work-related skills (Kearney & Graczyk, Citation2014). Students whose perceptions of supportive school climate remain stable are unlikely to skip school or classes, which contributes to their learning and development and, further, positive perceptions of supportive school climate during their lower secondary school years. Conversely, students who perceive supportive school climate as less positive may skip classes, which hinders their learning and development and identification with school mates and staff. This, in turn, increases the likelihood of skipping classes in the future.
Aligning the Hypothesis 2, increases of student-reported truancy were related to weakened perceptions of supportive school climate at the subsequent time point (Finn, Citation1989; Finn & Zimmer, Citation2012). Students who resist school-related people and values by deliberately skipping classes may already be in the process of abandoning a psychological membership at school. Truants may pursue tangible rewards outside of school (such as watching television, playing videogames, and accessing social media) (Kearney, Citation2018) or look for a positive self-image elsewhere (e.g., from an out-of-school peer group or other truanting students). Consequently, truants experience a weakened sense of belonging and connectedness at school at the following time point. The vicious circle of playing truant, perceiving supportive school climate as negative and, thus, playing truant more frequently may place a student at-risk of dropping out of school altogether, as suggested by the participation-identification model (Finn, Citation1989; Finn & Zimmer, Citation2012). Therefore, early identification and a nimble response to truant behavior and emerging school attendance problems, in general (Baskerville, Citation2020; Kearney et al., Citation2019), is of importance. Even a small amount of absences are linked to more severe problems (Kearney & Graczyk, Citation2014), possibly via escalating effects of occasional class skipping becoming a habit (Baskerville, Citation2020; Keppens & Spruyt, Citation2017; Keppens & Spruyt, Citation2019). On the other hand, truancy decreases the possibilities to engage in proximal processes in school (Bronfenbrenner & Morris, Citation2006), which can enhance a student’s likelihood of being absent from school. This mechanism points out that intervention efforts at all ages should be directed toward increasing and maintaining students’ participation levels (Finn, Citation1989). A positive perception of supportive school climate needs to be maintained by actively participating (i.e., not skipping) at school on a daily basis. Identification with school, comprising both a sense of belonging and valuing school-related outcomes, develops gradually. It is a prerequisite for continued participation in school activities, even if the short-term outcomes (such as test achievement) are not always evaluated positively. Nonidentification predisposes the individual to not continuing to participate in school-related activities, leading to a withdrawal cycle characterized by less successful school outcomes, and emotional and physical withdrawal from school (Finn, Citation1989; Finn & Zimmer, Citation2012).
Theoretical and Practical Implications
The results of the present study imply several theoretical and practical implications. First, the study showed that students’ perceptions of supportive school climate and truancy are intertwined over time, thus reciprocally predicting each other. This adds to the scarce literature on the associations between school climate and truancy (Keppens & Spruyt, Citation2019). The study also implies that not only can attachments to school-related norm-relevant people control for students’ school attendance (Hirschi, Citation1969), thus preventing truancy, but also truancy can impact how supportive students perceive school climate. This is theoretically important as it indicates that researchers should not only focus on the negative impact of truancy on students’ academic achievement and school completion but also a potential critical mediator, namely school climate, between truancy and educational outcomes. From a practical point of view, the study shows that students’ perceptions of supportive school climate vary over time, so it is a malleable construct. Thus it can serve as a target for Tier 1 prevention (Kearney & Graczyk, Citation2014) and intervention (Wang & Degol, Citation2016) efforts. Although this study found longitudinal associations between supportive school climate and lower occurrence of truancy that were small in magnitude, the effects can be large when interventions are implemented within the whole-school framework (for practical significance, see Scheerens et al., Citation2013). Interventions, such as school-wide Positive Behavioral Interventions and Supports (PBIS), to enhance a positive school climate, promote school attendance, and prevent truancy may be beneficial for a large body of students but particularly so for high-risk students (Bradshaw et al., Citation2015). PBIS, which includes setting clear behavioral expectations, rewarding students for positive behaviors, emphasizing prosocial skills and behaviors, collecting and analyzing disciplinary data regularly, and implementing evidence-based academic and behavioral practices, has been shown to reduce truancy in secondary schools (Pas et al., Citation2019), especially when implemented with high fidelity (Pas & Bradshaw, Citation2012). PBIS components in a Response to Intervention (RtI) model to promote school attendance and prevent absenteeism might be adapted to include increased student involvement in school attendance policies, examination of patterns in attendance data, and immediate responses to instances of absenteeism (for RtI-based strategies to address school attendance problems, see Kearney & Graczyk, Citation2014).
Increasing students’ engagement with school is an avenue to tackle school attendance problems. Check and Connect (Christenson et al., Citation2012) is a manualized and evidence-based Tiers 1–3 intervention (Kearney, Citation2016), which allows some flexibility in implementation. It is important given the myriad of factors that relate to truancy (Kearney, Citation2008), making a one-size-fits-all strategy insufficient for tackling it (Keppens & Spruyt, Citation2017). A core component is a mentor who works intensively with a struggling student and his/her family. The mentor builds relationships between the student, school staff, and family members, regularly checks the student’s absenteeism over time, and re-connects the student with his/her school. Check and Connect has shown its usefulness for increasing middle school students’ attendance rates in some studies (Powers et al., Citation2017) but not in all (Maynard et al., Citation2014).
Limitations
There are some limitations that need to be taken into account when interpreting the results. First, the method applied in this study (RI-CLPM) employed single indicator for perceived supportive school climate and self-reported truancy. Thus, we were unable to control for measurement error in the analyses. Subsequent studies could use multivariate RI-CLPM (Mulder & Hamaker, Citation2020) to control for measurement error and shed light on even more complex dynamics. However, the advantage of the univariate RI-CLPM over the regular CLPM is that it disentangles time-invariant trait-like differences between individuals and within-person fluctuations around one’s own overall mean level, thus operating at the within-individual level. Second, although within-person fluctuations occur at the level where causality takes place (Keijsers, Citation2016), it does not prove causality (for Granger causality, see Hamaker et al., Citation2015). However, the study is longitudinal and the method applied controls for unobserved confounders by having an individual as a control for themselves. Therefore, this study can suggest cause-and-effect relationships between the study variables. Third, missing values were not missing at random (MNAR). Boys, children of less educated parents, and students with poorer academic school performance had more missing values than girls, children of more educated parents, and better performing students. Moreover, truant behavior may be underestimated because truants were more likely absent from school on the days when the survey was administered than non-truanting students. Thus, somewhat systematic missingness may have influenced the study results. However, FIML used in this study is expected to yield less biased results than other missing data handling methods also in the MNAR situation. Fourth, the results are based on students’ self-reports, which are prone to social desirability bias and recall problems. Future research should employ more objective measures of truancy, such as school records. Also, the constructs could be measured with the data collected from multiple informants (Konold & Cornell, Citation2015). Finally, the measure of perceived supportive school climate in this study was unidimensional, measuring primarily adolescents’ experiences of safety and supportive social relationships at school. Future studies would do well by also examining other aspects of school climate, such as perceptions of school facilities and instruction-related climate (Thapa et al., Citation2013). This would enable examination of reciprocal associations between truancy and specific aspects of school climate.
Conclusion
Regular school attendance is an important developmental outcome. It is an indicator of a youth’s developmental capacity to engage in school and separate from their parents (Melvin et al., Citation2019). Knowing the strong correlation between truancy and school dropout, truancy is also an important and visible warning signal of increased risk of early school leaving (Keppens & Spruyt, Citation2018). The present study indicated that students’ perceptions of supportive school climate and truant behavior both mutually predict each other from the end of primary school to the end of lower secondary school. This information provides schools with targets for preventions and interventions. Improving the supportiveness of school climate can reduce the risk of a student’s subsequent truant behavior, and effectively addressing truancy may help a student view school climate as positive and supportive while pursuing their studies.
Acknowledgements
This study forms part of the ongoing STAIRWAY-From Primary School to Secondary School Study (Ahonen & Kiuru, 2013). The study was funded by a grant from the Academy of Finland (#266851)
Disclosure Statement
No potential conflict of interest was reported by the author(s).
Declarations of interest
none
Data availability statement
No data is available
Additional information
Funding
References
- Appleton, J. J. (2012). System consultation: Developing the assessment-to-intervention link with the student engagement instrument. In S. L. Christenson, A. L. Reschly, & C. Wylie (Eds.), Handbook of research on student engagement (pp. 725–741). Springer.
- Attwood, G., & Croll, P. (2015). Truancy and well-being among secondary school pupils in england. Educational Studies, 41(1-2), 14–28. https://doi.org/10.1080/03055698.2014.955725
- Baskerville, D. (2020). Truancy begins in class: Student perspectives of tenuous peer relationships. Pastoral Care in Education, 108–124. https://doi.org/10.1080/02643944.2020.1788125
- Baumrind, D. (1978). Parental disciplinary patterns and social competence in children. Youth & Society, 9(3), 239–267. https://doi.org/10.1177/0044118X7800900302
- Berry, D., & Willoughby, M. T. (2017). On the practical interpretability of cross-lagged panel models: Rethinking a developmental workhorse. Child Development, 88(4), 1186–1206. https://doi.org/10.1111/cdev.12660
- Bradshaw, C. P., Waasdorp, T. E., & Leaf, P. J. (2015). Examining variation in the impact of school-wide positive behavioral interventions and supports: Findings from a randomized controlled effectiveness trial. Journal of Educational Psychology, 107(2), 546–557. https://doi.org/10.1037/a0037630
- Bronfenbrenner, U., & Morris, P. (2006). The bioecological model of human development. In W. Damon, & R. M. Lerner (Eds.), Handbook of child psychology: Theoretical models of human development (6th ed, pp. 793–828). Wiley.
- Byrne, B. M. (2012). Structural equation modeling with mplus: Basic concepts, applications, and programming. Routledge.
- Cabus, S., & De Witte, K. (2015). Does unauthorized school absenteeism accelerates the dropout decision? - evidence from a Bayesian duration model. Applied Economics Letters, 22(4), 266–271. https://doi.org/10.1080/13504851.2014.937031
- Christenson, S. L., Stout, K. E., & Pohl, A. J. (2012). Check & connect manual: Implementing with fidelity. (3rd ed.). University of Minnesota, Institute on Community Integration.
- Cohen, J. (1988). Statistical power analysis for the behavioral sciences (2nd ed.). Hillsdale, N. Lawrence Erlbaum.
- Curran, P. J., Howard, A. L., Bainter, S. A., Lane, S. T., & McGinley, J. S. (2014). The separation of between-person and within-person components of individual change over time: A latent curve model with structured residuals. Journal of Consulting and Clinical Psychology, 82(5), 879–894. https://doi.org/10.1037/a0035297
- Currie, C., Zanotti, C., Morgan, A., Currie, D., De Looze, M., & Roberts, C. (2012). Social determinants of health and well-being among young people. Health behaviour in school-aged children (HBSC) study: International report from the 2009/2010 survey. Copenhagen, WHO regional office for Europe, (Health policy for children and adolescents, no. 6).
- Daily, S. M., Smith, M. L., Lilly, C. L., Davidov, D. M., Mann, M. J., & Kristjansson, A. L. (2020). Using school climate to improve attendance and grades: Understanding the importance of school satisfaction among middle and high school students. Journal of School Health, 90(9), 683–693. https://doi.org/10.1111/josh.12929
- Finn, J. D. (1989). Withdrawing from school. Review of Educational Research, 59(2), 117–142. https://doi.org/10.3102/00346543059002117
- Finn, J. D., & Zimmer, K. S. (2012). Student engagement: What is it? Why does it matter? In S. L. Christenson, A. L. Reschly, & C. Wylie (Eds.), Handbook of research on student engagement (pp. 97–131). Springer.
- Gentle-Genitty, C., Karikari, I., Chen, H., Wilka, E., & Kim, J. (2015). Truancy: A look at definitions in the USA and other territories. Educational Studies, 41(1-2), 62–90. https://doi.org/10.1080/03055698.2014.955734
- Gottfried, M. A., & Gee, K. A. (2017). Identifying the determinants of chronic absenteeism: A bioecological systems approach. Teachers College Record, 119(7), 1–34. https://doi.org/10.1177/016146811711900704
- Gubbels, J., van der Put, C., & Assink, M. (2019). Risk factors for school absenteeism and dropout: A meta-analytic review. Journal of Youth and Adolescence, 48(9), 1637–1667. https://doi.org/10.1007/s10964-019-01072-5
- Hamaker, E. L. (2012). Why researchers should think “within-person": A paradigmatic rationale. In M. R. Mehl, & T. S. Conner (Eds.), Handbook of research methods for studying daily life (pp. 43–61). The Guilford Press.
- Hamaker, E. L., Kuipers, R. M., & Grasman, R. P. P. P. (2015). A critique of the cross-lagged panel model. Psychological Methods, 20(1), 102–116. https://doi.org/10.1037/a0038889
- Hamlin, D. (2020). Can a positive school climate promote student attendance? Evidence from New York city. American Educational Research Journal. https://doi.org/10.3102/0002831220924037
- Hendron, M., & Kearney, C. A. (2016). School climate and student absenteeism and internalizing and externalizing behavioral problems. Children & Schools, 38(2), 109–116. https://doi.org/10.1093/cs/cdw009
- Henry, K. L., & Thornberry, T. P. (2010). Truancy and escalation of substance Use during adolescence*. Journal of Studies on Alcohol and Drugs, 71(1), 115–124. https://doi.org/10.15288/jsad.2010.71.115
- Heyne, D., Gren-Landell, M., Melvin, G., & Gentle-Genitty, C. (2019). Differentiation between school attendance problems: Why and how? Cognitive and Behavioral Practice, 26(1), 8–34. https://doi.org/10.1016/j.cbpra.2018.03.006
- Hirschi, T. (1969). Causes of delinquency. Univ. of California Pr.
- Hoferichter, F., Hirvonen, R., & Kiuru, N. (2021). The development of school well-being in secondary school: High academic buoyancy and supportive class- and school climate as buffers. Learning and Instruction, 71, https://doi.org/10.1016/j.learninstruc.2020.101377
- Janosz, M., Archambault, I., Morizot, J., & Pagani, L. S. (2008). School engagement trajectories and their differential predictive relations to dropout. Journal of Social Issues, 64(1), 21–40. https://doi.org/10.1111/j.1540-4560.2008.00546.x
- Kämppi, K., Välimaa, R., Ojala, K., Tynjälä, J., Haapasalo, I., Villberg, J., & Kannas, L. (2012). Koulukokemusten kansainvälistä vertailua 2010 sekä muutokset Suomessa ja Pohjoismaissa 1994–2010 - WHO-koululaistutkimus (HBSC-study). Koulutuksen seurantaraportit 2012:8. [International comparison of school experiences in 2010 and changes in Finland and in the Nordic countries from 1994 to 2010 – The health behavior of school-aged children study]. Tampere, Finland: Finnish National Board of Education.
- Kearney, C. (2018). Helping school refusing children and their parents: A guide for school-based professionals. (2nd ed.). Oxford University Press.
- Kearney, C. A. (2008). An interdisciplinary model of school absenteeism in youth to inform professional practice and public policy. Educational Psychology Review, 20(3), 257–282. https://doi.org/10.1007/s10648-008-9078-3
- Kearney, C. A. (2016). Managing school absenteeism at multiple tiers: An evidencebased and practical guide for professionals. Oxford University Press.
- Kearney, C. A., Gonzalvez, C., Graczyk, P. A., & Fornander, M. J. (2019). Reconciling contemporary approaches to school attendance and school absenteeism: Toward promotion and nimble response, global policy review and implementation, and future adaptability (part 1). Frontiers in Psychology, 10, https://doi.org/10.3389/fpsyg.2019.02222
- Kearney, C. A., & Graczyk, P. (2014). A response to intervention model to promote school attendance and decrease school absenteeism. Child & Youth Care Forum, 43(1), 1–25. https://doi.org/10.1007/s10566-013-9222-1
- Keijsers, L. (2016). Parental monitoring and adolescent problem behaviors: How much do we really know? International Journal of Behavioral Development, 40(3), 271–281. https://doi.org/10.1177/0165025415592515
- Keppens, G., & Spruyt, B. (2017). The development of persistent truant behaviour: An exploratory analysis of adolescents’ perspectives. Educational Research, 59(3), 353–370. https://doi.org/10.1080/00131881.2017.1339286
- Keppens, G., & Spruyt, B. (2018). Truancy in Europe: Does the type of educational system matter? European Journal of Education, 53(3), 414–426. https://doi.org/10.1111/ejed.12282
- Keppens, G., & Spruyt, B. (2019). The school as a socialization context: Understanding the influence of school bonding and an authoritative school climate on class skipping. Youth & Society, 51(8), 1145–1166. https://doi.org/10.1177/0044118X17722305
- Konold, T., & Cornell, D. (2015). Multilevel multitrait–multimethod latent analysis of structurally different and interchangeable raters of school climate. Psychological Assessment, 27(3), 1097–1109. https://doi.org/10.1037/pas0000098
- Little, R. J. A. (1988). A test of missing completely at random for multivariate data with missing values. Journal of the American Statistical Association, 83(404), 1198–1202. https://doi.org/10.1080/01621459.1988.10478722
- Maxwell, S., Reynolds, K. J., Lee, E., Subasic, E., & Bromhead, D. (2017). The impact of school climate and school identification on academic achievement: Multilevel modeling with student and teacher data. Frontiers in Psychology, 8, https://doi.org/10.3389/fpsyg.2017.02069
- Maynard, B. R., Kjellstrand, E. K., & Thompson, A. M. (2014). Effects of Check and Connect on attendance, behavior, and academics: A randomized effectiveness trial. Research on Social Work Practice, 24(3), 296–309. https://doi.org/10.1177/1049731513497804
- Maynard, B. R., Vaughn, M. G., Nelson, E. J., Salas-Wright, C. P., Heyne, D. A., & Kremer, K. P. (2017). Truancy in the United States: Examining temporal trends and correlates by race, age, and gender. Children and Youth Services Review, 81, 188–196. https://doi.org/10.1016/j.childyouth.2017.08.008
- McCoach, B. D. (2010). Hierarchical linear modeling. In G. R. Hancock, & R. O. Mueller (Eds.), The reviewer’s guide to quantitative methods in the social sciences: Revise, accept, reject (pp. 123–140). Routledge.
- Melvin, G. A., Heyne, D., Gray, K. M., Hastings, R. P., Totsika, V., Tonge, B. J., & Freeman, M. M. (2019). The kids and teens at school (KiTeS) framework: An inclusive bioecological systems approach to understanding school absenteeism and school attendance problems. Frontiers in Education, 4, https://doi.org/10.3389/feduc.2019.00061
- Merton, R. K. (1968). The Matthew effect in science: The reward and communication systems of science are considered. Science, 159(3810), 56–63. https://doi.org/10.1126/science.159.3810.56
- Mulder, J. D., & Hamaker, E. L. (2020). Three extensions of the random intercept cross-lagged panel model. Structural Equation Modeling: A Multidisciplinary Journal, https://doi.org/10.1080/10705511.2020.1784738
- Muthén, L. K., & Muthén, B. O. (2017). Mplus user’s guide. Eighth edition. Muthén & Muthén.
- Pas, E. T., & Bradshaw, C. (2012). Examining the association between implementation and outcomes. The Journal of Behavioral Health Services & Research, 39(4), 417–433. https://doi.org/10.1007/s11414-012-9290-2
- Pas, E. T., Ryoo, J. H., Musci, R. J., & Bradshaw, C. P. (2019). A state-wide quasi-experimental effectiveness study of the scale-up of school-wide positive behavioral interventions and supports. Journal of School Psychology, 73, 41–55. https://doi.org/10.1016/j.jsp.2019.03.001
- Powers, K., Hagans, K., & Linn, M. (2017). A mixed-method efficacy and fidelity study of check and connect. Psychology in the Schools, 54(9), 1019–1033. https://doi.org/10.1002/pits.22038
- Rocque, M., Jennings, W. G., Piquero, A. R., Ozkan, T., & Farrington, D. P. (2017). The importance of school attendance: Findings from the cambridge study in delinquent development on the life-course effects of truancy. Crime & Delinquency, 63(5), 592–612. https://doi.org/10.1177/0011128716660520
- Satorra, A., & Bentler, P. M. (2001). A scaled difference chi-square test for moment structure analysis. Psychometrika, 66(4), 507–514. https://doi.org/10.1007/BF02296192
- Scheerens, J., Witziers, B., & Steen, R. (2013). A meta-analysis of school effectiveness studies. Revista de Educacion, 2013(361), 619–645. https://doi.org/10.4438/1988-592X-RE-2013-361-235
- Thapa, A., Cohen, J., Guffey, S., & Higgins-D'Alessandro, A. (2013). A review of school climate research. Review of Educational Research, 83(3), 357–385. https://doi.org/10.3102/0034654313483907
- Van Der Woude, L., van Der Stouwe, T., & Stams, G. (2017). Differences between risk factors for truancy and delinquency in Dutch adolescents. Children and Youth Services Review, 73, 9–14. https://doi.org/10.1016/j.childyouth.2016.11.028
- Van Eck, K., Johnson, S. R., Bettencourt, A., & Johnson, S. L. (2017). How school climate relates to chronic absence: A multi–level latent profile analysis. Journal of School Psychology, 61, 89–102. https://doi.org/10.1016/j.jsp.2016.10.001
- Veenstra, R., Lindenberg, S., Tinga, F., & Ormel, J. (2010). Truancy in late elementary and early secondary education: The influence of social bonds and self-control— the TRAILS study. International Journal of Behavioral Development, 34(4), 302–310. https://doi.org/10.1177/0165025409347987
- Wang, M., & Degol, J. L. (2016). School climate: A review of the construct, measurement, and impact on student outcomes. Educational Psychology Review, 28(2), 315–352. https://doi.org/10.1007/s10648-015-9319-1
- Wang, M., & Dishion, T. J. (2012). The trajectories of adolescents’ perceptions of school climate, deviant peer affiliation, and behavioral problems during the middle school years. Journal of Research on Adolescence, 22(1), 40–53. https://doi.org/10.1111/j.1532-7795.2011.00763.x
- Wang, M., & Hofkens, T. L. (2019). Beyond classroom academics: A school-wide and multi-contextual perspective on student engagement in school. Adolescent Research Review, 5(4), 419–433. https://doi.org/10.1007/s40894-019-00115-z
- Way, N., Reddy, R., & Rhodes, J. (2007). Students’ perceptions of school climate during the middle school years: Associations with trajectories of psychological and behavioral adjustment. American Journal of Community Psychology, 40(3-4), 194–213. https://doi.org/10.1007/s10464-007-9143-y