Abstract
We report analyses of regional trends in overall and cause-specific mortality in Belarus for the period 1990–2007. We explore the respective spatial patterns and attempt to determine the factors responsible for the regional mortality variation. The results show that inter-regional mortality differentials tend to rise, mainly because of the growing advantage of the capital over other regions. The increasing variation is associated with diverging trends in mortality from external causes of death. Mortality tends to be higher in the eastern part of the country. Regional data show that changes in mortality are largely explained by alcohol and socio-economic conditions, as measured by unemployment and poverty rates. Cardiovascular and external-cause mortality are strongly associated with alcohol and unemployment, while poverty is an important predictor of suicide and homicide mortality. Clusters of elevated mortality from certain cancers located in the contaminated zone point to the possible impact of the Chernobyl accident.
Introduction
The unprecedented increase in mortality that took place in the countries of the former Soviet Union (FSU) in the early 1990s has been extensively documented (Bobadilla and Costello Citation1997; Shkolnikov et al. Citation2004). The literature suggests that a complex interplay of a number of factors, rather than a single determinant, was responsible for this sharp rise. There are thought to be three main determinants: the increase in alcohol consumption; the consequences of the socio-economic crisis, including psychological stress; and the deterioration of the health care system (Bobak et al. Citation1998, Citation2000; Brainerd Citation1998; McKee and Britton Citation1998; Cornia and Paniccià Citation2000; McKee Citation2001; Brainerd and Cutler Citation2005; Cockerham et al. Citation2006). It has also been pointed out that the acute health crisis of the 1990s came on the top of a long-standing crisis that had been observed in the region since the mid-1960s (Eberstadt Citation1981; Feshbach Citation1984; McKee Citation2006). For more than four decades, overall mortality had been rising owing to adverse trends in mortality from cardiovascular diseases and external causes of death at working ages (Shkolnikov et al. Citation1996). During the Soviet era, these negative mortality dynamics were interrupted between 1985 and 1988 only, because of the anti-alcohol campaign launched by the Soviet government in 1985. The short-term improvement was quickly followed by the subsequent deterioration. It is believed that the effect of the anti-alcohol campaign had a significant influence on mortality trends in the early 1990s (Shkolnikov and Nemtsov Citation1997).
Compared to the substantial evidence from studies of national populations, little is known about regional mortality trends and patterns in the FSU. A few studies of the geographical diversity of mortality were conducted for Russia. Most of them, however, examined either the pre-transition period or the early 1990s. Andreev (Citation1979), and later Shkolnikov (Citation1987), detected a south-west/north-east mortality gradient within Russia in periods around the population censuses of 1970 and 1979. Vallin et al. (Citation2005) identified significant differences between the south-west and the north-east of Russia in both overall mortality and cause-of-death patterns. Walberg et al. (Citation1998) found that the decline in life expectancy in the early 1990s did not affect all Russian regions equally. The fact that the greatest mortality increments were observed even in some of the wealthiest regions suggested the insufficiency of the ‘impoverishment’ explanation. Factors reflecting the severe effects of poorly conducted economic reforms—such as labour force turnover, social cohesion, and income inequality—were found to be associated with larger mortality increases.
Several studies of regional mortality trends were conducted in the Baltic countries. Kalediene and Petrauskiene (Citation2000) analysed mortality data in 55 administrative regions of Lithuania during the period 1988–96. Major towns were found to have lower mortality. Regional differences in cardiovascular mortality and mortality from external causes were mostly responsible for overall regional mortality variation. The regional differences in levels of urbanization, education, and marital status were associated with regional mortality differences, whereas no associations were observed with the distribution of health care resources, unemployment, and certain other aspects of well-being. Kalediene and Petrauskiene (Citation2004) reported growing inequalities in mortality between the urban and rural populations of Lithuania during the period of socio-economic transformation. The main factors proposed as responsible for the increased urban–rural mortality differential were greater social and psychological stress affecting the rural population, unhealthy lifestyles, inequalities in the accessibility of health care, and the lack of preventive programmes in rural areas. Krumins et al. (Citation2009) explored changes in regional differences in health and mortality in Estonia, Latvia, and Lithuania. They found that, during the transition period, geographical variation increased, particularly from diseases of the circulatory system. The authors argued that the observed geographical patterns in the three Baltic countries appeared to be influenced more by socio-economic and cultural factors specific to the geographic area (and related to the historical influences of neighbouring countries) than by the fact that this area belonged to a particular national territory.
A number of regional studies were conducted in the countries of Central and Eastern Europe, including Hungary and Poland (Józan and Forster Citation1999; Józan and Prokhorskas Citation1999; Kolodziej and Lopuszańska Citation2010). The case of the Czech Republic is particularly interesting, because, in contrast to what occurred in many other transition countries, there was actually an increase in life expectancy in the early 1990s. Within the Czech Republic, the mortality changes were found to be highly regionally differentiated, and the regional pattern of the mortality decline was associated with changes in mortality from diseases of the circulatory system, cancer, and external causes of death (Blažek and Dzúrová Citation2000; Dzúrová Citation2000; Spijker Citation2009).
Although there are many similarities between Belarus and its neighbouring countries, it should not be assumed that evidence obtained elsewhere (e.g., Russia) is applicable to Belarus. Among the countries of the former USSR, Belarus is distinctive in its socio-economic and demographic development. After the disintegration of the Soviet Union in 1991, the political and economic changes in the country were much less radical than they were in the neighbouring post-Soviet countries. This has influenced mortality trends in a particular way. As in the other Soviet republics, there was a considerable mortality increase in Belarus immediately after the dissolution of the USSR, but the magnitude of the crisis was less dramatic than elsewhere. The policy of gradualism chosen by Belarusian authorities seems to have lessened social pressure, and slowed down the increasing mortality in the early 1990s. However, the long-term deterioration in health has continued. In contrast to the Baltic countries, Belarus still has not overcome the health crisis which began during the Soviet era (Grigoriev et al. Citation2010).
The study reported in this paper was the first systematic analysis of regional mortality patterns in Belarus over the two decades following the transition in 1990. Our report contributes to the existing literature on health and mortality in the countries of the former USSR in three respects. First, it provides new evidence on the geographical diversity of overall and cause-specific mortality in Belarus. In contrast to previous studies, we examined the dynamics of regional mortality in Belarus in order to identify both the temporal changes and the cross-sectional differences in overall and cause-specific mortality over this period. Second, thanks to the availability of detailed cause-of-death mortality data, we were able to compare areas contaminated as a result of the Chernobyl accident with the rest of the country. The results of this analysis contribute to the debate on the impact of the Chernobyl accident on mortality. Finally, by performing a statistical analysis, we linked mortality to socio-economic indicators across regions, and tested the validity of various proposed mortality determinants.
Data and methods
Our analysis was based on official data from the National Committee of Statistics of Belarus (Belstat). These data included original unpublished detailed files on causes of death and mid-year population (exposure) by age, sex, type of residential area, and region. Detailed mortality data by large regions (‘oblast’ level) were available to us for the period Citation1997–2007. Similar data by lower-level territorial units, or cities and towns (‘rayon’ level), were available for the period 2003–07. In order to extend the analysis to the period before 1997, we had to rely on the limited set of officially published general mortality indicators. Data on socio-economic indicators used for the explanatory analysis of regional mortality variation were also taken from the official statistical publications.
A few remarks about the quality and reliability of data are also worth making. In general, mortality data in the countries of the European part of the former USSR, including Belarus, are considered to be reliable. Anderson and Silver (Citation1997, p. 130) have noted that the recent mortality data in these countries ‘are generally trustworthy, especially at the working ages’. On the basis of data quality indicators—such as the timeliness, completeness, and coverage of death registration, and the proportion of deaths assigned to ill-defined causes (1981–2001)—the WHO ranks Belarus as a country with mortality data of medium quality (Mathers et al. Citation2005).
The analysis was performed at two territorial levels: the regional, or ‘oblast’ level; and the district, or ‘rayon’ level. At the regional level, there were seven units: six oblasts plus the capital, Minsk, which is treated as a separate region (). On average, each oblast consists of about 20 rayons. At the rayon level, there are 118 rayons and 13 cities. The remaining small towns are included in their respective districts. While the administrative borders of districts have remained unchanged over time, there have been some minor changes: some cities that had been treated as separate units early in the period were later merged with their districts. To ensure data comparability, we had to go back and merge these cities with their corresponding districts.
Figure 1 Territorial division of Belarus: regions (oblast), districts (rayons), and cities
Source: www.diva-gis.org (base maps).
Before the analysis could be conducted, some rearrangement of the original data was necessary. First, the initial cause-specific mortality data were aggregated into a few groups of the principal causes of death in accordance with the two different classifications used in the statistical practices of Belarus during the analysed period—the Soviet classification of 1988 (1988–2001) and the abridged version of the ICD-10 (since 2002). The analysed items were aggregated in such a way that the transition to the ICD-10 in 2002 could not cause a notable distortion of time trends. The list of causes of death used in the further analysis is presented in . To ensure greater robustness of age-specific and cause-specific mortality, the rates were calculated for a 5-year period (2003–07) at the rayon level and for a 3-year period (2005–07) at the oblast level. Information about the absolute number of deaths at the rayon level (selected causes) is provided in . The rates obtained were then age-standardized using the European population standard (Waterhouse et al. Citation1976). Throughout the paper, these rates are referred to as the standardized death rates (SDRs). We also used an alternative mortality indicator, life expectancy at birth (official estimates), to explore general mortality trends.
To produce mortality maps, we used shape files for Belarus that were freely available on the DIVA-GIS website (DIVA-GIS Citation2010). These shapes were modified through a re-projection using ArcGIS 9.3™ (World Miller Cylindrical projection). In addition, 13 circles of different sizes representing Belarusian cities were added, with the capital, the regional centres, and the other towns treated as separate units in the use of vital statistics (see ).
The quintile method of classification was used to produce mortality maps. In the analysis of mortality patterns in the contaminated areas, we relied on the local indicators of spatial association (LISA) (see Anselin Citation1995, Citation2005). The LISA is often used to identify statistically significant clusters (or ‘hotspots’). The most useful representation of the LISA is the so-called LISA cluster map, in which there are five categories coded in accordance with the type of spatial autocorrelation. The high–high (high rates: high neighbours) and low–low (low rates: low neighbours) locations represent local spatial clusters. According to Anselin (Citation2005, p. 145), ‘… the cluster is classified as such when the value at the location (either high or low) is more similar to its neighbours … than would be the case under spatial randomness. Any location for which this is the case is labelled on the cluster map.’ High–low and low–high locations are spatial outliers. Statistically not-significant spatial autocorrelation is labelled as not significant. To obtain LISA, it was first necessary to decide on the spatial neighbourhood structure. Here, we relied on the first-order queen structure, which is widely used in spatial analyses. This structure assumes that the districts that share a common border are neighbours.
Because we could not obtain data for suitable explanatory variables at the district level, the analysis of mortality determinants was conducted at the regional level. For this purpose, we relied on a one-way fixed-effects panel regression model (for the general specification of the model, see Wooldridge Citation2002). As a result, predictors’ net effects were estimated. The model was applied separately for males and females, with the SDR for selected causes of death set as the dependent variables. Because the data we used in the regression analysis were not a typical ‘large N small T’ panel data set, greater caution was needed to ensure that the standard errors produced were robust to various disturbances. With this in mind, all of the models were adjusted for the presence of cross-sectional dependence, autocorrelation, and heteroscedasticity.
Results
Regional mortality trends and patterns
This section presents the analysis of mortality by the large regions, or oblasts, of Belarus. First, we explore the major inter-regional differences in overall mortality and how they change over time. Second, we report the analyses of cause-of-death mortality patterns, undertaken in order to identify the causes of death responsible for the inter-regional mortality variation.
Changes in all-cause mortality
At the beginning of the 1990s, Belarus experienced a significant reduction in life expectancy at birth, which was associated with the economic and political changes that came about with the dissolution of the USSR (Grigoriev et al. Citation2010). Between 1990 and 1995, mortality increased in all of the regions of Belarus, but the magnitude of this increase varied. For example, in the Brest oblast, the life expectancy of males declined by about 3 years, while in the capital, Minsk, the decrease was about 5 years ().
Table 1 Life expectancy (years) at birth by sex and its changes by region, Belarus 1990–2007
It seems that the population of Minsk (and, presumably, of other big Belarusian cities) was more vulnerable than other areas to the challenges of the early transition years, such as economic instability, hyperinflation, and falling standards of living. This observation is consistent with findings for Russia: in the first half of the 1990s, the steepest mortality increase was seen in two metropolitan cities, Moscow and St Petersburg (Shkolnikov et al. Citation1998). In the late 1990s, as the socio-economic situation stabilized, mortality trends in the capital recovered faster than elsewhere. Today, Minsk has the highest life expectancy among all of the regions, and the Brest oblast is in second place. The levels of and trends in mortality in the other Belarusian regions have been similar, with the possible exception of the Minsk oblast, which stands out as having the lowest life expectancy.
The differences in mortality between the Belarusian regions have grown in recent years. These differences are especially apparent for females, since their life expectancy was about the same in all of the regions in 1990. By 2007, the gap between the leader (Minsk) and the region with the lowest level of life expectancy (the Minsk oblast) had grown to about 3 years. In contrast, there have always been marked regional differences in life expectancy for men. Despite some improvements in recent years, the mortality of males in all of the regions still remains higher today than it was in pre-transitional Belarus. For females, on the other hand, life expectancy had returned to the 1990 level by 2007 in almost all of the regions; in the capital, it even exceeded the 1990 level by 1.5 years.
Changes in cause-specific mortality
The regional trends by principal classes of causes of death are presented in .
Figure 2 Age-standardized death rates (per 100,000 population) from main causes of death, both sexes by region, Belarus 1990–2007
Note: Death rates were standardized using the indirect method of standardization.
Source: Belstat Citation2009a.
The three main causes of death in Belarus and its regions are cardiovascular diseases (CVD), external causes, and cancers. Until the early 2000s, CVD mortality was growing in all of the regions of Belarus. This growth was somewhat less steep in Minsk-city, and from the mid-1990s, the gap between the capital and the other regions began to widen. In the most recent years, however, it has narrowed again following a notable mortality decline, which has been taking place in all of the regions. It is too early to say whether the latter change is a temporary fluctuation or a new long-term trend.
Apart from deaths caused by CVD, mortality from external causes has played an important role in shaping regional mortality patterns. This cause of death underwent an especially steep increase, coinciding with the increase in the regional mortality differential. Over the 1990s, mortality that was the result of violence rose sharply in the Vitebsk oblast, as well as in the capital. At the same time the increase was far less steep in, for example, the Brest oblast. Like CVD mortality, mortality from external causes has been declining over the last few years. In Minsk the improvement began in 1999, earlier than elsewhere. Today the two Belarusian regions that differ the most from the rest of the country in experiencing lower mortality from external causes are the capital and the Brest oblast.
The regional variation in cancer mortality has not been very pronounced, and in the most recent years, it has been diminishing. Generally, since 1999 cancer mortality has tended to decline in all regions. In the capital it has been slightly higher than elsewhere. Mortality trends from diseases of the respiratory system have varied considerably among the regions. In two regions, the Vitebsk and Grodno oblasts, it has been much higher than in the other oblasts. Mortality from diseases of the digestive system has been increasing in all of the regions, and this increase has been particularly noticeable in the Grodno oblast and Minsk-city.
A detailed profile of cause-specific regional mortality in Belarus is provided in . The crucial role of CVD mortality is apparent: it is responsible for more than half of all deaths in Belarus. Within this category, the majority of deaths are attributed to heart disease. The lowest SDR by heart disease is observed in the capital: 558 deaths for men and 269 deaths for women per 100,000 population. At the same time, the highest SDR by cerebrovascular diseases is also observed in the capital.
Mortality from external causes contributes substantially to these regional variations, but it is much more important for males than for females. The SDR of males from external causes of death varies from 183 (Minsk-city) to 318 (Vitebsk) deaths per 100,000 population. Three causes of death account for the majority of deaths within this category: accidental poisonings by alcohol, suicide, and other accidents.
Among all of the causes of death, mortality from cancers exhibits the lowest degree of regional variation. The inter-regional difference is more pronounced among females. The SDR from all cancers in Minsk-city is considerably higher than in the other regions of Belarus, while among males, it is just slightly above the national average. With respect to the composition of cancer mortality, there are no large differences between the regions. The leading causes of cancer mortality among men are cancers of the larynx, trachea, bronchus, and lungs, as well as stomach and prostate cancers. For women, the leading causes of cancer mortality are breast, uterine, and stomach cancers.
Although respiratory diseases are not among the main causes of mortality for males, they have a surprisingly large influence on inter-regional mortality differences. The impact of these diseases is certainly more pronounced than that of cancer mortality, and it is comparable to the influence of mortality from external causes of death. The regional variation in mortality from tuberculosis (TB) (especially among males) is also worth noting here. The data further suggest that, in all of the regions, mortality from diseases of the digestive system is determined by mortality from cirrhosis and fibrosis of the liver. Thus, this cause of death appears to be responsible for the increasing mortality trends for the whole category of digestive diseases (see ).
Small-area variation
This section is devoted to the analysis of mortality variation at the district level. First, we explore the spatial distribution of overall and cause-specific mortality. Second, we examine mortality patterns in the contaminated areas of Belarus.
Spatial distribution of overall and cause-specific mortality
The spatial distribution of overall mortality in Belarus has two distinctive features. First, mortality in the eastern part of the country tends to be higher than in the western part, and this pattern is slightly more pronounced for women ().
Figure 3 Age-standardized death rates (per 100,000 population) from all causes of death by sex, Belarus 2003–07
Note: Quintile method of classification was used to produce these and the following maps.
Source: Belstat official unpublished data.
To support this observation statistically, we made an arbitrary division of the districts according to their geographical location (either east or west). The west was defined as all districts of the Brest and Grodno oblasts, as well as the western half of the Minsk oblast. Statistically, being located in the eastern part of Belarus is associated with an increase in SDR by 141 deaths (standard error = 39) among males and 78 deaths (standard error = 18) among females, or by 7 and 8.5 per cent of the average mortality level, respectively.
Second, regardless of sex, there are significant variations in mortality across the country. In the period 2003–07, overall SDR within Belarus by area varies from about 1,500 to 3,000 deaths per 100,000 for men, and from 700 to 1,500 deaths per 100,000 for women. The mortality of females is roughly half that of men, and the sex mortality ratio does not vary much by area (mean = 2.19, minimum =1.90, maximum = 2.51, standard deviation = 0.12).
Belarusian cities and towns (the circles on the map) exhibit lower mortality than the other areas. In many cases, including that of the capital, mortality in the areas surrounding major cities is double that of the cities. This difference does not, however, always persist in the spatial distribution of cause-specific mortality ().
Figure 4 Age-standardized death rates (per 100,000 population) from main causes of death, both sexes, Belarus 2003–07
Source: As for .
The main causes of death responsible for the city/non-city mortality gap are CVD mortality and mortality from external causes of death. However, for some causes, such as cancers and diseases of the digestive system, mortality in cities is higher. Some of this difference can probably be explained by better diagnosis and registration of causes of death in the cities. For this reason, the patterns of regional differences in cause-specific mortality should be interpreted with caution.
For CVD mortality, higher mortality is found in central and eastern Belarus than in other places. Districts of the Mogilev oblast, together with neighbouring districts of the Minsk oblast, form a cluster of high-CVD mortality. SDR from external causes tends to be higher in the east than in the west, with the lowest mortality observed in districts of the Brest oblast. The mortality experience of the Vitebsk oblast is poorer than that of other regions: mortality from external causes in most of its districts is in either the highest or second-highest category.
An apparent cluster of high mortality from respiratory diseases is located in the northern part of the country. Like Vitebsk in the north, the Grodno oblast in the west exhibits high mortality from this cause of death. This region also has the highest mortality from diseases of the digestive system. The patterns of spatial distribution of mortality from cancers and infectious diseases appear to share some features. For both groups of causes, the spatial distribution is rather dispersed, with the districts with higher mortality predominately located in the east.
Mortality in contaminated areas
For a number of reasons, it is very difficult, if not impossible, to assess mortality attributable to the radiological impact of the Chernobyl disaster. First, there is a lack of reliable longitudinal data suitable for use by carefully designed epidemiological studies. Second, even if these data were available, it would be necessary to control for other risk factors, such as smoking and diet. So far, no studies of this kind have been conducted.
The fact that the Chernobyl accident, the anti-alcohol campaign, and the socio-economic crisis of the early 1990s closely coincided in time complicates studies based on population-level mortality data. The huge impact of the two later events on mortality overwhelms the much smaller impact of Chernobyl, and makes it hardly detectable. Finally, after the accident, many people who had been exposed to radiation migrated to other regions of Belarus and beyond. Nevertheless, the analysis of regional mortality in Belarus would be incomplete without addressing the potential mortality effects of the Chernobyl accident since the country was severely affected by its aftermath. Within the country, two regions suffered most: the Gomel and Mogilev oblasts (). The Gomel oblast suffered more: 20 out of 21 districts in this region were either fully or partially contaminated (UNDP Citation2005).
Figure 5 Areas of Belarus contaminated with radionuclides Te-132 and I-132 in April–May 1986
Source: Zuravkov and Mironov Citation2005, cited in Yablokov et al. Citation2007.
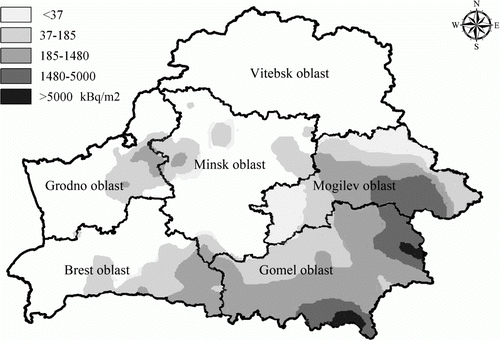
It might be expected that, if there had been a pronounced long-term effect of the accident, it would still be noticeable in the contaminated areas. The availability of the detailed cause-specific mortality data allowed us to compare cause-specific mortality patterns in contaminated areas with those in the rest of the country by each individual cause of death. However, for our further analysis, we selected only those causes of death for which an association with morbidity and mortality was well documented: cancer of the thyroid gland, leukaemia, lung cancer, and certain conditions originating in the perinatal period. Thyroid cancer caused by iodine fallout is considered to be one of the main health effects of the accident (Chernobyl Forum Citation2006). Leukaemia has been also linked to ionizing radiation (Preston et al. Citation1994), but there has been no clear evidence of such an effect in the populations affected by the Chernobyl accident (Sumner Citation2007). The relative risk of lung cancer among Chernobyl ‘liquidators’ (clean-up workers who were highly exposed to radiation) was found to be significantly higher than among the population not exposed to radiation (Okeanov et al. Citation2004). Higher mortality from conditions originating in the perinatal period in the contaminated zone might also be expected. Women who were of reproductive age over the past two decades were exposed to radiation as infants and children in 1986. Thus, they might be more predisposed to adverse birth outcomes and delivery complications.
Do mortality patterns in the contaminated areas of Belarus deviate from the rest of the country today, over two decades after the Chernobyl accident? To answer this question, we produced mortality maps for the various causes of death, and compared them with the pattern of the contamination with radionuclides Te-132 and I-132 presented in (the patterns of the contamination with other important radionuclides such as I-131 and Cs-137 look similar). The results, LISA cluster maps, are presented in . Here, we are particularly interested in the geographical location of high–high clusters, areas where the local mean is significantly higher than the global mean.
Figure 6 LISA cluster maps of mortality from selected causes of death, both sexes, Belarus 2003–07
Note: Calculations were performed using GeoDa™; p=0.05, 9,999 permutations.
Source: As for .
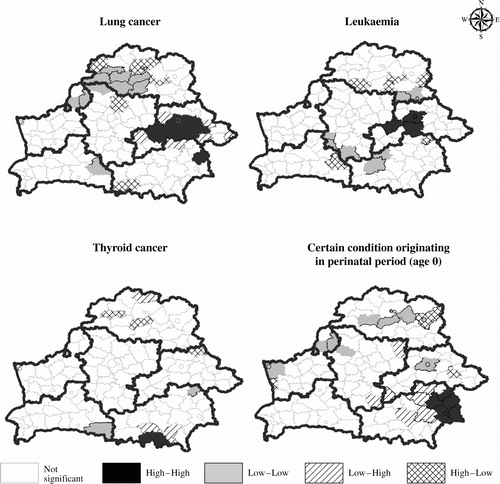
All of the clusters of highest mortality from selected causes of death are located either in the Mogilev or the Gomel oblasts, the areas of Belarus most affected by the Chernobyl accident. This is unlikely to be a coincidence. The geographical proximity of the clusters of highest mortality to the contaminated zone may be related to the impact of ionizing radiation. Nevertheless, this impact does not appear to be very pronounced or conclusively established. On the one hand, we can observe a cluster of high mortality from all cancers, including lung cancer and leukaemia in the Mogilev oblast. On the other hand, no similar cluster is found in the Gomel oblast, except for a small cluster of mortality from lung cancer in the western part and a cluster of thyroid cancer mortality in the south. In addition, a cluster of high mortality from perinatal causes can be observed in the Gomel oblast, while in the contaminated Mogilev oblast, no similar cluster can be seen (and there is even a cluster of the lowest mortality).
Analysis of factors associated with mortality
We now report an analysis that sought to determine the factors responsible for changes in mortality at the oblast level. Unfortunately, the choice of explanatory variables was limited owing to a lack of regional data on socio-economic indicators for the early 1990s. For this reason, we restricted our analysis to the period from 1997. We were, however, still left with a very limited list of covariates. To select variables for the final model, we took the following steps. First, from the whole set of available indicators, we selected only those for which an association with mortality was supported by the literature. We were looking for covariates which could capture the impact of alcohol consumption, psychological stress, the economic situation and the provision of health care. These factors are believed to be the main mortality determinants in the FSU (Cornia and Paniccià Citation2000; Brainerd and Cutler Citation2005). The initial set of explanatory variables included the following: urbanization (percentage of urban population); the real (adjusted for inflation) growth of industrial output (a global measure of economic performance analogous to the GDP at the national level); the ratio of the regional average salary to the country average and the crude divorce rate (as a measure capturing the psychosocial context). We then examined the pair-wise associations between each of these candidate variables and mortality (measured by SDR) by looking at the strength and significance of bivariate correlations. Variables having no or very weak associations with the dependent variable, as well as those causing severe multicollinearity, were eliminated from the analysis. As a result, only four predictors were used in the final model: unemployment, poverty, alcohol, and physicians per head (). Clearly, a number of socio-economic, environmental, and other factors still remained unobserved. In this case, applying the panel regression model with fixed effects was a reasonable solution, as it allowed us to control for unobserved heterogeneity. Furthermore, although we could not disentangle ethnic and cultural factors (our descriptive analysis suggested their possible relevance), the model still allowed us to control for differences in these time-invariant, region-specific contextual characteristics.
Table 2 Description and summary statistics of variables predicting mortality at the oblast level, Belarus 1997–2007
Because our independent variables were expected to be primarily related to the working-age population, and also because of the lower quality of death registration at older ages, the model was applied to adult ages (15–64) only. As response variables, we chose the SDR by all causes of death, and also the SDR by the two leading causes of death, which were diseases of the circulatory system and external causes of death. The choice of causes of death was also based on the assumption that they respond to changes in explanatory variables rather promptly. Thus, even though they were among the leading causes of death, cancers were not included in the analysis. The development of cancer is clearly driven by the accumulation of risk over a long period of time, and thus the contemporary factors studied here would not be expected to have an impact on cancer mortality.
The results of the multivariate analysis after controlling for fixed effects are presented in . They indicate that the covariates included in the model explain about 60 per cent of the variation in overall mortality of males.
Table 3 Multivariate analysis of factors associated with mortality from selected causes of death at ages 15–64 for males and females at the regional level, Belarus 1997–2007. (Panel regression model with fixed effects)
It appears that alcohol has a direct association with the overall mortality of males, and with mortality from all other selected causes of death. Unemployment is associated with all-cause mortality and CVD mortality, but its association with mortality from external causes (except suicide) is not statistically significant. Poverty is strongly associated with mortality from external causes of death, including suicide and homicide, but not with all-cause mortality and mortality from CVD. Finally, for all selected causes of death, the mortality effects of the variable physicians are not statistically significant.
In terms of the directions and the significance of the associations, the results obtained for females look very similar. All of the explanatory variables except for physicians are strongly associated with the mortality of females from all causes of death. An increase in the measure of alcohol abuse (accidental poisoning by alcohol) results in a statistically significant increase in mortality from all selected causes, but not from cerebrovascular diseases. The association between poverty and mortality from external causes is also in the expected direction; that is, it is direct and statistically significant.
Discussion
Study limitations
Before discussing the results, some issues of data quality and limitations of the study should be considered. One issue of data quality is the possibility of regional variations in the diagnosis and coding of causes of death. Coding practices and the interpretation of medical rules might vary across the country (especially in the period immediately following the adoption of the ICD-10 in 2002). However, this should not be an issue at the level of the broad groups of causes of death we used in the analysis.
One of the limitations of this study is that it relied on a relatively short time series. Unfortunately, we could not perform a detailed analysis of regional (oblast-level) mortality trends because no detailed, cause-specific series of mortality before the mid-1990s were available to us. The extension of regional mortality trends backwards is desirable since many important changes happened during the early transition years. In exploring mortality trends during these years, we had no alternative to using the highly aggregated official data. The extent of our analysis was also restricted by the availability of regional data on socio-economic indicators. It was very difficult to find trustworthy explanatory variables for the early 1990s, mainly because the national statistical system of Belarus at that time was in the process of development in these first years of independence.
Principal findings
In this study, we analysed regional trends of all-cause and cause-specific mortality, explored the spatial patterns of mortality and assessed the factors associated with mortality fluctuations in the regions of Belarus.
The analysis of overall mortality trends suggests that the inter-regional mortality differences in Belarus are not very pronounced, but that they have been increasing in recent years. This pattern can be seen in the growing mortality difference between the capital and the rest of the country. Apart from the capital, the Brest oblast has the highest life expectancy. In both regions, mortality from external causes of death is substantially lower than elsewhere in Belarus. The increasing regional mortality differentials are also predominatly explained by the diverging mortality rates from external causes of death. The leading cause of death, CVD mortality, explains a substantial part of the mortality gap between the capital and the rest of the country, but not between oblasts. Regional differences in cancer mortality are clearly not the cause of inter-regional mortality variation. In fact, they tend to diminish following the steady mortality decreases from these diseases in all of the regions of Belarus.
The analysis of spatial patterns of mortality yielded several interesting observations. First, overall mortality tends to be higher in the eastern part of Belarus. This east–west divide might have historical and cultural roots. On the one hand, the fact that until 1939 the entire territory of the Grodno oblast and the greater part of the modern Brest oblast belonged to Poland could have had an impact on recent demographic developments in western Belarus. This region may have its own peculiar cultural norms and behavioural patterns. On the other hand, elevated mortality in the eastern part of Belarus might be linked to its geographical proximity to Russia, the country of highest mortality in the region.
Second, in terms of observed cause-of-death mortality patterns, some Belarusian regions are unique. For example, how can the very high mortality from diseases of the digestive system in the Grodno oblast be explained? The analysis of specific causes of death belonging to this category of causes showed that mortality from cirrhosis and fibrosis of the liver is the major contributor to the phenomenon. Since this disease is clearly associated with alcohol, it is reasonable to suppose that drinking patterns (in particular, the type of alcohol consumed) in the Grodno oblast deviate from those in the rest of Belarus. Previous studies have linked the high incidence of liver cirrhosis in Hungary and Slovakia to the widespread consumption of homemade alcoholic beverages derived from plums, apricots, and peaches (Bosetti et al. Citation2007).
Another interesting observation is that there is a north–south mortality gradient in mortality from diseases of the respiratory system. This could be related to the specific climate conditions of northern Belarus or the proximity to highly polluted industrial centres (i.e., the petrochemical corporation ‘Polimir’ in Vitebsk oblast and the fertilizer company ‘Azot’ in Grodno). Other possible explanations include variations in the diagnosis of the causes of death.
Mortality from external causes definitely deserves particular attention since it largely determines the regional variation in all-cause mortality. The large cluster of low mortality from external causes located in the Brest region is unique for Belarus. So is the Brest region itself: the greater part of this oblast belongs to the area known as western ‘Polesia’, which is populated by people referred to as the western ‘Polishuki’. According to some researchers, these people are a Slavic ethnic group who differ from other Belarusians in that they speak their own dialect and possess specific anthropological features (Tserashkovich Citation2004). The peculiarities of the Brest region's culture, norms, traditions, and behavioural patterns might help explain specific mortality patterns found there.
An examination of the causes of death related to the radiological impact of the Chernobyl accident did not provide a clear picture. The fact that the majority of mortality ‘hotspots’ for cancers are located in the Mogilev and Gomel oblasts might have some significance. Further, the location of the cluster of high mortality from thyroid cancer in the most contaminated area in the southern part of the Gomel oblast is unlikely to be a coincidence. Yet the observed patterns are not sufficient to allow us to conclude that Chernobyl had a significant impact on recent mortality in the contaminated areas. First, the number of deaths from the causes involved is too small to make statistical inferences reliable. Second, a pronounced impact would have been reflected in a deviating pattern of overall and cause-specific mortality (especially mortality from cancers) in the contaminated districts, and it also would have influenced mortality patterns in the whole Mogilev and Gomel oblasts in a certain way. Yet the results of the analysis of the aggregated mortality data did not show such a deviating pattern. It would not be possible to obtain an accurate assessment of the health effects of the Chernobyl accident without detailed micro-level data that could link histories of exposure with individuals’ risks of disease and death. The lack of such data is probably a reason why no consensus has so far been reached about the extent to which the accident has affected population health (see Chernobyl Forum Citation2006; Yablokov et al. Citation2007).
The analysis of factors associated with mortality suggests the importance of three factors in explaining the mortality variation for males and females within oblasts: alcohol, unemployment, and poverty. It is not surprising that, of these factors, alcohol, acting as both an immediate and an intermediate mortality determinant, appears to be the most prominent. Excessive alcohol consumption has proven to be the most obvious mortality determinant in the FSU. For decades, it has had a strong impact on mortality trends (Meslé et al. Citation1992; Shkolnikov and Nemtsov Citation1997; Razvodovsky Citation2003). Recent epidemiological case–control studies have shown that mortality among the working-age population is strongly associated with alcohol consumption in Russia (Leon et al. Citation2007; Zaridze et al. Citation2009). Both in Russia and in Belarus, alcohol is known to be directly associated not only with mortality from external causes, but also with CVD mortality (McKee and Britton Citation1998; Malyutina et al. Citation2002; Razvodovsky Citation2009). The Belarusian regional data show that there is a direct relationship between alcohol and CVD mortality. The significant association between alcohol and suicide mortality is not surprising: alcohol dependency is known to be associated with depression and self-destructive behaviours, and these psychological characteristics predispose individuals to commit suicide (Kendall Citation1983).
Unlike the association between alcohol and mortality, the relationships between unemployment and mortality and between poverty and mortality in the FSU have been investigated less extensively. The available literature suggests that unemployment is an important determinant of mortality for adult males in the transition countries (Stuckler et al. Citation2009), and of suicide mortality in particular (Brainerd Citation2001). Belarusian regional data suggest that unemployment is directly related to overall mortality, CVD mortality, and suicide among males. Although the explanation of the relationship between unemployment and mortality may seem intuitively obvious, the causal links of this association are not straightforward because a number of confounding factors need to be taken into account. The effect of unemployment on mortality can be mediated through alcohol consumption, psychological stress, and material deprivation (Tomkins et al. Citation2007). The health-related selection effects (when poor health causes unemployment) complicate the relationship further (Lundin et al. Citation2010).
A strong association between the level of poverty and mortality caused by violence was observed for both men and women. While poverty was found to be strongly associated with overall and CVD mortality among women, no such association was seen among men. This might be explained by that fact that the socio-economic situation (which we measured by the poverty rate) might be of greater importance for the health status of females. However, the lack of consistency of the poverty–mortality association between the sexes might also indicate that the measure of poverty used in our analysis was not accurate enough. The same can be said about the variable physicians. In all models, this variable is inversely related to mortality, which suggests the relevance of health care. However, the fact that the association fails to reach statistical significance points to the need to search for better measures of the quality of health care.
The results of the regression analysis suggest that certain factors known to be associated with mortality in the FSU are also important in Belarus. Our findings are also consistent with the results of individual-level studies conducted in Russia. However, our quantitative relationships cannot be projected automatically to the individual level because of the potential ecological fallacy (Morgenstern Citation1995).
Further research on regional mortality in Belarus can be enriched by extending the period of observation backwards through the collection of regional mortality data from the archives. It would also be useful to expand and improve the set of explanatory variables by incorporating into the model predictors reflecting, for example, ethnicity and inequality in income distribution. Comparative regional studies across neighbouring countries that have common historical and cultural backgrounds (e.g., Belarus vs. Poland, Lithuania, Russia, and the Ukraine) could be also useful for helping us to better understand recent demographic processes.
Notes
1. Pavel Grigoriev is at the Max Planck Institute for Demographic Research, Konrad-Zuse-Straße 1, 18057 Rostock, Germany. E-mail: [email protected]. Gabriele Doblhammer-Reiter is at the Max Planck Institute for Demographic Research and the University of Rostock. Vladimir Shkolnikov is at the Max Planck Institute for Demographic Research and the New Economics School, Russia.
2. This study was conducted within the framework of the joint ANR-DFG project ‘European Divergence and Convergence in Causes of Death’. We are very grateful to the three anonymous reviewers for their constructive comments and suggestions.
References
- Anderson , Barbara A. and Silver , Brian D. 1997 . “ Issues of data quality in assessing mortality trends and levels in the New Independent States ” . In Premature Death in the New Independent States , Edited by: Bobadilla , J. L. , Costello , C. and Mitchell , F. 120 – 155 . Washington , DC : National Academy Press .
- Andreev , Evgueni M. 1979 . “ Prodolzhitel'nost’ zhizni v SSSR: differentsialniy analiz [Length of life in the USSR: a differential analysis] ” . In Prodolzhitel'nost’ Zhizni: Analiz i Modelirovaniye [Length of Life: Analysis and Modelling] , Edited by: Andreev , Evgueni and Vishnevski , Anatoli . 136 Moskwa : Statistika .
- Anselin , Luc. 1995 . Local indicators of spatial association—LISA . Geographical Analysis , 27 ( 2 ) : 93 – 115 . doi: 10.1111/j.1538-4632.1995.tb00338.x
- Anselin , Luc. 2005 . Exploring Spatial Data with GeoDa™: A Workbook , Revised Version , 6 March 2005 . Santa Barbara , CA : Center for Spatially Integrated Social Science . Available: http://www.csiss.org/ (accessed: 21 May 2010) .
- Belstat . 1997–2007 . Raschody i Dochody Naseliniya Respubliki Belarus [Expenditures and Income of the Population of Belarus]. Annual Statistical Publications . Minsk : National Committee of Statistics of Belarus (Belstat) .
- Belstat . 2009a . Population of the Republic of Belarus. Statistical Yearbook . Minsk : National Committee of Statistics of Belarus , 436
- Belstat . 2009b . Regiony Respubliki Belarus [The Regions of the Republic of Belarus]. Statistical Yearbook . Minsk : National Committee of Statistics of Belarus , 870
- Blažek , Jiri and Dzúrová , Dagmar . 2000 . “ The decline of mortality in the Czech Republic during the transition period: a counterfactual case study ” . In The Mortality Crisis in Transitional Economies , Edited by: Cornia , G. A. and Paniccià , R. 303 – 327 . Oxford : Oxford University Press .
- Bobadilla , José L. and Costello , Christine A. 1997 . “ Premature death in the Independent States: overview ” . In Premature Death in the New Independent States , Edited by: Bobadilla , J. L. , Costello , C. and Mitchell , F. 1 – 33 . Washington , DC : National Academy Press .
- Bobak , Martin , Pikhart , Hynek and Marmot , Michael . 1998 . Socioeconomic factors, perceived control and self-reported health in Russia. A cross-sectional survey . Social Science and Medicine , 47 ( 2 ) : 269 – 279 . doi: 10.1016/S0277-9536(98)00095-1
- Bobak , Martin , Pikhart , Hynek , Rose , Richard , Herzman , Clyde and Marmot , Michael . 2000 . Socioeconomic factors, material inequalities, and perceived control in self-rated health: cross-sectional data from seven post-communist countries . Social Science and Medicine , 51 ( 9 ) : 1343 – 1350 . doi: 10.1016/S0277-9536(00)00096-4
- Bosetti , Cristina , Levi , Fabio , Lucchini , Franca , Zatonski , Witold A. , Negri , Eva and Vecchia , Carlo La . 2007 . Worldwide mortality from cirrhosis: an update to 2002 . Journal of Hepatology , 46 ( 5 ) : 827 – 839 . doi: 10.1016/j.jhep.2007.01.025
- Brainerd , Elizabeth. 1998 . Market reform and mortality in transition economies . World Development , 26 ( 11 ) : 2013 – 2027 . doi: 10.1016/S0305-750X(98)00096-5
- Brainerd , Elizabeth. 2001 . Economic reform and mortality in the former Soviet Union: a study of the suicide epidemic in the 1990s . European Economic Review , 45 ( 2001 ) : 1007 – 1019 . doi: 10.1016/S0014-2921(01)00108-8
- Brainerd , Elizabeth and Cutler , David M. 2005 . Autopsy on an empire: understanding mortality in Russia and the Former Soviet Union . Journal of Economic Perspectives , 19 ( 1 ) : 107 – 130 . doi: 10.1257/0895330053147921
- Chernobyl Forum . 2006 . Chernobyl's Legacy: Health, Environmental and Socio-economic Impacts and Recommendations to the Governments of Belarus, the Russian Federation and Ukraine , Chernobyl Forum: 2003–2005, Second Revised Version . Vienna : IAEA . Available: http://www.iaea.org (accessed: 26 October 2009) .
- Cockerham , William C. , Hinotea , Brian P. and Abbott , Pamela . 2006 . Psychological distress, gender, and health lifestyles in Belarus, Kazakhstan, Russia, and Ukraine . Social Science and Medicine , 63 ( 9 ) : 2381 – 2394 . doi: 10.1016/j.socscimed.2006.06.001
- Cornia , Giovanni A. and Paniccià , Renato . 2000 . “ The transition mortality crisis: evidence, interpretation, and policy responses ” . In The Mortality Crisis in Transitional Economies , Edited by: Cornia , G. A. and Paniccià , R. 3 – 37 . Oxford : Oxford University Press .
- DIVA-GIS . 2010 . Portal containing free spatial data . Available: http://www.diva-gis.org/ (accessed: 10 June 2010) .
- Dzúrová , Dagmar. 2000 . Mortality differentials in the Czech Republic during the post-1989 socio-political transformation . Health & Place , 6 ( 4 ) : 351 – 362 . doi: 10.1016/S1353-8292(00)00016-2
- Eberstadt , Nick. 1981 . The health crisis in the USSR , The New York Review of Books , 19 February : 23 – 31 ( reprinted in International Journal of Epidemiology 35 1 : 384–394, 2006 ).
- Feshbach , Murray. 1984 . Soviet health problems . Proceedings of the Academy of Political Science , 35 ( 3 ) : 81 – 97 . doi: 10.2307/1174119
- Grigoriev , Pavel , Shkolnikov , Vladimir , Andreev , Evgueni , Jasilionis , Domantas , Jdanov , Dmitri , Meslé , France and Vallin , Jacques . 2010 . Mortality in Belarus, Lithuania, and Russia: divergence in recent trends and possible explanations . European Journal of Population , 26 ( 3 ) : 245 – 274 . doi: 10.1007/s10680-010-9210-1
- Józan , P. and Forster , D. P. 1999 . Social inequalities and health: ecological study of mortality in Budapest, 1980–3 and 1990–3 . British Medical Journal , 318 ( 7188 ) : 914 – 915 .
- Józan , Péter and Prokhorskas , Remigijus . 1999 . Atlas of Leading and ‘Avoidable’ Causes of Death in Countries of Central and Eastern Europe , Budapest : Hungarian Central Statistical Office .
- Kalediene , Ramune and Petrauskiene , Jadvyga . 2000 . Regional life expectancy patterns in Lithuania . European Journal of Public Health , 10 ( 2 ) : 101 – 104 . doi: 10.1093/eurpub/10.2.101
- Kalediene , Ramune and Petrauskiene , Jadvyga . 2004 . Socio-economic transition, inequality, and mortality in Lithuania . Economics and Human Biology , 2 ( 1 ) : 87 – 95 . doi: 10.1016/j.ehb.2003.12.001
- Kendall , R. E. 1983 . Alcohol and suicide . Substance and Alcohol Actions/Misuse , 4 ( 2/3 ) : 121 – 127 .
- Kolodziej , H. and Lopuszańska , M. 2010 . Regional differences in premature mortality in Poland [in Polish] . Przeglad Epidemiologiczny , 64 ( 4 ) : 543 – 550 .
- Krumins , Juris , Domantas Jasilionis , Mall Leinsalu , and Vlada Stankuniene . 2009 . Changes of geographical mortality differences in the three Baltic countries during the period of socio-economic transformation . Paper presented at the IUSSP 26th International Population Conference , Marrakech .
- Leon , David A. , Saburova , Lyudmila , Tomkins , Susannah , Andreev , Evgueny , Kiryanov , Nikolay , McKee , Martin and Shkolnikov , Vladimir M. 2007 . Hazardous alcohol drinking and premature mortality in Russia: a population based case–control study . Lancet , 369 ( 9578 ) : 2001 – 2009 . doi: 10.1016/S0140-6736(07)60941-6
- Lundin , A. , Lundberg , I. , Hallsten , L. , Ottosson , J. and Hemmingsson , T. 2010 . Unemployment and mortality—a longitudinal prospective study on selection and causation in 49321 Swedish middle-aged men . Journal of Epidemiology and Community Health , 64 ( 1 ) : 22 – 28 . doi: 10.1136/jech.2008.079269
- Malyutina , Sofia , Bobak , Martin , Kurilovitch , Svetlana , Gafarov , Valery , Simonova , Galina , Nikitin , Yuri and Marmot , Michael . 2002 . Relation between heavy and binge drinking and all-cause and cardiovascular mortality in Novosibirsk, Russia: a prospective cohort study . Lancet , 360 ( 9344 ) : 1448 – 1454 . doi: 10.1016/S0140-6736(02)11470-X
- Mathers , Colin D. , Fat , Doris Ma , Inoue , Mie , Rao , Chalapati and Lopez , Alan D. 2005 . Counting the dead and what they died from: an assessment of the global status of cause of death data . Bulletin of the World Health Organization , 83 ( 3 ) : 161 – 240 .
- McKee , Martin and Britton , Annie . 1998 . The positive relationship between alcohol and heart disease in Eastern Europe: potential physiological mechanisms . Journal of the Royal Society of Medicine , 91 ( 8 ) : 402 – 407 .
- McKee , Martin. 2001 . “ The health effects of the collapse of the Soviet Union ” . In Poverty and Inequality in Health , Edited by: Leon , D. and Walt , G. 17 – 36 . Oxford : Oxford University Press .
- McKee , Martin. 2006 . Commentary: The health crisis in the USSR: looking behind the facade . International Journal of Epidemiology , 35 ( 6 ) : 1398 – 1399 . doi: 10.1093/ije/dyl237
- Meslé , France , Shkolnikov , Vladimir and Vallin , Jacques . 1992 . Mortality by cause in the USSR population in the 1970–1987: the reconstruction of time series . European Journal of Population , 8 ( 4 ) : 281 – 308 . doi: 10.1007/BF01796624
- Morgenstern , H. 1995 . Ecologic studies in epidemiology: concepts, principles, and methods . Annual Review of Public Health , 16 : 61 – 81 . doi: 10.1146/annurev.pu.16.050195.000425
- Okeanov , A. E. , Sosnovskaya , E. Y. and Priatkina , O. P. 2004 . A national cancer registry to assess trends after the Chernobyl accident . Swiss Medical Weekly , 134 ( 43 ) : 645 – 649 .
- Preston , Dale L. , Kusumi , Shizuyo , Tomonaga , Masao , Izumi , Shizue , Ron , Elaine Kuramoto , Atsushi . 1994 . Cancer incidence in atomic bomb survivors. Part III: leukemia, lymphoma and multiple myeloma, 1950–1987 . Radiation Research , 137 ( 2 Suppl ) : 68 – 97 . doi: 10.2307/3578893
- Razvodovsky , Yury E. 2003 . Alcohol and Mortality Crisis in Belarus , Grodno : Medical University Press .
- Razvodovsky , Yury E. 2009 . Aggregate level beverage specific effect of alcohol sale on myocardial infarction mortality rate . Adicciones , 21 ( 3 ) : 229 – 237 .
- Shkolnikov , Vladimir M. 1987 . Geograficheskiye faktori prodoljitelnosti jizni [Geographical factors of length of life] . Izvestiya AN SSSR, Seriya Geograficheskaya [Academy of Sciences of the USSR] , 3 ( 12 ) : 35 – 44 .
- Shkolnikov , Vladimir , Meslé , France and Vallin , Jacques . 1996 . Health crisis in Russia. I. Recent trends in life expectancy and causes of death from 1970 to 1993, II. Changes in causes of death: a comparison with France and England and Wales (1970 to 1993) . Population: An English Selection , 8 : 123 – 190 .
- Shkolnikov , Vladimir M. and Nemtsov , Alexander . 1997 . “ The anti-alcohol campaign and variations in Russian mortality ” . In Premature Death in the New Independent States , Edited by: Bobadilla , J. L. , Costello , C. and Mitchell , F. 239 – 261 . Washington , DC : National Academy Press .
- Shkolnikov , Vladimir M. , Cornia , Giovanni A. , Leon , David A. and Meslé , France . 1998 . Causes of the Russian mortality crisis: evidence and interpretations . World Development , 26 ( 11 ) : 1995 – 2011 . doi: 10.1016/S0305-750X(98)00102-8
- Shkolnikov , Vladimir M. , Andreev , Evgueni M. , Leon , David A. , McKee , Martin , Meslé , France and Vallin , Jacques . 2004 . Mortality reversal in Russia: the story so far . Hygiea Internationalis: An Interdisciplinary Journal for the History of Public Health , 4 ( 1 ) : 29 – 80 . doi: 10.3384/hygiea.1403-8668.044129
- Spijker , Jeroen. 2009 . Explanations for the age, sex, spatial and temporal structure of Czech mortality for the period 1987–97 . Environment and Planning A , 41 ( 3 ) : 682 – 702 . doi: 10.1068/a40223
- Stuckler , David , King , Lawrence and McKee , Martin . 2009 . Mass privatisation and the post-communist mortality crisis: a cross-national analysis . Lancet , 373 ( 9661 ) : 399 – 407 . doi: 10.1016/S0140-6736(09)60005-2
- Sumner , David. 2007 . Health effects resulting from the Chernobyl accident . Medicine, Conflict and Survival , 23 ( 1 ) : 31 – 45 . doi: 10.1080/13623690601084583
- Tomkins , S. , Saburova , L. , Kiryanov , N. , Andreev , E. , McKee , M. , Shkolnikov , V. and Leon , D. 2007 . Prevalence and socio-economic distribution of hazardous patterns of alcohol drinking: study of alcohol consumption in men aged 25–54 years in Izhevsk, Russia . Addiction , 102 ( 4 ) : 544 – 553 . doi: 10.1111/j.1360-0443.2006.01693.x
- Tserashkovich , P. V. 2004 . Ethnicheskay Istoriya Belarusi XIX–nachala XX Veka: v Kontexte Centralno-Vostochnoi Evropy [Ethnic History of Belarus of the XIXth–Beginning of the XXth Century: In Context of Central-Eastern Europe] , Minsk : Belarussian State University .
- UNDP . 2005 . Belarus: Addressing Imbalances in the Economy , National Human Development Report 2004/2005 . Minsk , , Belarus : UNDP .
- Vallin , Jacques , Andreev , Evgeni , Meslé , France and Shkolnikov , Vladimir . 2005 . Geographical diversity of cause of death patterns and trends in Russia . Demographic Research , 12 ( 13 ) : 323 – 380 . doi: 10.4054/DemRes.2005.12.13
- Walberg , Peder , McKee , Martin , Shkolnikov , Vladimir , Chenet , Laurent and Leon , David A. 1998 . Economic change, crime and Russian mortality crisis: a regional analysis . British Medical Journal , 317 ( 7154 ) : 312 – 318 . doi: 10.1136/bmj.317.7154.312
- Waterhouse , J. A. H. , Muir , C. S. , Cornea , P. and Powell , J. 1976 . Cancer Incidence in Five Continents , Vol. III , 454 – 459 . Lyon : International Agency for Research on Cancer .
- Wooldridge , Jeffrey M. 2002 . Econometric Analysis of Cross Section and Panel Data , Cambridge , MA : MIT Press .
- Yablokov , A. V. , V. B. Nesterenko , and A. B. Nesterenko . 2007 . Chernobyl’: Posledstviya Katastrophy dlya Cheloveka i Prirody [Chernobyl: Consequences of the Catastrophe for People and the Environment] . Sankt-Petersburg : Nauka . Available: http://www.rus-green.ru/publications/fil_yablokov2.pdf (accessed: 23 July 2010) .
- Zaridze , David , Brennan , Paul , Boreham , Jillian , Boroda , Alex , Karpov , Rostislav Lazarev , Alexander . 2009 . Alcohol and cause-specific mortality in Russia: a retrospective case–control study of 48 557 adult deaths . Lancet , 373 ( 9682 ) : 2201 – 2214 . doi: 10.1016/S0140-6736(09)61034-5
- Zuravkov , V. V. and Mironov , V. P. 2005 . Ispol'zovanie GIS-technologii pri ocenke zagryzneniya territorii RB radionuklidami ioda na aktivnoi stadiii [Using GIS technology in the assessment of the contamination of the territory of the Republic of Belarus with radionuclides of iodine] . Izvestiya Belorusskoy Ingenernoy Akademyi , 2 ( 20 ) : 187 – 189 .