
Abstract
We describe a regression-based approach to the modelling of age-, order-, and duration-specific period fertility, using retrospective survey data. The approach produces results that are free of selection biases and can be used to study differential fertility. It is applied to Demographic and Health Survey data for Ethiopia, Kenya, Tanzania, and Zimbabwe to investigate differential trends in fertility by education. Parity progression fell and the intervals following each birth lengthened between the 1970s and 2000s in all four countries. Fertility fell most among women with secondary education. In contrast to other world regions, postponement of successive births for extended periods accounted for much of the initial drop in fertility in these African countries. However, family size limitation by women with secondary education in Ethiopia and Kenya and longer birth spacing in Zimbabwe also played significant roles. Thus, birth control is being adopted in Eastern Africa in response to diverse changes in fertility preferences.
Introduction
Recent years have seen renewed interest in the transition to low fertility in sub-Saharan Africa. Significant falls in mortality have occurred, which, according to classical demographic transition theory, should bring about fertility decline. However, the decline in fertility in Africa has lagged behind that seen elsewhere. The 2015 revision of World Population Prospects (UN Population Division Citation2015) forecasts that, of the 2.4 billion people who are expected to join the global population between 2015 and 2050, 1.3 billion will be in Africa. However, continental- and national-level statistics can mask important differential trends in fertility among subgroups of women. This research models age-, order-, and duration-specific period fertility among women with different educational levels in four countries in Eastern Africa.
Although fertility is of central interest to demography, the analysis of birth histories collected in Demographic and Health Surveys (DHS) has seldom progressed beyond the calculation of age-specific rates for subgroups of women. This is because such analyses face two interrelated challenges. First, it is impossible to disaggregate the data from a survey of 5,000–20,000 women into the full array of subgroups needed for a refined analysis of fertility and still estimate fertility rates for each subgroup with sufficient precision to be of value. Second, data on fertility by parity and interval duration supplied by women who have yet to reach the end of their childbearing lives are plagued by potential selection biases. Any woman aged less than 50 who has reached a particular parity has done so more rapidly than the additional women who will achieve the same parity by the end of their childbearing lives. Unavoidably, therefore, all parity-specific estimates of fertility made from fertility survey data are based on women who have been selected for rapid childbearing.
The obvious strategy with which to address the second issue exacerbates the first one. It is to calculate fertility rates for different periods and subgroups of women of the same age, parity, and interval duration (Rodríguez and Hobcraft Citation1980). Allowing for all three variables would enable analysts to compare women who have reached the same stage of the family building process at the same age. The problem is that to estimate each of these rates individually would require a sample many times the size of the DHS interview samples.
Fortunately, one can largely escape this dilemma by abandoning classical methods of analysis and modelling the array of rates using some form of multiple regression. Somewhat surprisingly, the literature contains rather few studies that have adopted this approach to the analysis of fertility survey data. Many notable champions of the study of fertility by parity as well as age (Feeney and Yu Citation1987; Ní Bhrolcháin Citation1987; Rallu and Toulemon Citation1994) have used classical methods to advance their arguments, sidestepping the problem of sample size by basing their analyses on census data, vital statistics, or sample data for countries such as China, whose absolute size is huge.
In earlier research, one of the authors adopted the Brass and Juárez (Citation1983) approach to the analysis of parity progression and order- and duration-specific fertility. Although this is an unconventional method, it remains classical in nature, rather than being based on statistical modelling. Thus, it has limited potential as a way of investigating fertility differentials. Moreover, while Moultrie et al. (Citation2012) described a regression-based approach to order- and duration-specific fertility and used it to cross-check results that they arrived at using Brass and Juárez’s paired-cohort comparison method, they reverted to the latter to produce most of their results.
Attention to changes in order- and duration-specific fertility is particularly important when examining fertility change in sub-Saharan Africa. Birth spacing is an important influence on fertility in many African populations. Evidence from several contexts across the continent has shown that the spacing of births is regarded as important for the health of both the mother and of her youngest child (Bledsoe et al. Citation1994; Howard and Millard Citation1997; Wolf et al. Citation2008). It is recognized that repeated pregnancy, childbirth, and breastfeeding are challenges to women’s health. Thus, spacing births becomes a strategy for ensuring that women are able to continue childbearing throughout their fecund years (Bledsoe et al. Citation1994).
Traditionally, birth spacing in most African societies was controlled by two mechanisms: prolonged breastfeeding and post-partum abstinence. Prolonged periods of intensive breastfeeding delay the return of a woman’s menses after childbirth, thus preventing conception (Santow Citation1987). In addition, women were often expected to abstain from sexual intercourse during the post-partum period (Murdock Citation1954; Caldwell and Caldwell Citation1981; Lesthaeghe et al. Citation1981; Egbuonu et al. Citation2005).
The importance of birth spacing led Caldwell et al. (Citation1992) to predict that fertility decline in sub-Saharan Africa would occur among women of all age groups and—by implication—parities, not just among older women with large families (as was the case in Europe and North America). This statement has spawned a debate about whether the pattern of fertility decline in this region is exceptional. Johnson-Hanks (Citation2007) found that the pattern of parity-specific birth spacing among African women who had sought to limit their fertility resembled that of women who had never sought to control their childbearing. On the other hand, Bongaarts and Casterline (Citation2013) found no evidence that sub-Saharan Africa is experiencing a new type of transition in which declining age-specific rates at older ages play a smaller role in the early stages of transition than in other regions.
Recent research has shown that waiting times from one birth to the next have lengthened significantly among women in sub-Saharan Africa. In the 1960s and 1970s, median waiting times were between 27 and 33 months across the continent. Since then, the durations at which 50 per cent of women progress to another birth have lengthened across the region (Moultrie et al. Citation2012). The trend has been most marked in Southern Africa and the largest increases have occurred in South Africa, where the median time to having another birth for women aged 25–29 rose to 72 months (six years) by the late 1990s (Moultrie and Timæus Citation2003). In Namibia, Zimbabwe, and Lesotho, these durations stood at approximately 45 months. Substantial changes have also been observed outside Southern Africa: in Ghana, the median duration to next birth rose from 32 months in the mid-1960s to 45 months in 2005–10. Although the lengthening of waiting times has been greatest among populations where the transition to low fertility has been most pronounced, the trend can also be observed among women in countries with higher fertility and lower contraceptive use. Finally, in the populations examined, the lengthening of times to next birth varied little by age or parity (Moultrie et al. Citation2012).
Timæus and Moultrie (Citation2008) argued that understanding this pattern of fertility change requires scholars of population to re-examine the way we theorize and categorize fertility intentions. They proposed the concept of postponement as a third family building strategy, which is distinct from both family size limitation and birth spacing, that may explain the lengthening of birth intervals in sub-Saharan Africa. Postponers are defined as women who seek to avoid a pregnancy in the current moment for reasons that are not a function of their childbearing history. In contrast, spacers are defined as women who seek to avoid a pregnancy in the current moment for reasons that are a function of the age of their youngest child. Thus, postponement is conceptually different from birth spacing because it recognizes that women may seek to delay conception for reasons that are not contingent on the age of their youngest child. For example, they may be concerned about their finances and seek to delay conception in order to save up money before the birth of their next child or because they are experiencing difficulties in their relationship. Postponement is also distinct from family limitation because it acknowledges that women may not have decided that they do not want to have another child ever, but have only decided that they do not want any more children at present.
In this paper, we apply the regression model that Moultrie et al. (Citation2012) proposed for the analysis of retrospective birth history data to the analysis of differential trends in fertility. We describe in detail how it can be used to model differences in patterns of fertility by duration since last birth that are diagnostic of the implementation of different family building strategies by means of birth control. Our substantive analysis then focuses on the dynamics of order- and duration-specific fertility and the changing family building strategies emerging in four Eastern African countries during the initial phases of fertility transition (1965–2010). In particular, we examine differential trends in fertility according to level of education, while simultaneously controlling for the urban–rural composition of the population.
Data
This study uses the birth history data collected in the DHS from four Eastern African countries: Ethiopia, Kenya, Tanzania, and Zimbabwe. These countries have all conducted three or more DHS and obtained nationally representative data on corresponding large samples of births. We use all the surveys available at the time of analysis. The dates of the surveys and the corresponding total number of maternities per country are shown in .
Table 1 Countries and years of Demographic and Health Surveys (DHS) analysed
Table A1 in the supplementary material presents the number of births and exposure time on which the analysis is based for each of the four countries and for women with differing levels of schooling in each country.
A model of period fertility
Rallu and Toulemon (Citation1994) pointed out that to establish a rationale for the calculation of synthetic cohort measures of fertility for a specified period, the analyst must assume that fertility depends only on conditions at that time. Therefore, the fertility rates from which such measures are calculated should adjust as far as possible for the impact of past fertility on the composition of the population so that they reflect only current conditions. The intersection of age, parity, and interval duration in a particular period defines demographically homogenous groups of women. Thus, age-order-duration-specific period fertility rates adjust for the primary differences between populations in the demographic characteristics of women of childbearing age. They can be combined using life table methods to generate period parity progression ratios (PPRs—probabilities that a woman of a given parity will have a further birth) and total fertility (Rallu and Toulemon Citation1994).
The analysis of parity progression and birth intervals using fertility history data requires methods that address the issues of selectivity and censoring. As all women aged 15–49 are eligible for interview in the DHS, many of the respondents have not yet come to the end of their reproductive lifespan. Selectivity arises in the right-truncated birth history data that they supply, because between-couple levels of fecundity are heterogeneous. Thus, even in populations which do not practise birth control, fertility rates decline with interval duration as more fecund couples conceive and go on to begin new birth intervals. Similarly, high parity women are selected for high fecundity and, in contracepting populations, for pronatalist preferences and are prone to shorter birth intervals than lower parity women (Timæus and Moultrie Citation2013). At each parity, younger women are more highly selected than an older group of women of the same parity.
Additional complications arise from the censoring of birth histories collected from women of childbearing age. Women’s current birth intervals are interrupted by the interview and a proportion of them will go on to have another birth in the future. Although one can obtain unbiased estimates that allow for this using the methods of survival analysis, censoring makes it impossible to calculate final PPRs and birth interval distributions for cohorts directly from fertility survey data (Rodríguez and Hobcraft Citation1980). Moreover, this limitation of birth history data cannot simply be dealt with by focusing only on inter-birth (closed) intervals since they are biased towards short durations, whereas open intervals are biased towards long durations (Rindfuss et al. Citation1982).
Various methods that are designed to control for the effects of selectivity and censoring have been proposed for examining trends in birth intervals. Hobcraft and colleagues described a life table approach (Rodríguez and Hobcraft Citation1980; Hobcraft and McDonald Citation1984; Rodríguez et al. Citation1984; Hobcraft and Rodríguez Citation1992) that looks at the proportion of women having a subsequent birth. The biases are dealt with by disaggregating the life tables by variables that control the strength of selection. Brass and Juárez (Citation1983) used a paired-cohort truncation approach, which compares a series of life table estimates for pairs of successive age groups with children born within the last five years eliminated for the older group in each pair. Using this procedure, the two life table estimates are made comparable, as both have similar levels of selection bias and are equally age-censored. In the current paper, we adopt and extend a third approach: the regression method outlined by Moultrie et al. (Citation2012). This method is advantageous for two reasons: (1) it is less afflicted by sample size problems than classical methods; and (2) it is suited to the measurement of fertility on a period as opposed to a cohort basis, unlike the Brass and Juárez method (Moultrie et al. Citation2010, Citation2012; Timæus and Moultrie Citation2013).
Open and closed intervals
The length of closed birth intervals can be studied simply by measuring the duration of the intervals ended by births occurring in a specific year or period. So long as the analysis includes all intervals ending in the period, and not just women’s most recent births, it will yield unbiased measures for the population at that time. Although they are straightforward, such analyses can reveal nothing about fertility or parity progression during the period of interest. To investigate these aspects of women’s reproductive histories, one must also consider the exposure of those women who do not have any births during the period. In principle, the calculations are straightforward and can be conducted on a period basis (Timæus Citation2015). However, they can be tricky to implement without software designed for the purpose. A count is made of the births in the period, cross-classified by women’s parity, the time since their last birth, and their age if required. Women’s exposure time in the same period is summed, cross-classifying in the same way. Dividing each subgroup of births by the corresponding exposure time produces fertility rates.
A classical analysis of this type faces the problem that too few births are reported in most DHS, even in a five-year period, to estimate age-order-duration-specific fertility in the usual way with adequate precision. This difficulty can be sidestepped, within limits, by modelling the rates statistically by means of survival analysis. This study adopted the latter approach. Either way, the analysis proceeds by applying life table methods either to the directly measured fertility rates or to the fitted fertility rates from the regression model, in order to estimate survivorship in the birth interval, that is, the proportion of women who have not progressed to the next birth. Summary measures of the time that women spend in intervals of a specific type during the period in question can then be derived from the survivorship function.
Because the distribution of birth intervals is very skewed, with a few women having extremely long intervals, most analysts use medians rather than means as their summary index of the duration of birth intervals (Timæus Citation2015). The simplest measure, which is adopted here, is the median duration to the next birth (the duration by which 50 per cent of women have another birth). Some analysts prefer to use the median length of those intervals closed by some cut-off duration such as twelve years, arguing that this prevents confusion between changes in parity progression and the pace of childbearing (Bongaarts and Casterline Citation2013; Casterline and Odden Citation2016).
From our theoretical perspective, the latter indicator is problematic. If women are postponing their next birth for reasons unrelated to their reproductive histories, decisions about fertility (whether to attempt to have a birth at a particular time) determine parity progression, rather than vice versa. Thus, we prefer to use a measure of interval duration that treats all women who enter the interval as a single group, rather than a measure that implies that women with different outcomes necessarily entered an interval with different intentions.
Reductions in parity progression reduce the ratio of closed to open intervals, leading to an increase in the average waiting time to next birth. Increased family size limitation has a particularly large effect on the right-hand tail of the duration-specific fertility distribution, in which the stoppers represent a large proportion of women who have not progressed, and therefore greatly affects the mean waiting time to next birth. Changes in parity progression have far less effect on the median time to next birth. Across sub-Saharan Africa, parity progression is high: even if fertility fell to what would be replacement level for this region, about 60 per cent of all inter-birth intervals would be closed. This implies that, in practice, the median duration to the next birth conditional on having another birth, and the unconditional median duration by which half of all women who enter the interval have another birth, follow similar trends in this region. Moreover, limiting and spacing alone are unable to push up the median time to next birth for all parities combined much beyond four years (Timæus and Moultrie Citation2013). Longer median times to the next birth than this are evidence of postponement.
Poisson regression for rates
Several different models for survival analysis that could potentially be used to analyse birth intervals have been developed. Limiting, spacing, and postponement all change the shape of the duration-specific fertility distribution (Timæus and Moultrie Citation2008, Citation2013). In other words, none of these forms of birth control have a proportional impact on fertility by interval duration. Thus, Cox partial likelihood models, which are proportional hazards models, are ruled out as poorly specified on theoretical grounds. Instead, Moultrie et al. (Citation2012) adopted a model variously described in the literature as a piecewise exponential model, log-linear rates model, or Poisson regression model for rates, and we used the same model in this analysis. Poisson regression is a form of regression analysis used to model count data. It assumes that the counts have a Poisson distribution and that the logarithm of its expected value can be modelled by a linear combination of unknown parameters. Poisson regression can also be used to model rates, where the rate is a count of events of interest divided by some measure of exposure, for example, person-years at risk. In Poisson regression for rates, the expected number of events is modelled with the logarithm of the exposure also included in the linear predictor, but with the parameter estimate for log(exposure) constrained to equal one (Elandt-Johnson and Johnson Citation1980; Holford Citation1980; Frome Citation1983; Allison Citation1984; Clayton and Hills Citation1993). Our analysis was conducted using the poisson command in Stata version 13. The estimates were based on weighted data and the standard errors of the coefficients adjusted for the complex designs of the DHS using Stata’s svy command.
In this analysis, the event of interest is giving birth. The first interval modelled was progression to the second birth. Exposure was measured in months and, in both open and closed birth intervals, was split into discrete time segments at the durations 9, 18, 24, 30 … 72, 84 … 144, 180, and 240 months.
We modelled fertility on a period basis. The overall trend in the rates was modelled using a series of dummy variables for each five-year period of calendar time. Differential trends in fertility were modelled by interacting the relevant variable with a discrete interval-scale variable which took values equating to the midpoints of these five-year periods. To control out selection bias, we included parity and the mother’s five-year age group at the start of the duration segment in all the models. The coefficients of the age parameters, which pick up the biological decline in fecundity with age, were fixed for each country but those for parity, which pick up volitional limitation of family size, were allowed to vary between groups of women and over time.
Fitted fertility rates and median birth intervals
The Poisson regression models estimated log fertility rate ratios relative to a baseline woman, parity, interval duration, and five-year period (see Table A2 in the supplementary material). From these coefficients, fitted duration-specific fertility rates were calculated for ever-married women aged 25–29, who already have three children and live in an urban area. In order to calculate summary indices, these duration-specific fertility rates were used to compute period life table survivorship in the interval, that is, the proportion of women who have not had a birth by the end of each segment of exposure. To calculate the medians, the duration segment during which 50 per cent of the intervals (both open and closed) had been closed was identified. Then a weighted average of survivorship to the start and end of the segment was used to estimate an exact median time to next birth.
Parity progression
Moultrie et al. (Citation2012) identified family limitation by examining the interacting effects of parity and calendar time on fertility. The current paper draws out the implications of these differences further, by presenting PPRs taken from the life tables calculated using the fertility rates derived from the fitted regression models. A decline in the PPRs among women who have between two and five existing children has been proposed to be characteristic of the onset of family size limitation (Brass and Juárez Citation1983).
The final PPRs of women who are still of childbearing age cannot be established. Even in a period analysis, the data collected in the DHS on fertility at very long durations are extremely sparse. Analyses of parity progression based on birth history data have often examined progression at five years (Brass et al. Citation1997). However, in sub-Saharan Africa, a substantial proportion of the women who progress to a further birth do so at durations of more than five years since their previous birth (Moultrie et al. Citation2012). Thus, we examined parity progression at 120 months (ten years) following the woman’s previous birth. Note that, because we modelled fertility on a period basis, this does not impact adversely on the timeliness of the estimates.
Modelling different strategies of birth control
The distribution of the duration-specific fertility rates (i.e., the rate of closing a birth interval) can be used to identify dominant family building strategies in populations that are practising birth control. This distribution varies systematically in shape between populations in which postponing, spacing, or limiting are the dominant motives for birth control. Any factor theorized to affect fertility can be examined using this technique, including calendar time, proximate determinants of fertility, and socio-economic indicators (Moultrie et al. Citation2008; Timæus and Moultrie Citation2013).
First, in a hypothetical population in which only limiting leads to differences in fertility, the duration-specific fertility rates would be pulled downwards, relative to the baseline rates, at all durations since the previous birth, as shown in the dashed line in (Timæus and Moultrie Citation2008, Citation2013). If fertility control were perfect, the proportion of women remaining in the interval who want no more children would rise with the amount of time elapsed since last birth, and thus the downward shift would be greater at long durations. Moreover, in reality, failures of contraception mean that women become increasingly selected for low fecundity as time passes since the previous birth, compounding this effect. In a regression model, limitation can be identified by interacting the characteristic of interest with parity: typically, the fertility of women of parities two and three will decline by more than that of women with only one child or those with many children.
Figure 1 Hypothetical distributions of birth interval duration-specific fertility rates associated with differential limiting, spacing, and postponement of births
Source: Modified from Timæus and Moultrie (Citation2008).
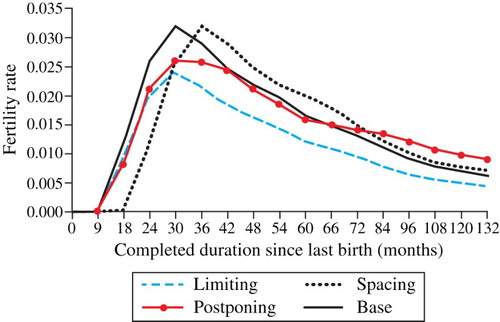
Second, a pure spacing effect results, in contrast, in a rightwards shift of the duration-specific fertility distribution along the x-axis. The height of the distribution does not change because women’s preferences for a particular family size have not changed, as shown by the dotted line in (Timæus and Moultrie Citation2008). Third, the distribution produced in a hypothetical population in which women intend to postpone their next birth for an initially indefinite period shows lower fertility at shorter durations since the previous birth and higher fertility at longer durations than the base distribution (also shown in ). Because some women begin the interval wanting to avoid pregnancy and later decide that they wish to conceive, the distribution is pivoted in an anticlockwise direction relative to the base distribution. In this hypothetical population, duration since last birth has no effect on decisions to stop contracepting (this would be spacing), but fertility decreases slowly with duration as more highly fecund women are removed from the population at risk.
In order to model these variations in the pattern of duration-specific fertility, we follow Timæus and Moultrie (Citation2013) and interact the characteristics of interest with interval duration, log of interval duration, and interval duration squared at the midpoints of the segments of exposure in the interval. Both the simulation of duration-specific fertility distributions and mathematical analysis demonstrate that these interactions are diagnostic of differential birth spacing and postponement (Timæus and Moultrie Citation2013). Acting together, duration and its logarithm can have opposing effects on fertility in the two halves of the fertility distribution, capturing the shifting of it to the left or right that is diagnostic of differential spacing. Positive coefficients on a duration-squared parameter push up fertility at longer durations, capturing the anticlockwise pivoting of the distribution that is diagnostic of postponement. In contrast, limitation tends to produce negative coefficients on a duration-squared parameter, reflecting its proportionally greater impact at long durations.
In addition to these variables the analysis included a variable identifying whether a woman had ever been married. This was constructed by contrasting the date of birth of each child with the date of the mother’s first marriage. The effect on fertility of a woman having ever been married was also allowed to vary over time. A listing of all the variables and interactions included in their model is shown in .
Table 2 Moultrie et al. model for estimating national trends in age-, order-, and duration-specific period fertility and identifying fertility intentions
Exploring differential trends
Moultrie et al. (Citation2012) used their model to estimate trends in waiting times to next birth at the national level using DHS data for those mainland sub-Saharan African countries that had conducted multiple surveys. With further elaboration, the model can be used to explore socio-economic differentials in time to next birth and strategies for birth control. Here, we use it to investigate differentials by level of education, adjusting for urban or rural residence.
As outlined in , our model included all the variables and interactions proposed by Moultrie et al. (Citation2012). We then elaborated the model to assess: (1) whether duration-specific fertility varies between women with different socio-economic characteristics; and (2) whether the effect of a socio-economic characteristic on duration-specific fertility has varied over time. Thus, we included the main effect of the socio-economic characteristic (educational status) and interacted it with parity, date, and the two-way interactions used by Moultrie et al. (Citation2012), in order to pick up both differential limiting and differential trends in limiting. We also interacted the educational status variable with duration since the previous birth, duration squared, and the log of duration. These interactions allowed the shape of the distribution of duration-specific fertility to vary by this socio-economic characteristic, thus permitting the identification of differentials in spacing and postponement. In order to determine whether educational differentials in the unconditional duration of intervals and their control have changed significantly over time (the second objective), our model included three-way interactions between duration, duration squared, and the log of interval duration with date and educational status.
Table 3 Extended model for estimating socio-economic differential trends in age-order-duration-specific period fertility and identifying fertility intentions, using educational level as an example
Results
Fertility by interval duration
examines changes in fertility by duration since last birth over a 25-year period, for women of differing levels of education in four Eastern African countries. These fitted rates, obtained from the regression model, are adjusted for age, parity, and residence. They are presented for married women aged 25–29 who have three children and live in an urban area. While the absolute level of fertility differs according to women’s age, parity, and other characteristics, our statistical model assumes that changes in pattern of the fitted duration-specific rates follow the same path for women of all ages and parities. Fertility declined between 1975–79 and 2000–04 among women of all educational levels in all four countries. However, the duration-specific fertility schedules and patterns of change among the different educational subgroups varied considerably between the four countries.
Figure 2 Duration-specific fertility rates and highest level of education attended by women in four African countries, 1975–79 and 2000–04
Note: Estimates are presented for an ever-married woman, who has three children, is aged 25–29, and lives in an urban area.
Source: Demographic and Health Surveys.
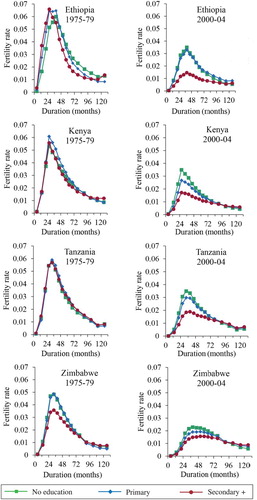
During the earlier period of observation, 1975–79, the duration-specific fertility distributions in all four countries peaked at between 24 and 36 months, and fertility dropped rapidly at longer durations. In Ethiopia, Kenya, and Tanzania, only slight differences existed between the duration-specific fertility distributions of women with differing levels of schooling. In Zimbabwe, however, the fertility of the tenth of the women with secondary or higher education was already significantly lower than that of less educated women at shorter durations, while at longer durations it was slightly higher.
The results for 2000–04 reveal that the duration-specific fertility schedules have changed in all four countries. At this time, less than one-tenth of the women of childbearing age in Ethiopia and Tanzania had attended secondary school, compared with about one-quarter of such women in Kenya and one-half in Zimbabwe. In all four countries, these women now have lower fertility than other women at shorter durations since the previous birth. Moreover, in Kenya, Tanzania, and Zimbabwe, the fertility of this group of women is higher than that of less educated women at longer durations, resulting in an intersection of the fertility distributions of the three educational categories. This is the pattern of change that one would expect with increasing postponement of births. The coefficients for the interaction between interval duration squared, secondary education, and calendar time in the regression model underlying these results are significant in Ethiopia and Kenya (see Table A2 in the supplementary material). Thus, postponement of births by secondary-educated women has increased over time. In Zimbabwe, the interaction between interval duration squared and calendar time is strongly significant; however, there is no statistically significant differential trend between women of differing educational levels.
The changes in the duration-specific fertility schedules () also show that women in Ethiopia, Tanzania, and Zimbabwe with some schooling were spacing their births more widely by the early twenty-first century. In Ethiopia, the peak of the distribution among women with secondary or higher education shifted from 24–29 months after birth in 1975–79 to 36–41 months after birth in 2000–04. In Tanzania, duration-specific fertility among women with secondary or higher schooling peaked at 30–35 months in 1975–79, while in 2000–04 it did so at 36–41 months. In Zimbabwe, there have been shifts in the peak of duration-specific fertility among women of all levels of schooling. It rose from 30–35 months in 1975–79 to 36–41 months in 2000–04 among women with no schooling, and from 30–35 to 48–53 months among women with some schooling. In Zimbabwe, this differential shift in the peak of duration-specific fertility over time is statistically significant, indicating that the increase in the extent of birth spacing differs by women’s level of education (see Table A2 in the supplementary material).
Parity progression
shows trends in parity progression by ten years after the previous birth, according to educational level for the four countries. Back in the 1970s, PPRs for urban women aged 25–29 were slightly above 90 per cent at almost every parity in all four countries. They were somewhat lower in Ethiopia, Kenya, and Zimbabwe at some of the middle-order parities for women with secondary or higher education. By the early twenty-first century, PPRs had dropped among women of all educational levels across the four countries. The decline was both largest and more differentiated by parity among women with secondary or higher education.
Figure 3 Trends in parity progression ten years after previous birth, by parity and highest level of education attended, women in four African countries, 1965–69 to 2005–09
Notes: Estimates are presented for an ever-married woman, who has three children, is aged 25–29, and lives in an urban area. Due to lack of data, the observation period for Ethiopia starts in 1975–79.
Source: As for .
The biggest reductions in parity progression by 2005–09 occurred in Ethiopia. They were similar in size among women who attended primary school and those with no education. However, the reductions were more differentiated by parity among the women who had been to primary school: in this subgroup, the fall in PPRs was greatest among women with three to five children. The changes among women with secondary or higher education in Ethiopia were substantial and varied markedly by parity. The largest declines occurred among women progressing from two to three children and from three to four children, with the proportions progressing in 2000–04 measuring 56 and 52 per cent, respectively. On the other hand, the PPRs of the minority of secondary-educated Ethiopian women who already had four or more children dropped less.
In Kenya, PPRs first fell and then stagnated slightly in 2000–04 at almost all parities and in all three educational subgroups. The changes in progression to second birth were slight in all three groups. Only small reductions occurred in the PPRs of women with two or more children, from around 95 to 85 per cent among those with no education and from around 95 to 80 per cent among women with primary-level schooling. These reductions were similar in size at every parity. Among women with secondary or higher education, the drop in PPRs was larger and more differentiated by parity. It was largest among women progressing to their fourth or fifth birth, with progression dropping to 70 per cent in the most recent period. A drop in PPRs among women progressing from their second to third birth and their third to fourth birth has also occurred, and this change was found to be statistically significant among women progressing from their second to third birth (see Table A2 in the supplementary material).
Tanzania has experienced less change than the other three countries examined, with nearly all PPRs remaining above 75 per cent in 2005–09 (the exception being women with secondary or higher education progressing from three to four births). The trends over time in PPRs of women with no education and those with primary schooling were similar, with progression from the second to third and third to fourth births falling by slightly more than the other PPRs. Progression from the third to fourth birth among women with secondary or higher education has dropped to 69 per cent, but the reduction in their other PPRs has been small.
In Zimbabwe, as in Ethiopia, the PPRs of women with primary or no schooling fell substantially by 2005–09. Among women with no schooling, little evidence exists of differential trends by parity but, among women with primary education, the PPRs have fanned out slightly more. The ratios for progression to the third to sixth births are now between 73 and 77 per cent for women with no schooling and between 72 and 77 per cent for women with primary schooling. The drop in the PPRs of women with secondary or higher education was even greater. In particular, a pronounced drop occurred among women with two to four births, with the proportions that have another child now ranging from 66 to 72 per cent.
Median durations to the next birth
presents the differential trends by educational level in the median time to next birth in the four countries. The estimates are derived from the fitted fertility rates and once again are shown for an ever-married urban resident who has three children and is aged 25–29. Median durations to women’s next birth have lengthened consistently since the 1970s among all three educational subgroups in all four countries, but have stagnated recently in Kenya among women with no education. Overall, median durations were both longer, and lengthened more rapidly, among more educated women. In the most recent period, the medians for women with secondary or higher education stood at between 65 months (Kenya) and 111 months (Ethiopia), while the medians for women with no education were between 37 months (Kenya) and 58 months (Zimbabwe).
Figure 4 Trends in the median duration to next previous birth by highest level of education attended, women in four African countries, 1965–69 and 2005–09
Notes: Estimates are presented for an ever-married woman, who has three children, is aged 25–29, and lives in an urban area. Due to lack of data, the observation period for Ethiopia starts in 1975–79.
Source: As for .
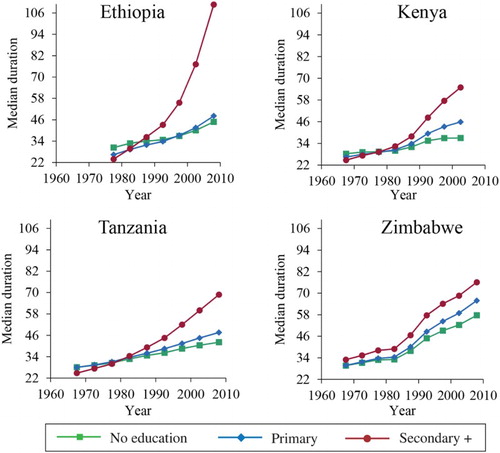
In all four countries, the median durations to next birth of women who never went to school were similar to those of women who only attended primary school. The difference between the median durations of the two groups in the most recent period ranged from three months in Ethiopia to nine months in Zimbabwe. Since the 1990s, the median durations for women who went to primary school have lengthened slightly more rapidly in all four countries than those of women with no schooling.
In all countries, the median time spent in an interval by women who have attended secondary or higher education has increased more rapidly than the median duration for less educated women. This is particularly clear in Ethiopia. In 2005–09 the median duration at which women had another birth was 111 months for women with secondary or higher education, 63 months longer than the median for women with primary education. In the other three countries, the differences between the median duration to next birth of women who have attended secondary school and of those with less education were smaller but still substantial: ranging from ten months in Zimbabwe to 21 months in Tanzania.
Discussion
This paper has described how the regression model devised by Moultrie et al. (Citation2012) can be developed further to examine trends in the duration-specific fertility and family building strategies of subpopulations of women with different socio-economic characteristics. We applied the model to the study of educational differentials in fertility in four Eastern African countries. This analysis reveals that the extent of birth spacing, postponement, and family limitation differs significantly both between the countries and between women of different educational levels within each country.
Fertility has begun to decline in all four countries. It has fallen most and is lowest among women who have attended secondary school. This result is in line with the existing literature on the relationship between education and fertility. The literacy and numeracy skills that women gain in formal education increase their productivity, which raises the opportunity costs of bearing children and strengthens their decision-making autonomy (Kravdal Citation2002). First, educated women are more likely to encourage their own children to attend school, which both costs money and reduces the availability of the child to assist with domestic tasks. Second, women who have experienced some level of schooling themselves are more likely than other women to live in nuclear families. This means that more of the costs of raising children are borne by the parents, rather than their wider extended family. Third, education also diminishes parental dependence on children in old age or early widowhood and reduces infant and child mortality, which, in turn, may reduce the desired number of children (Kravdal Citation2002).
In addition to these ‘demand-side’ factors, education is theorized to reduce fertility through a number of ‘supply-side’ factors. Women who have attended school marry later, which reduces their total number of childbearing years. Education also increases their knowledge and acceptance of both modern family planning methods and more traditional methods, such as prolonged breastfeeding and post-partum abstinence (Kravdal Citation2002).
This study, like much of the existing literature from low-income countries, has shown that the relationship between education and fertility is often non-linear. Education is associated inconsistently with lower fertility among women with just a few years of schooling but for women with secondary or higher education, the relationship is systematically negative (Jejeeboy Citation1995).
The shapes of the duration-specific fertility schedules of women with secondary or higher education have changed in all four countries as their fertility fell. Fertility has fallen by far less at longer durations since last birth than shorter ones. Moreover, by 2000–04, relatively well-educated women in Kenya, Tanzania, and Zimbabwe had higher fertility at durations of more than about eight years since their last birth than women who had not been to secondary school, despite having much lower fertility overall. This indicates that these women are differentially postponing having another birth for lengthy periods for reasons that are probably unrelated to the age of their youngest child. This trend is statistically significant in Ethiopia and Kenya.
It is unlikely that the HIV epidemic in Eastern Africa plays a major role in explaining these trends in duration-specific fertility. HIV infection has both physiological and behavioural effects on fecundity, and the fertility of untreated HIV-infected women is substantially lower than that of the uninfected (Lewis et al. Citation2004). However, this reduction in fertility increases with duration since infection and is greatest in women with symptomatic AIDS (Marston et al. Citation2016). Untreated women living with HIV, whose disease status becomes severe enough to impact greatly on their ability to conceive, will usually die quite quickly. Thus, their childbearing histories are relatively unlikely to be recorded in the DHS. As it has become more accessible, antiretroviral therapy has increasingly had an impact on this situation. Women on treatment are less likely to die, and so remain available for interview in DHS, but their fertility is also affected less (Yeatman et al. Citation2016). However, treatment with antiretroviral therapy became widespread too late to have had much impact on fertility during the period examined in this paper.
In addition to the emergence of postponement in the four countries, we found that the time since last birth at which the duration-specific fertility schedule peaks has risen in Ethiopia, Tanzania, and Zimbabwe. This is indicative of an increase in birth spacing. However, this trend is only statistically significant in Zimbabwe. Among women with secondary or higher education in Ethiopia, a more or less proportional reduction in duration-specific fertility occurred at all durations since last birth. This suggests that one reason for the dramatic increase in the times to next birth among this subgroup of women is that an increasing proportion of them may be limiting the size of their families.
As well as looking at interval durations, this paper has presented PPRs based on the modelled fertility rates for women with varying levels of education. These measures provided additional insights into the process of fertility decline in Eastern Africa. PPRs fell somewhat for all the groups of women, but dropped most among women with secondary or higher education. In Ethiopia, a particularly large drop occurred in progression among these women at parities two and three, revealing the onset of parity-specific family size limitation in this group. In Kenya, Tanzania, and Ethiopia, progression among women who had been to secondary school fell less, but the drop was once again largest at the middle-order parities, suggesting that parity-specific family limitation may also be beginning to emerge among educated women in these populations.
A comparison of the patterns of decline in PPRs documented in this study with those in fertility transitions in Asia reveals substantial differences. In Asia, the decline in progression has been highly concentrated among mid-parity women, that is, women who have between two and five existing children (Brass and Juárez Citation1983). In contrast, except among Ethiopian women who have been to secondary school, this research found only muted differentiation by parity in the drop in progression. Moreover, except in Zimbabwe, even this limited differential reduction in the progression ratios has been largely restricted to the small subgroup of women who have attended secondary school.
This examination of patterns of duration-specific fertility has revealed a nuanced picture of the changes in family building strategies that have been driving the initial stages of fertility transition in these four Eastern African countries. Among the subpopulations where the longest times to next birth have emerged, the changes in duration-specific fertility schedules strongly suggest that postponement was the most common motive for birth control, particularly in Zimbabwe. In this sense, the results of this study largely support Timæus and Moultrie’s (Citation2008) assertion that fertility transition in sub-Saharan Africa is seeing the emergence of very long birth intervals, which cannot readily be accounted for by birth spacing as it is usually envisaged. However, fertility in Eastern Africa is changing in a more complex way than any of the current literature suggests. Educated women are not just postponing. In each of the four countries, we have identified the emergence of two or more family building strategies among more educated women. In Ethiopia, the large drop in the fertility of women with secondary or higher education occurred because parity-specific limitation and postponement have both increased. In Kenya, increases in postponement appear to be driving the lengthening of median time to their next birth of women with more years of formal schooling, but there is also some evidence that some of them are stopping childbearing once they have three, four, or five children. In Zimbabwe, and perhaps Tanzania, birth spacing, in addition to birth postponement, is driving the lengthening of median time to next birth.
This increase in birth spacing (defined as the delaying of a birth for reasons contingent on the age of the youngest child, for example, because the mother is still breastfeeding) is not something that has been noted in the existing literature on the transition to low fertility in sub-Saharan Africa. It cannot be explained by changes in breastfeeding behaviours, since successive DHS have documented declining durations of breastfeeding across all four countries included in this research. Thus, social norms about the appropriate amount of time to leave between births may be changing or women may be increasingly acting to implement a norm of lengthy birth spacing. Alternatively, the number and duration of episodes of spousal separation may have increased in Zimbabwe in response to the prolonged economic crisis that began in the late 1990s. Thus, a more focused research study would be needed to determine whether or not the trend results from women adopting modern methods of birth control to realize more traditional preferences.
To summarize, this paper has illustrated that the use of survival analysis using birth history data to model period fertility, in the way outlined by Moultrie et al. (Citation2012), can be successfully extended to the exploration of changes in the duration-specific fertility and family building strategies of women with different socio-economic characteristics. Women in Eastern Africa are spending more time in each birth interval. Moreover, times to the next birth are longer, and are lengthening more rapidly, among more educated women. Postponement of the next birth has played a dominant role in the early stages of fertility transition in Eastern Africa, producing a decline in fertility that spreads across all age groups and parities, as Caldwell et al. (Citation1992) predicted. However, on examining PPRs calculated from our fitted estimates, we found evidence of the onset of parity-specific birth control among educated women in all four countries, most notably in Ethiopia.
Postponement, spacing births more widely, and family limitation have all contributed, to some extent, to the observed increases in durations to next birth among more educated women in Eastern Africa. Thus, they appear to be complementary rather than mutually exclusive motives for the adoption of birth control at the population level. The evidence from Eastern Africa suggests that women who have attended secondary school are increasingly controlling their fertility in all three ways.
Supplementary Material
Download PDF (106.6 KB)ORCID
Ian M. Timæus http://orcid.org/0000-0001-8011-4806
Notes
1 Please direct all correspondence to Catriona A. Towriss, Centre for Actuarial Research, University of Cape Town, Private Bag X3, Rondebosch 7701, South Africa; or by E-mail: [email protected]
2 This work was conducted while Catriona Towriss was a PhD student at the London School of Hygiene & Tropical Medicine. It was supported by a postgraduate studentship from the Economic and Social Research Council [grant number 237005/TDHE].
References
- Allison, P. D. 1984. Event History Analysis: Regressions for Longitudinal Event Data. London: SAGE Publications.
- Bledsoe, C. H., A. G. Hill, U. D’Alessandro, and P. Langerock. 1994. Constructing natural fertility: the use of western contraceptive technologies in rural Gambia, Population and Development Review 20(1): 81–113. doi: 10.2307/2137631
- Bongaarts, J. and J. Casterline. 2013. Fertility transition: is sub-Saharan Africa different? Population and Development Review 38(Suppl. 1): 153–168. doi: 10.1111/j.1728-4457.2013.00557.x
- Brass, W. and F. Juárez. 1983. Censored cohort parity progression ratios from birth histories, Asian and Pacific Census Forum 10(1): 5–13.
- Brass, W., F. Juárez, and A. Scott. 1997. An analysis of parity-dependent fertility falls in tropical Africa, in G. W. Jones, R. M. Douglas, J. C. Caldwell, and R. M. D’Souza (eds), The Continuing Demographic Transition. Oxford: Clarendon Press, pp. 80–93.
- Caldwell, J. C. and P. Caldwell. 1981. Function of child-spacing in traditional societies and the direction of change, in H. J. Page and R. J. Lestaeghe (eds), Child Spacing in Tropical Africa: Traditions and Change. London-New York: Academic Press, pp. 73–92.
- Caldwell, J. C., I. O. Orubuloye, and P. Caldwell. 1992. Fertility decline in Africa: a new type of transition? Population and Development Review 18(2): 211–242. doi: 10.2307/1973678
- Casterline, J. B. and C. Odden. 2016. Trends in inter-birth intervals in developing countries 1965–2014, Population and Development Review 42(2): 173–194. doi: 10.1111/j.1728-4457.2016.00134.x
- Clayton, D. and M. Hills. 1993. Statistical Methods in Epidemiology. Oxford: Oxford University Press.
- Egbuonu, I., C. C. Ezechukwu, J. O. Chukwuka, and J. I. Ikechebelu. 2005. Breast-feeding, return of menses, sexual activity and contraceptive practices among mothers in the first six months of lactation in Onitsha, South Eastern Nigeria, Journal of Obstetrics and Gynaecology 25(5): 500–503. doi: 10.1080/01443610500171250
- Elandt-Johnson, R. C. and N. L. Johnson. 1980. Survival Models and Data Analysis. Chichester: John Wiley.
- Feeney, G. and J. Yu. 1987. Period parity progression measures of fertility in China, Population Studies 41(1): 77–102. doi: 10.1080/0032472031000142546
- Frome, E. L. 1983. The analysis of rates using Poisson regression models, Biometrics 39(3): 665–674. doi: 10.2307/2531094
- Hobcraft, J. N. and J. McDonald. 1984. Birth Intervals. WFS Comparative Studies No. 28. Voorburg, Netherlands: International Statistical Institute.
- Hobcraft, J. N. and G. Rodríguez. 1992. Methodological issues in the life table analysis of birth histories, in A. G. Hill and W. Brass (eds), The Analysis of Maternity Histories. Liege, Belgium: IUSSP, pp. 53–95.
- Holford, T. R. 1980. The analysis of rates and of survivorship using log-linear models, Biometrics 36(2): 299–305. doi: 10.2307/2529982
- Howard, M. and A. Y. Millard. 1997. Hunger and Shame: Child Malnutrition and Poverty on Mount Kilimanjaro. New York: Routledge.
- Jejeeboy, S. H. 1995. Women’s Education, Autonomy and Reproductive Behavior: Experience from Developing Countries. Oxford: Clarendon Press.
- Johnson-Hanks, J. 2007. Natural intentions: fertility decline in the African demographic and health surveys, American Journal of Sociology 112(4): 1008–1043. doi: 10.1086/508791
- Kravdal, Ø. 2002. Education and fertility in Sub-Saharan Africa: individual and community effects, Demography 39(2): 233–250.
- Lesthaeghe, R. J., P. O. Ohadike, J. Kocher, and H. J. Page. 1981. Child-spacing and fertility in sub-Saharan Africa: An overview of issues, in H. J. Page and R. J. Lesthaeghe (eds), Child-Spacing in Tropical Africa: Traditions and Change. London-New York: Academic Press, pp. 2–23.
- Lewis, J. J. C., C. Ronsmans, A. Ezeh, and S. Gregson. 2004. The population impact of HIV on fertility in sub-Saharan Africa, Aids (London, England) 18: S35–S43. doi: 10.1097/00002030-200406002-00005
- Marston, M., J. Nakiyingi-Miiro, S. Kusemererwa, M. Urassa, D. Michael, C. Nyamukapa, S. Gregson, B. Zaba, and J. W. Eaton; ALPHA network. 2016. The effects of HIV on fertility by infection duration: evidence from African population cohorts before ART availability: fertility by duration of HIV infection, Aids (London, England) Published ahead of Print: 1–23. doi: 10.1097/QAD.0000000000001305
- Moultrie, T. A. and I. M. Timæus. 2003. The South African fertility decline: evidence from two censuses and a Demographic and Health Survey, Population Studies 57(3): 265–283. doi: 10.1080/0032472032000137808
- Moultrie, T. A., V. Hosegood, N. McGrath, C. Hill, K. Herbst, and M.-L. Newell. 2008. Refining the criteria for stalled fertility declines: an application to rural KwaZulu-Natal, South Africa, 1990–2005, Studies in Family Planning 39(1): 39–48. doi: 10.1111/j.1728-4465.2008.00149.x
- Moultrie, T. A., T. S. Sayi, and I. M. Timæus. 2010. Age and parity effects on birth intervals in the African fertility decline. Paper presented at the Population Association of America Annual Meeting. Dallas, Texas.
- Moultrie, T. A., T. S. Sayi, and I. M. Timæus. 2012. Birth intervals, postponement, and fertility decline in Africa: A new type of transition? Population Studies 66(3): 241–258. doi: 10.1080/00324728.2012.701660
- Murdock, P. G. 1954. Our Primitive Contemporaries. New York: The Macmillan Company.
- Ní Bhrolcháin, M. 1987. Period parity progression ratios and birth intervals in England and Wales, 1941–1971: a synthetic life table analysis, Population Studies 41(1): 103–125. doi: 10.1080/0032472031000142556
- Rallu, J.-L. and L. Toulemon. 1994. Period fertility measures: the construction of different indices and their application to France, 1946–89, Population an English Selection 6: 59–93.
- Rindfuss, R. R., J. A. Palmore, and L. L. Bumpass. 1982. Selectivity and the analysis of birth intervals from survey data, Asian and Pacific Census Forum 8(3): 5–11.
- Rodríguez, G. and J. N. Hobcraft. 1980. Illustrative Analysis: Life Table Analysis of Birth Intervals in Columbia. WFS Scientific Reports No. 16. Voorburg, Netherlands: International Statistical Institute.
- Rodríguez, G., J. N. Hobcraft, J. McDonald, and J. Menken. 1984. A Comparative Analysis of Determinants of Birth Intervals. Voorburg, Netherlands: International Statistical Institute.
- Santow, G. 1987. Reassessing the contraceptive effect of breastfeeding, Population Studies 41(1): 147–160. doi: 10.1080/0032472031000142576
- Timæus, I. M. 2015. Parity progression and birth intervals, in Population Analysis for Policy and Programmes. Paris: International Union for the Scientific Study of Population, pp. 1–24. Available: http://papp.iussp.org/sessions/papp104_s09/PAPP104_s09_010_010.html (accessed: December 2016).
- Timæus, I. M. and T. A. Moultrie. 2008. On postponement and birth intervals, Population and Development Review 34(3): 483–510. doi: 10.1111/j.1728-4457.2008.00233.x
- Timæus, I. M. and T. A. Moultrie. 2013. Distinguishing the impact of postponement, spacing and stopping on birth intervals: evidence from a model with heterogeneous fecundity, Journal of Biosocial Science 45(3): 311–330. doi: 10.1017/S0021932012000648
- UN Population Division. 2015. World Population Prospects, the 2015 Revision. United Nations. Available: https://esa.un.org/unpd/wpp/ (accessed: November 2016).
- Wolf, M., A. Abubakar, S. Tsui, and N. E. Williamson. 2008. Child Spacing Attitudes in Northern Nigeria. Arlington: USAID.
- Yeatman, S., J. W. Eaton, Z. Beckles, L. Benton, S. Gregson, and B. Zaba. 2016. Impact of ART on the fertility of HIV-positive women in sub-Saharan Africa, Tropical Medicine & International Health 21(9): 1071–1085. doi: 10.1111/tmi.12747