
Abstract
The aim of this study is to investigate spatial mobility over time. Research on ‘new mobilities’ suggests increasing movement of individuals, technology, and information. By contrast, studies of internal migration report declining spatial mobility in recent decades. Using longitudinal register data from Sweden, we calculate annual order-specific migration rates to investigate the spatial mobility of young adults over the last three decades. We standardize mobility rates for educational enrolment, educational level, family status, and place of residence to determine how much changes in individuals’ life domains explain changes in mobility. Young adults’ migration rates increased significantly in the 1990s; although all order-specific migration rates increased, first migration rates increased the most. Changes in population composition, particularly increased enrolment in higher education, accounted for much of the elevated spatial mobility in the 1990s. The analysis supports neither ever increasing mobility nor a long-term rise in rootedness among young adults in Sweden.
Introduction
The last two decades have witnessed a significant increase in research on ‘new mobilities’, with studies reporting increasing movement of individuals, machines, goods, information, and ideas. According to the ‘new mobilities’ theory, all the world is ‘on the move’ and social science research has experienced the ‘mobility turn’ (Sheller and Urry Citation2006; Sheller Citation2014). These sentiments are shared by mainstream research on international (population) migration, with the notion of ‘the age of migration’ holding a central position (Castles and Miller Citation2009). Recent economic and demographic research suggests that the spatial mobility of individuals may also have increased within countries. Individuals are now more likely to move than in the past because of the changing nature of work in advanced industrialized societies (i.e., short-term work contracts becoming increasingly common) (Beck Citation1992) and increased diversity in individuals’ life courses (cf. Macmillan Citation2005; Kulu and Milewski Citation2007; Lesthaeghe Citation2010; Thomson Citation2014).
By contrast, recent empirical studies on internal migration in selected industrialized countries (mostly the United States (US)) show that mobility has declined significantly in the past few decades. The declining migration rates in the US have been attributed to population ageing, the increased share of dual-earner households, the decline in real wages and in job changes, and an increased ‘rootedness’ of the American population (Fischer Citation2002; Cooke Citation2011; Molloy et al. Citation2017). Recent studies on Britain support a marked reduction in short-distance moves. However, rates of long-distance moves have remained relatively stable over the past 40 years despite some annual fluctuations (Champion Citation2016; Champion and Shuttleworth Citation2017a, Citation2017b). Similarly, recent research on international migration has challenged the common idea of ever increasing migration flows and intensities; the share of international migrants in the world has stayed relatively stable in recent decades (Abel and Sander Citation2014; Czaika and de Haas Citation2014). Despite diverging results on spatial mobility in recent social science literature, relatively little research has examined geographical mobility trends within countries over time.
The aims of this study are to investigate internal migration over time and to explain changes in mobility patterns in Sweden. We focus on the geographical mobility of individuals aged 18–29, as young adults are known to be the most mobile group in industrialized societies (Rogers and Castro Citation1981; Fischer Citation2002; Bernard et al. Citation2014; Champion and Shuttleworth Citation2017a, Citation2017b), and previous studies on Sweden have demonstrated elevated migration levels among young adults relative to other age groups (Lundholm Citation2007; Kolk Citation2016). Young adulthood is a time when many individuals move to enrol in university, to form a family unit, and to start their labour and housing market careers (Mulder and Wagner Citation1998; Clark and Davies Withers Citation2007; Kulu Citation2008). We focus on the migration of young adults also for a practical reason; data on individuals’ full residential histories and their socio-demographic characteristics (e.g., educational and marital status) for the period 1986–2009 are available only for this age group.
Sweden is an ideal case for studying the dynamics of spatial mobility. First, Sweden belongs to the group of advanced economies and boasts a high average income, with services and information technology having become the dominant employment sectors (Zaring et al. Citation2009). Second, Sweden is a society where life course patterns have diversified significantly in recent decades; premarital cohabitation, separation, repartnering, and stepfamilies are more common than in other industrialized countries (Oláh and Bernhardt Citation2008; Thomson Citation2014). Finally, the availability of register data for a long period of time offers an excellent opportunity to conduct a study on spatial mobility: large-scale longitudinal data ensure reliable estimates of spatial mobility over time and make the calculation of disaggregated measures (e.g., order-specific migration rates) possible.
We draw on previous studies of internal migration and spatial mobility (e.g., Fischer Citation2002; Cooke Citation2011; Champion Citation2016; Champion and Shuttleworth Citation2017a, Citation2017b; Kaplan and Schulhofer-Wohl Citation2017; Molloy et al. Citation2017) and advance the research in the following ways. First, we calculate age-standardized migration measures to investigate the spatial mobility of the Swedish population over time. While some studies have applied age-standardized measures, many studies have used the crude migration rate to examine spatial mobility over time. Although crude rates provide an overview of changes in the number of migrations, they are sensitive to changes in a population’s age composition. Further, and more importantly, we demonstrate how to adjust migration rates for individual characteristics that may vary over time (e.g., place of residence, education, work, and family). This helps us to determine by how much changes in the various life domains of individuals or couples explain the changes in mobility over time. The calculation of standardized migration rates is the first novelty of this study.
Second, we disaggregate migration rates by calculating order-specific rates. The calculation of order-specific mobility rates provides us with a detailed description of the changes in spatial mobility in Sweden over time. Previous research has suggested that movers are more prone to move again and that non-movers are more prone to stay (Blumen et al. Citation1955; Davies Citation1993). This may result in a cumulative process in which a first move increases the likelihood of second and third moves, while early stayers are more likely to remain immobile. However, if late starters have just postponed their life course events and moves, they may catch up in the end. Hence, mobility trends are influenced by changing life course patterns and by the processes of cumulative mobility and immobility (Willekens Citation1999; Fischer and Malmberg Citation2001). Therefore, we stress the importance of examining order-specific migration rates to determine whether moves (first, second, third, and so on) have increased or decreased over time. The study of order-specific migration thus allows us to determine whether changes in mobility rates are explained by changed mobility patterns among all population subgroups or whether only some subgroups have become more or less mobile than they used to be (thus accounting for the changes in mobility rates). To our knowledge, no previous study has examined trends in spatial mobility based on mobility order—this is the second novelty of our paper.
Research on spatial mobility dynamics
There is a long tradition of investigating the spatial redistribution of populations in industrialized countries (Ravenstein Citation1885; Rogers et al. Citation1983; Kupiszewski et al. Citation1998; Rees and Kupiszewski Citation1999; Champion Citation2001; Fotheringham et al. Citation2004; Wilson and Rees Citation2005; Rees et al. Citation2016) and examining the migration behaviour of individuals and population subgroups (Courgeau Citation1985; Mulder and Wagner Citation1998, Citation2001; Fischer and Malmberg Citation2001; Clark and Huang Citation2003; Clark and Davies Withers Citation2007, Citation2009; Lundholm Citation2007, Citation2010, Citation2012; Kulu Citation2008; Mulder and Malmberg Citation2011; Kulu and Steele Citation2013; Chan and Ermisch Citation2015; Ermisch and Steele Citation2016). Recently, a new research stream has emerged to investigate spatial mobility levels across countries (Bernard et al. Citation2014; Bell et al. Citation2015). Another emerging research area is examining internal migration trends over time, inspired by classic research from the 1970s (Zelinsky Citation1971; Courgeau Citation1973).
In a seminal paper on ‘mobility transition’, Zelinsky (Citation1971) proposed a theoretical framework for studying spatial mobility and made predictions about future trends. Spatial mobility in Europe increased during industrialization and modernization in the late nineteenth century and this was closely linked to demographic transition. While emigration and rural–urban migration explained much of the increase in spatial mobility in so-called ‘transitional’ societies, in ‘advanced’ societies, increased interurban migration and circulation became responsible for high mobility; residential mobility rates (or short-distance moves) were also high. For ‘super-advanced’ societies, the framework predicted a decline in residential moves and the deceleration of some forms of circulation because of improved communication through technological advancements.
Long (Citation1991) investigated patterns of residential mobility in industrialized countries in the 1970s and 1980s. First, the study showed significant variation in residential mobility levels across countries: while residential mobility was relatively high in the US, Canada, Australia, and New Zealand, it was low in many European countries, including Britain. Long attributed the variation across countries to the differences in housing availability and affordability due to housing market regulations and potentially to long-standing customs and traditions that govern housing patterns and relationships between people and their housing. Second, for most countries, the analysis showed some decline in mobility levels over the study period, which the author attributed to the lack of affordable housing in industrialized countries. This was in contrast to earlier studies, which reported relatively stable spatial mobility in Western Europe in the decades after the Second World War (e.g., Courgeau Citation1973).
Similarly, Rogerson (Citation1987) reported declining geographical mobility rates in the US. The analysis showed relatively high mobility in the 1950s and early 1960s, followed by a sharp decline from the mid-1960s to the early 1980s. While the changing age composition of the US population explained some of this decline in crude mobility rates, further analysis also revealed declining age-specific migration rates in the 1970s. The author attributed this to increased competition in the labour and housing markets, potentially due to the arrival of baby boomers in the labour market and increased participation of women in the labour force. Fischer (Citation2002) reached very similar conclusions. His analysis of long-term migration trends in the US supported the earlier findings that both short- and long-distance mobility rates were relatively high in the 1950s and declined thereafter, although the decline in long-distance mobility was much slower. Interestingly, spatial mobility among young adults increased in the 1950s and 1960s and reached its culmination in the 1970s, only then beginning to decline.
A more recent US study by Molloy et al. (Citation2011) supported these findings. The authors calculated mobility rates for the last 30 years and found a decline in spatial mobility across socio-economic groups at different spatial scales. They discussed various factors behind this trend, including the ageing population, increased shares of homeownership and of dual-earner households, improved telecommunications, and the end of the ‘move-to-the-South’ era, a factor specific to the US context. However, a closer look into the results by age shows that interstate migration rates were relatively stable for all age groups between 1980 and 2000; a decline was only observed for the most recent decade. Recently, Molloy et al. (Citation2017) and Kaplan and Schulhofer-Wohl (Citation2017) have emphasized the role of economic factors in declining spatial mobility rates, more specifically the decline in job changes. This may be related to the homogenization of labour markets and to a better availability of information about different jobs and places, which, in turn, has reduced the need for young people to experiment with working and living in different places. Cooke (Citation2011) also found both short- and long-term trends of migration decline in the US, but explained the decline as a combined effect of the recent economic crisis, the changing demographic composition, and the long-term rise of rootedness. Similarly, Frey (Citation2009) attributed a recent slowdown in geographical mobility in the US to economic crisis.
Studies on other industrialized countries show that recent trends in spatial mobility are not that clear when patterns are adjusted for the changing age composition of the population. Bell et al. (Citation2002) discussed various measures of spatial mobility and compared mobility intensities in Australia and Britain at various spatial scales. The analysis revealed that while geographical mobility declined slightly in Britain in the 1980s, mobility rates possibly increased in Australia in the early 1990s. Lundholm (Citation2007) examined trends in interregional migration in Sweden over a long period of time. The analysis supported earlier findings that migration rates declined significantly during the 1970s and 1980s; however, they increased again in the 1990s. The patterns differed by population subgroup: while migration rates for families with children declined over time, those for singles and couples without children increased significantly, suggesting the polarization of migration patterns by life course stage. The declining mobility rates among families and among the employed population were attributed to an increase in the number of dual-earner families and delayed family formation.
Stillwell and Coll (Citation2000) showed increasing migration rates for working-age people in Spain between 1988 and 1994; however, intraprovincial mobility increased more than interprovincial mobility, a finding that the authors attributed to the increased suburbanization in Spain during that period. By contrast, Cannari et al. (Citation2000) showed declining mobility rates in Italy between the 1960s and the early 1990s, largely due to the decline in South–North migrations, which they attributed to increased differences in housing costs. Recently, Champion and Shuttleworth (Citation2017a, Citation2017b) showed a marked reduction in short-distance moves (less than 10 km) for all population subgroups in England and Wales between 1971 and 2011. By contrast, the level of long-distance moves remained stable. Further analysis by age showed that young adults were responsible for some increase in migration rates in the 1990s. Overall, most studies have reported a decline in spatial mobility in the 1970s and 1980s; however, the results on trends since the 1990s are less conclusive; they vary across countries and also depend on whether migration or residential mobility is examined.
Determinants of spatial mobility trends
Population ageing has reduced overall spatial mobility in industrialized societies in recent decades. However, if we control for the effect of populations’ changing age compositions, we can list other factors that have, in turn, either hindered or promoted (higher) spatial mobility. First, spatial mobility may have declined in industrialized countries in recent decades because of the increased share of dual-earner couples, which has significantly reduced migration for the sake of the male breadwinner’s career (Cooke Citation2011). Second, research has shown that the share of homeowners increased in many industrialized countries until very recently; another factor that may have reduced spatial mobility (Fischer Citation2002; Cooke Citation2011; Champion and Shuttleworth Citation2017a). Third, most people in industrialized countries live in urban areas; with the spread of post-secondary educational institutions to smaller cities and towns, the need for young adults to move to another place to complete their education (traditionally from a rural area to an urban area) and return thereafter has diminished. Fourth, with the development of telecommunication technologies, opportunities have opened up to work from home, even over long distances, which has made job changes possible without the need for residential changes (Fischer Citation2002; Sheller and Urry Citation2006; Cooke Citation2011; cf. Findlay et al. Citation2015). Further, research has argued that the need to change job (and thus move) has declined as labour markets within countries have become more homogenous and information about opportunities (or the lack of them) elsewhere has improved significantly (Kaplan and Schulhofer-Wohl Citation2017; Molloy et al. Citation2017). Fifth, studies have also argued that spatial mobility, particularly residential mobility, has declined during the post-2008 recession because of homeowners’ inability to sell houses that they bought during the economic boom at a high price and potential buyers’ inability to afford these overpriced houses (cf. Frey Citation2009).
By contrast, several factors may have promoted higher spatial mobility in industrialized countries in recent decades. First, changes in family and fertility patterns have led to smaller households and a larger population of single people, who have fewer obstacles to moving over short or long distances (Clark and Davies Withers Citation2007; Kulu Citation2008). Furthermore, the mobility of young adults may have increased because of delayed family formation; an increased number of individuals in their mid- or late 20s have no children, although they may have a partner. Increased separation, divorce, and repartnering rates mark another demographic trend driving higher mobility in industrialized societies (Lesthaeghe Citation2010; Thomson Citation2014). Second, spatial mobility may have increased because of the expansion of higher education in many European countries in recent decades (Champion and Shuttleworth Citation2017b). Third, on the employment side, the rise of post-industrial economies and the emergence of the post-Fordist economic model have challenged the labour market stability that many generations used to enjoy; long-term work contracts are in decline and short-term work contracts are increasingly common, particularly among younger people (Beck Citation1992; cf. Findlay et al. Citation2015).
The Swedish context
Like other industrialized societies, Sweden has experienced trends that both hamper and trigger mobility over time. In the urbanization era, until the 1970s, Sweden experienced a relocation of job opportunities from rural to urban areas, followed by large migration flows, especially to the metropolitan regions (Borgegård et al. Citation1995). But with a higher portion of people in the few metropolitan areas and the expansion of the regionalized public sector, the incentive to move for jobs in larger cities reduced over time and a lower rate of urbanization was observed in the 1980s (Hedlund and Lundholm Citation2015). Interregional migration increased again in the 1990s, especially at younger ages (Lundholm Citation2007). The expansion of higher education in Sweden was particularly rapid in the 1990s, when the number of students more than doubled in ten years (Hogskoleverket Citation2013). This expansion was partly due to an extension of the capacity of ‘old’ universities, combined with a government policy to start new institutions for higher education in other regions with the aim of making higher education more accessible (Andersson et al. Citation2004). Chudnovskaya and Kolk (Citation2017) found that intergenerational distance increased over the period 1980–2007 as a result of the expansion of higher education. Although the policy to regionalize higher education impeded migration, the expansion of the existing universities led to a mobility pattern where more students ended up further afield from their parental home.
Young people in Sweden leave the parental home relatively early compared with other countries (Billari Citation2001), often after graduating from secondary education. This has been a persistent pattern over the post-war period, despite social and economic change. But even with this early move from home, the age of becoming established in the labour market and the ages at family formation and childbearing have increased over time (Oláh and Bernhardt Citation2008; Andersson and Kolk Citation2011; Thomson Citation2014). This suggests that the stage in the life course with few mobility constraints has been extended, with a longer period of independent living or cohabitating partnerships. Cohabitations are known to be volatile compared with marriages (Andersson Citation2002), but many cohabiting couples marry eventually, often after having a first, or increasingly often, a second child (Holland Citation2013).
The Swedish population benefits from rather generous public employment insurances that reduce job-induced migration. Government policy is also to promote interregional commuting, in order to substitute urban-bound migration and depopulation of remote regions. Further, the Swedish government has a policy for gender equality, including provision of daytime childcare and parental leave benefits that encourage both men and women to pursue careers, but also to share responsibility for the care of children. Dual-earner couples have become the norm and migration for the sake of the male breadwinner’s career may be less frequent than in other European countries (Lundholm Citation2007; Brandén Citation2013). Further, increasing the enrolment of young women in higher education may have influenced gender-specific mobility patterns.
Hypotheses
In this study, we investigate the spatial mobility of young adults in Sweden over time and examine how much changes in the various life domains of individuals (education, family, and residence) explain changing mobility patterns in Sweden. First, based on previous research, we expect to observe increasing spatial mobility among young adults over the last two decades. A critical question is whether and how much migration rates have increased. Second, we expect both increased educational levels and increased cohabitation, separation, and repartnering rates to explain some of the changes in spatial mobility dynamics. Again, an interesting question is how much these factors account for spatial mobility dynamics in recent decades. Third, assuming that educational and family changes explain (at least) some of the increase in spatial mobility, we expect to observe increasing first and second migration rates among our research population. The key question here is whether some groups have become more mobile over time than others. For example, are the highly educated more likely to experience cumulative mobility, with a first move to university followed by further moves to jobs in new regions, whereas those with no higher education are more likely to experience cumulative immobility? This is a question rarely addressed in previous research but crucial for understanding the consequences and drivers of mobility trends in the Swedish context and elsewhere.
Methods
Previous research has used two types of measure to investigate trends in spatial mobility over time. Many studies have used the crude migration rate, rt:(1) where Mt is the number of migrations in a given population at time t, normally a year, and Rt is the person-time lived in the population at time t (for annual rates, person-years lived during a year). Although the crude rate provides information on changes in the number of migrations over time in a population at risk, the measure is sensitive to the population’s age structure. Other studies have used age-specific migration rates, with age usually grouped into five- or ten-year intervals (e.g., Fischer Citation2002; Champion and Shuttleworth Citation2017b):
(2) where x refers to the age group.
While the analysis of age-specific rates can provide us with useful information on trends in spatial mobility over time, it usually remains unclear whether annual migration rates change because of changes in individuals’ migration behaviour or changes in population composition (e.g., by educational or family status). Some studies have sought to calculate age-specific rates using population subgroups (e.g., Fischer Citation2002); although this step is a natural ingredient of the age-specific approach, the approach itself is not very efficient if more than one compositional factor may account for annual variation in migration rates. Another limitation of previous research is that no study has analysed order-specific migration. Information on overall level of mobility is a natural starting point for migration research, but it may also be useful to know whether only first migration rates have changed over time or whether higher-order mobility has also varied.
We develop the method for analysing spatial mobility over time in two ways: we propose, first, the calculation of order-specific migration rates and, second, the standardization of migration rates. The order-specific migration rate is calculated as follows:(3) where n refers to migration order (first, second, … , nth). Note that the risk set consists of those individuals who have not yet moved for the nth time. The next step is to standardize order-specific migration rates for the composition of the population. We can begin with age-standardized rates, using the technique of indirect standardization:
(4) where
is the age-standardized nth migration rate at time t (assume a year), and
is a standard age schedule (age-specific migration rates). The formula provides us with relative migration rates, that is, relative to those in a standard population (e.g., in a specific year for the same population). Hoem (Citation1987, Citation1993) has shown a close link between indirect standardization and hazard regression (or survival analysis); effectively, the latter can be considered an improved indirect standardization that includes all the features of modern statistical analysis. A hazard model for the calculation of age-standardized, order-specific migration rates can be formalized as follows:
(5) where
is the hazard of the nth migration for individuals (or the population) at year t;
is a set of parameters measuring the effect of the calendar year on the hazard of the nth move (or the baseline hazard); and
denotes the parameters describing the effect of age. (The reader may be used to seeing age-specific rates as the baseline for the model, but the order of the components does not matter.) We can standardize the annual migration rates not only for age but also for additional factors:
(6) where
refers to the values of a set of covariates with k covariates (e.g., age, duration since previous migration (if any), educational enrolment, educational level, marital status, the presence of children, and place of residence); and
denotes the parameters describing the effects of the covariates. We thus use a discrete-time hazard model to estimate migration rates with and without adjusting for covariates (for the discrete-time approach, see e.g., Singer and Willett Citation1993). A similar approach has been used by Hoem (Citation1991) and Andersson (Citation1999) to study partnership and fertility dynamics, but to our knowledge its application in migration research is new. Decomposition is an alternative approach for investigating how much changing population composition accounts for changes in demographic rates over time (Chevan and Sutherland Citation2009).
Data
We use data from the Population Register of Sweden. Our research population consists of individuals born between 1957 and 1991. We study their spatial mobility from ages 18 to 29 for the period 1986–2009. We use this period for two reasons: first, we have information on these individuals’ full residential histories for these years, which allows the calculation of annual migration rates by order. Second, information on individuals’ socio-demographic characteristics (e.g., educational and marital status), which allows the calculation of standardized migration rates, has been available since 1986. In total, there are 5,645,556 individuals in the Population Register who have been in the population at risk at least once during the observation period; for the analysis, we draw a random sample of around 50 per cent, or 2,822,731 individuals (to facilitate the fitting of complex models with many covariates and interaction terms).
Information on individuals’ place of residence is available at the end of each year (31 December) at different spatial levels: for 1,840 parishes, 290 municipalities, and 100 labour market areas. In this study, we focus on migrations (i.e., long-distance moves), defined as moves between two labour market areas (as defined in 1998, the closest year to the midpoint of our observation window). Local labour markets (LLM) are defined by Statistics Sweden (Citation2010) based on commuting patterns. The largest labour market area (Stockholm) had 2,128,360 residents in 1998, while the smallest (Sorsele) had 3,281 inhabitants. The mean population size of an LLM was 88,543, with a median of 28,439, and the mean population density was 65 people per square km, with a median of 15.
Individuals who die or leave the country in year t are excluded at the time of their death or emigration (i.e., leave the risk set). Individuals who enter the country (immigrants) in year t are at risk of first internal migration from year t + 1. Similarly, for return migrants, only moves within Sweden are used to determine migration order. Our sensitivity analysis with and without immigrants (and return migrants) showed no significant changes in the results.
We standardize migration rates for a set of socio-demographic variables. Our controls consist of age (one-year age groups), duration since the previous migration (if any), educational enrolment (not enrolled; enrolled), educational level (low: up to nine years in school; medium: two or three years in upper secondary education; high: two or more years of tertiary education), marital status (single or divorced; married), the presence of children (childless; parent), and place of residence (six groups according size of the labour market area). The inclusion of these variables helps to determine the role that educational and family changes have played in the dynamics of spatial mobility. If an individual moves in year t and their socio-demographic characteristics also change, then the change in socio-demographic characteristics is assumed to occur before their migration, that is, migration occurs after the change in an individual’s characteristics. For example, when people move to start studying, we would observe elevated mobility during studies (rather than when people are not studying). We use this approach because we wish to determine how much changes in population composition (e.g., an increase in enrolment rates) explain annual variation in spatial mobility rates. As always, we need to be cautious when we interpret the effects of socio-demographic characteristics in the multivariate analysis. Elsewhere we have shown how to distinguish moves related to life events from those that occur when individuals are in specific states (Kulu and Steele Citation2013). The distributions of risk times and migration events by year and by the six covariates are provided in .
Table 1 Person-years and migrations by categories of control variable, young adults aged 18–29, Sweden, 1986–2009
Results
We first calculated annual unstandardized (crude) migration rates (without migration order) for young adults (aged 18–29) over the period 1986–2009. Annual migration rates were around 0.05 in the late 1980s and early 1990s, that is, 50 migration events per 1,000 person-years. Thereafter, migration rates increased significantly and reached levels of 0.07–0.08 in the first decade of the twenty-first century (). Thus, migration rates increased by approximately 60 per cent during the 1990s. We then standardized annual migration rates by age (one-year age groups) to determine how much changes in the age structure of young adults shaped these trends. We can see that there is virtually no difference between the unstandardized rates (dotted line) and those controlling for age (short dashed line; ): either way, spatial mobility was much higher in the 2000s than in the late 1980s and 1990s.
Figure 1 Annual migration rates for young adults aged 18–29, Sweden, 1986–2009
Source: Authors’ calculations based on the Population Register of Sweden, 1986–2009.
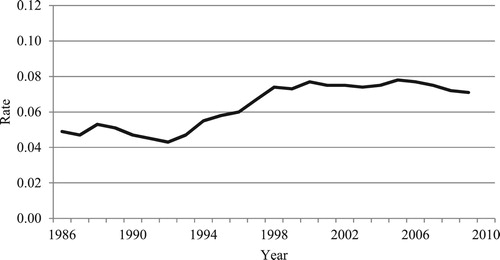
Figure 2 Relative migration rates for young adults aged 18–29, Sweden, 1986–2009
Notes: The migration rate in 1986 is the reference point. Model 1 (dotted line) has no controls; Model 2 (short dashed line) controls for age; Model 3 (long dashed line) additionally controls for education enrolment; Model 4 (dash–dot line) additionally controls for education level; Model 5 (two-dashed line) additionally controls for marital and parental status; Model 6 (solid line) additionally controls for place of residence. Control variables are thus progressively added to the models.
Source: As for .
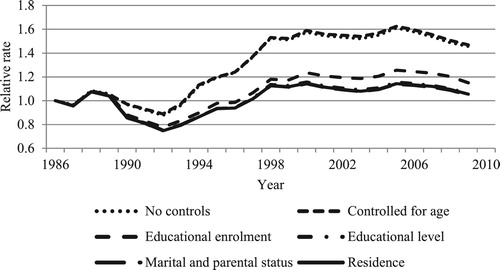
Next, we standardized migration rates for educational enrolment. The annual variation in mobility levels declined significantly (long dashed line; ). We then also controlled for educational level (dash–dot line) and the differences in spatial mobility over the years declined slightly further. We can observe a decline in migration rates in the early 1990s and an increase thereafter. Most importantly, annual migration rates in the 2000s were only slightly higher than those in the 1980s after we controlled for individuals’ educational enrolment and level. In the final step, we also included individuals’ marital and parental status and their place of residence in the model. The results, shown by the two-dashed line and solid line, respectively, did not change much. Overall, the analysis showed that the changes in educational enrolment (i.e., the increase in the student population) and to a lesser extent in educational levels explained much of the increase in migration rates in the latter half of the 1990s. The effects of control variables were as expected (see ): students had a 2.2 times higher risk of moving than non-students (note that individuals were ‘enrolled in education’ in the year when they moved to and left the place where their studies took place) (Fischer and Malmberg Citation2001); the propensity of moving increased with each increase in educational level (Lundholm Citation2007, Citation2010); married individuals, particularly those with children, were less likely to move long distances compared with single, childless individuals (Lundholm Citation2007, Citation2010); and out-migration rates were highest in small towns and rural areas and lowest in the large city regions of Stockholm and Gothenburg (Lundholm Citation2010). The effects of covariates on first migrations were largely similar (see Table A1 in the supplementary material).
Table 2 Relative migration rates by control variables, young adults aged 18–29, Sweden, 1986–2009
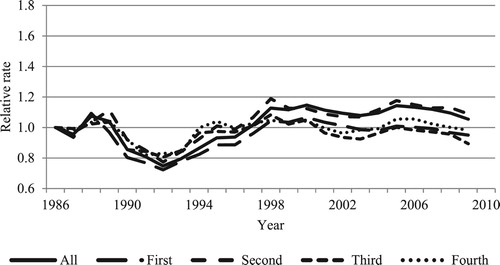
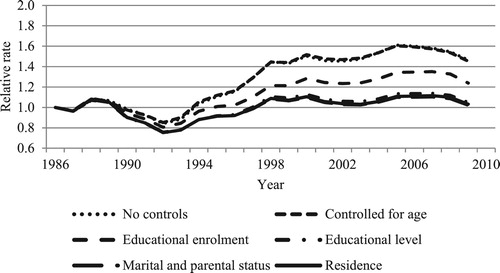
To gain a better understanding of migration trends among young adults over time, we calculated order-specific rates, both with and without controlling for individuals’ socio-demographic characteristics. First migration rates () largely followed overall trends; they increased significantly in the 1990s and remained high in the first decade of the twenty-first century, at a level 50 per cent higher than in the late 1980s. After we controlled for educational enrolment and level, the differences across the years vanished. Similarly, second migration rates increased in the 1990s (), although the increase was smaller than it was for first migration rates; again, the changes in population composition by educational enrolment and level largely accounted for the annual variation in migration rates; however, second migration rates for young adults were still somewhat (approximately 10 per cent) higher in the 2000s than in the 1980s, even after standardizing for socio-demographic characteristics. Additionally, we calculated third and fourth migration rates for young adults (). We can observe an increase in these higher-order migration rates in the 1990s, although the increase was much smaller than it was for first migration rates. Again, the annual differences in migration rates largely vanished after we standardized for socio-demographic characteristics, particularly for educational enrolment and level (). Interestingly, however, all standardized migration rates experienced a decline in the early 1990s.
Figure 3 Relative first migration rates for young adults aged 18–29, Sweden, 1986–2009
Notes: As for .
Source: As for .
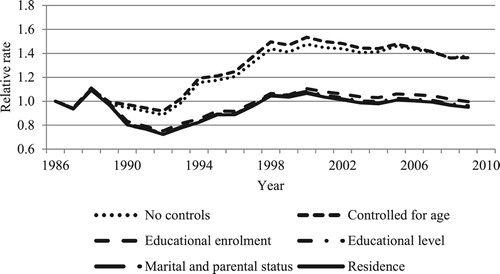
Figure 4 Relative second migration rates for young adults aged 18–29, Sweden, 1986–2009
Notes: As for .
Source: As for .
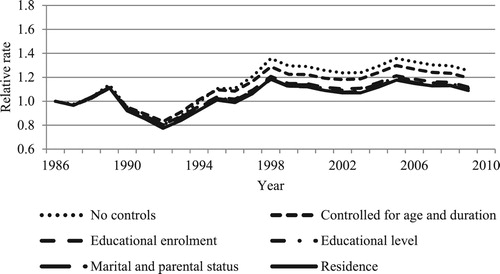
Figure 5 Relative migration rates by order, controlled for age and duration, young adults aged 18–29, Sweden, 1986–2009
Notes: The migration rate in 1986 is the reference point. Standardized for one-year age groups and duration since previous migration (if any).
Source: As for .
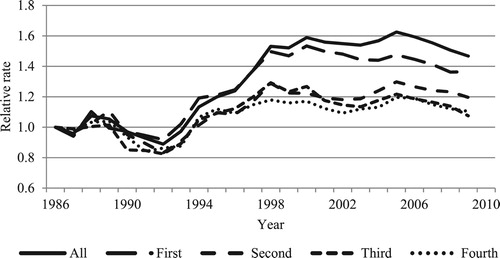
Figure 6 Relative migration rates by order, controlled for all covariates, young adults aged 18–29, Sweden, 1986–2009
Notes: The migration rate in 1986 is the reference point. Standardized for one-year age groups, duration since previous migration (if any), educational enrolment and level, marital and parental status, and residence.
Source: As for .
In further analysis, we explored trends in spatial mobility by age and sex. Our age-specific analysis of migration rates (without migration order) showed that rates increased the most (70 per cent) for individuals aged 18–22, supporting the importance of education-related moves (). Mobility also increased among those aged 23–29 (). Again, after we controlled for educational enrolment and level, the variation in annual mobility rates declined significantly for both age groups. Further analysis showed that first migrations largely determined the overall level of spatial mobility among those aged 18–22, whereas second moves were mostly responsible for the elevated spatial mobility that we observed among those aged 23–29 (see Figures A1 and A2 in the supplementary material). This finding supports the idea that increased migration related to starting and finishing higher education largely explains the increased spatial mobility in the 1990s. We also conducted an analysis based on sex to detect any differences between men and women. Our analysis showed that men and women experienced similar migration patterns during the observation period (Figure A3 in the supplementary material).
Figure 7 Relative migration rates for age group 18–22, Sweden, 1986–2009
Notes: As for .
Source: As for .
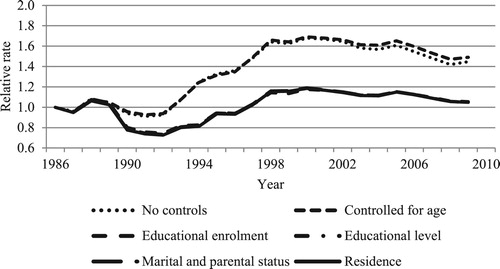
Figure 8 Relative migration rates for age group 23–29, Sweden, 1986–2009
Notes: As for .
Source: As for .
Summary and discussion
In this study, we used longitudinal register data from Sweden to analyse the spatial mobility of young adults (aged 18–29) from 1986 to 2009. Drawing on research by Hoem (Citation1987, Citation1991) and Andersson (Citation1999) we proposed a method for calculating order-specific migration rates and for standardizing migration rates for the socio-demographic characteristics of the population. First, the analysis showed that migration rates for young adults increased significantly in the 1990s; although all order-specific migration rates increased, first migration rates increased the most. Second, changes in population composition, particularly increased enrolment in higher education, accounted for much of the elevated mobility in the 1990s. After we controlled for educational enrolment and level, the variation in annual mobility rates largely disappeared.
Previous studies have shown that enrolment rates did indeed increase significantly in Sweden in the 1990s (Hogskoleverket Citation2013). However, it is possible that a change in the registration of students’ place of residence in 1991 might also have played a role in the elevated spatial mobility, particularly in the first half of the 1990s. Municipalities with large universities observed a substantial increase in the percentage of students registering as residents. In the university town of Linköping, for example, it increased from 50 per cent in the 1980s to 90 per cent in 1994 (Linköpings kommun Citation2014). However, the effect of this change in the registration of students was limited to the early 1990s and was thus modest; the analysis showed that most of the increase in spatial mobility among young adults occurred in the second half of the 1990s.
Our analysis of order-specific migration rates showed that an increase in first migration rates accounted for the elevated spatial mobility among Swedish young adults in the 1990s. Second- and higher-order migration rates also increased, but this increase was modest compared with that of first migration rates. Thus, the analysis, does not support the idea of an increasing polarization of young adults by migration behaviour, that is into those who move many times and those who do not move at all. Rather our study shows that, among recent generations, young adults as a whole are more likely to move at least once, and some are more likely to move twice (mostly because of higher education) than earlier birth cohorts. Clearly, this supports the idea that spatial mobility increased in Sweden in the 1990s due to the expansion of post-secondary education.
We expected that family changes—the postponement of marriage and family formation, alongside increased separation and repartnering—would also have shaped spatial mobility patterns among young adults in Sweden. Interestingly, however, migration patterns changed little (if at all) after we controlled for partnership and parental status. It is possible that the effects of demographic changes become visible only when we analyse moves on other spatial scales, particularly those showing short-distance moves. In our further analysis, we calculated mobility rates for moves between parishes, thus including both long- and short-distance moves. Relative rates of interparish moves increased in the 1990s, although the increases were modest relative to those for longer-distance migrations only (Figure A4 in the supplementary material). After we controlled for educational enrolment and level, the changes in interparish moves over the years disappeared, supporting the idea that education-related long-distance moves were largely responsible for the increased mobility in the 1990s (Figure A4 in the supplementary material). Although future research should explore mobility levels at different spatial scales in detail, our results suggest that changes in migration rates due to the expansion of the post-secondary education were likely to be the most important development in spatial mobility in Sweden in recent decades.
It is possible that changes in life course patterns among young adults, particularly delayed marriage and childbearing, have led to the postponement of some related residential moves to later ages, especially the early 30s. Future analysis of mobility among young adults over time should therefore include a wider age group than 18- to 29-year-olds. However, a recent study by Kolk (Citation2016) has demonstrated that migration age patterns changed very little between 1980 and 2010, with only a minor (if any) increase in mobility among people in their early 30s. Therefore, the possible postponement of moves from the late 20s to the 30s should not challenge the main results and conclusions of our study. Nevertheless, including older age groups in future analysis, would help to determine how increasing levels of education among recent cohorts are likely to shape their mobility later in life. Such analysis will be possible as full migration histories for relevant age groups gradually become available.
Interestingly, after we controlled for compositional changes, migration rates were approximately 20 per cent lower in the early 1990s than in previous and subsequent periods. Sweden was experiencing an economic recession in the early 1990s; the analysis thus suggests that economic cycles, as opposed to other factors, may explain short-term fluctuations in spatial mobility, at least among the working-age population. The fact that migration rates declined in the second half of the 2000s decade seems to further support this argument, although we should be cautious in making final conclusions based on data from a few years only.
Recent European studies have reported an increase in migration rates among young adults in the 1990s (Heins Citation2013; Champion and Shuttleworth Citation2017b); our analysis of migration rates for young adults in other Nordic countries, such as Finland, supports these findings. The results of this study are thus largely consistent with those from other European countries and different from those observed in the US (Fischer Citation2002; Cooke Citation2011; Molloy et al. Citation2017). Champion and Shuttleworth (Citation2017b), drawing on the results of their British study, claim that national diversity might outweigh similarities within those countries classed as advanced economies. Our research tends to support Long’s (Citation1991) observation about significant differences in mobility levels and trends between European and other industrialized countries (see also Kulu et al. Citation2016): these differences may be related to housing markets and the timing of the expansion of tertiary education, but potentially also to cultural factors and welfare state provisions (Esping-Andersen Citation1990). Recent research by Bell et al. (Citation2015) has demonstrated significant variation in levels of spatial mobility across European countries, with Nordic countries exhibiting relatively high mobility; however, the study analysed geographical mobility levels across countries in a single time period.
Our study demonstrates that a larger share of young adults are now ‘on the move’ than a few decades ago; however, much of this change is related to the expansion of higher education in European countries since the 1990s. Our analysis thus only partly supports the idea of the ever increasing mobility of people, technology, and information that is advocated by the ‘new mobilities’ paradigm (Sheller and Urry Citation2006; Sheller Citation2014). Still, the seeming contradiction between the two research streams may be explained as follows: short-term residential changes may have increased significantly because of international travel, whereas levels of permanent residential change have remained stable, apart from young adults now being more mobile than in the past due to tertiary education. These are topics that future research should study explicitly, using the opportunities offered by various forms of new data (passenger surveys, mobile phone data, etc.).
Future research should also investigate spatial mobility by considering the destination of moves, for example, by distinguishing large cities and other urban areas from small towns and rural areas. In addition, studying trends in spatial mobility by population subgroup is important. We examined patterns among young adults based on age and sex, but an investigation of spatial mobility according to various population subgroups, including age groups other than young adults, may reveal some interesting patterns. Previous research suggests that migration rates for families with children may have declined over time, whereas mobility for singles and couples without children may have increased (Lundholm Citation2007). Finally, the study of trends in spatial mobility across educational groups is important for understanding the meaning and implications of increased levels of education among recent cohorts. The method proposed in our study can easily be extended to accommodate the various requirements of spatial mobility analyses. Using Swedish register data, this study showed that spatial mobility among young adults, particularly first migration rates, increased significantly in the 1990s, but not since, and that increased rates of enrolment in higher education were largely responsible for this elevated mobility. The analysis indicated neither ‘ever increasing mobility’ nor the ‘long-term rise in rootedness’ among the young adult population in Sweden.
Supplementary Material
Download PDF (582.5 KB)Notes
1 Please direct all correspondence to Hill Kulu, School of Geography and Sustainable Development, University of St Andrews, Irvine Building, North Street, St Andrews KY16 9AL, United Kingdom; or by E-mail: [email protected]
2 The authors are grateful to three anonymous referees for valuable comments and suggestions on previous versions of this paper. The study was supported by a research grant from the Economic and Social Research Council [ES/L01663X/1] under the Open Research Area Plus scheme. The research for this paper is part of the project ‘Partner relationships, residential relocations and housing in the life course’ (PartnerLife).
References
- Abel, G. J. and N. Sander. 2014. Quantifying global international migration flows, Science 343(6178): 1520–1522. doi: 10.1126/science.1248676
- Andersson, G. 1999. Childbearing trends in Sweden, 1961–1997, European Journal of Population / Revue Europenne de Dmographie 15(1): 1–24. doi: 10.1023/A:1006145610780
- Andersson, G. 2002. Children’s experience of family disruption and family formation: evidence from 16 FFS countries, Demographic Research 7(7): 343–364. doi: 10.4054/DemRes.2002.7.7
- Andersson, G. and M. Kolk. 2011. Trends in childbearing and nuptiality in Sweden: an update with data up to 2007, Finnish Yearbook of Population Research 46: 21–29.
- Andersson, R., J. M. Quigley, and M. Wilhelmson. 2004. University decentralization as regional policy: the Swedish experiment, Journal of Economic Geography 4(4): 371–388. doi: 10.1093/jnlecg/lbh031
- Beck, U. 1992. Risk Society: Towards a New Modernity. London: Sage.
- Bell, M., M. Blake, P. Boyle, O. Duke-Williams, P. Rees, J. Stillwell, and G. Hugo. 2002. Cross-national comparison of internal migration: issues and measures, Journal of the Royal Statistical Society: Series A (Statistics in Society) 165: 435–464. doi: 10.1111/1467-985X.00247
- Bell, M., E. Charles-Edwards, P. Ueffing, J. Stillwell, M. Kupiszewski, and D. Kupiszewska. 2015. Internal migration and development: comparing migration intensities around the world, Population and Development Review 41(1): 33–58. doi: 10.1111/j.1728-4457.2015.00025.x
- Bernard, A., M. Bell, and E. Charles-Edwards. 2014. Life-course transitions and the age profile of internal migration, Population and Development Review 40(2): 213–239. doi: 10.1111/j.1728-4457.2014.00671.x
- Billari, F. C. 2001. The analysis of early life courses: complex descriptions of the transition to adulthood, Journal of Population Research 18(2): 119–142. doi: 10.1007/BF03031885
- Blumen, I., M. Kogan, and P. J. McCarthy. 1955. The Industrial Mobility of Labor as a Probability Process. Cornell Studies of Industrial and Labor Relations 6. Ithaca, New York: Cornell University.
- Borgegård, L. E., J. Håkansson, and G. Malmberg. 1995. Population concentration and dispersion in Sweden—contemporary trends and long-term tendencies, Geografiska Annaler B 77(1): 31–45.
- Brandén, M. 2013. Family Migration and Gender Differentials in Earnings: The Impact of Occupational Sex Segregation. Stockholm Research Reports in Demography 2013:18.
- Cannari, L., F. Nucci, and P. Sestito. 2000. Geographic labour mobility and the cost of housing: evidence from Italy, Applied Economics 32(14): 1899–1906. doi: 10.1080/000368400425116
- Castles, S. and M. J. Miller. 2009. The Age of Migration: International Population Movements in the Modern World (Vol. Fourth Edition). New York: Guilford Press.
- Champion, A. G. 2001. Urbanization, sub-urbanization, counterurbanization, and reurbanization, in R. Paddison (ed), Handbook of Urban Studies. London: Sage, pp. 143–161.
- Champion, A. G. 2016. Internal migration and the spatial distribution of population, in A. G. Champion and J. Falkingham (eds), Population Change in the United Kingdom. London: Rowman & Littlefield International, pp. 125–142.
- Champion, A. G. and I. Shuttleworth. 2017a. Are people changing address less? An analysis of migration within England and Wales, 1971–2011, by distance of move, Population, Space and Place 23(3), e2026. doi: 10.1002/psp.2026
- Champion, A. G. and I. Shuttleworth. 2017b. Is longer-distance migration slowing? An analysis of the annual record for England and Wales since the 1970s, Population, Space and Place 23(3), e2024. doi: 10.1002/psp.2024
- Chan, T. W. and J. Ermisch. 2015. Residential proximity of parents and their adult offspring in the United Kingdom, 2009–10, Population Studies 69(3): 355–372. doi: 10.1080/00324728.2015.1107126
- Chevan, A. and M. Sutherland. 2009. Revisiting Das Gupta: refinement and extension of standardization and decomposition, Demography 46(3): 429–449. doi: 10.1353/dem.0.0060
- Chudnovskaya, M. and M. Kolk. 2017. Educational expansion and intergenerational proximity in Sweden. Population, Space and Place 23(1), e1973. doi: 10.1002/psp.1973
- Clark, W. A. V. and S. Davies Withers. 2007. Family migration and mobility sequences in the United States: spatial mobility in the context of the life course, Demographic Research 17(20): 591–622. doi: 10.4054/DemRes.2007.17.20
- Clark, W. A. V. and S. Davies Withers. 2009. Fertility, mobility and labour-force-participation: a study of synchronicity, Population, Space and Place 15: 305–321. doi: 10.1002/psp.555
- Clark, W. A. V. and Y. Huang. 2003. The life course and residential mobility in British housing markets, Environment and Planning A 35: 323–339. doi: 10.1068/a3542
- Cooke, T. 2011. It is not just the economy: declining migration and the rise of secular rootedness, Population, Space and Place 17, 193–203. doi: 10.1002/psp.670
- Courgeau, D. 1973. Migrants et migrations [migrants and migrations], Population (French Edition) 28(1): 95–129. doi: 10.2307/1530972
- Courgeau, D. 1985. Interaction between spatial mobility, family and career life-cycle: a French survey, European Sociological Review 1(2): 139–162. doi: 10.1093/oxfordjournals.esr.a036382
- Czaika, M. and H. de Haas. 2014. The globalization of migration: has the world become more migratory? International Migration Review 48(2): 283–323. doi: 10.1111/imre.12095
- Davies, R. B. 1993. Nonparametric control for residual heterogeneity in modelling recurrent behaviour, Computational Statistics and Data Analysis 16: 143–160. doi: 10.1016/0167-9473(93)90110-F
- Ermisch, J. and F. Steele. 2016. Fertility expectations and residential mobility in Britain, Demographic Research 135(54): 561–1584.
- Esping-Andersen, G. 1990. The Three Worlds of Welfare Capitalism. Cambridge: Polity Press.
- Findlay, A., D. McCollum, R. Coulter, and V. Gayle. 2015. New mobilities across the life course: a framework for analysing demographically linked drivers of migration, Population, Space and Place 21: 390–402. doi: 10.1002/psp.1956
- Fischer, C. S. 2002. Ever-more rooted Americans, City and Community 1(2): 177–198. doi: 10.1111/1540-6040.00016
- Fischer, P. and G. Malmberg. 2001. Settled people don’t move: on life course and (im-)mobility in Sweden, International Journal of Population Geography 7: 357–371. doi: 10.1002/ijpg.230
- Fotheringham, A. S., P. Rees, A. G. Champion, S. Kalogirou, and A. R. Tremayne. 2004. The development of a migration model for England and Wales: overview and modelling out-migration, Environment and Planning A 36(9): 1633–1672. doi: 10.1068/a36136
- Frey, W. H. 2009. The great American migration slowdown: regional and metropolitan dimensions. Available: https://www.brookings.edu/wp-content/uploads/2016/06/1209_migration_frey.pdf (accessed: 26 February 2018).
- Hedlund, M. and E. Lundholm. 2015. Restructuring of rural Sweden – employment transition and out-migration of three cohorts born 1945–1980, Journal of Rural Studies 42: 123–132. doi: 10.1016/j.jrurstud.2015.10.006
- Heins, F. 2013. Residential mobility in Europe. Paper presented at the International Conference on Population Geographies, Groningen.
- Hoem, J. M. 1987. Statistical analysis of a multiplicative model and its application to the standardization of vital rates: a review, International Statistical Review / Revue Internationale de Statistique 55(2): 119–152.
- Hoem, J. M. 1991. La standardisation indirecte améliorée et son application à la divortialité en suède (1971-1989), Population (French Edition) 46(6): 1551–1568. doi: 10.2307/1533524
- Hoem, J. M. 1993. Classical demographic methods of analysis and modern event-history techniques. International Population Conference. IUSSP, Montreal, Vol. 3: 281–291.
- Hogskoleverket. 2013. Swedish Higher Education Authority. Higher Education in Sweden: 2013 Status Report. Universitetskanslersambetet: Stockholm, Sweden.
- Holland, J. A. 2013. Love, marriage, then the baby carriage? Marriage timing and childbearing in Sweden, Demographic Research 29(11): 275–306. doi: 10.4054/DemRes.2013.29.11
- Kaplan, G. and S. Schulhofer-Wohl. 2017. Understanding the long-run decline in interstate migration, International Economic Review 58(1): 57–94. doi: 10.1111/iere.12209
- Kolk, M. 2016. Period and cohort measures of migration. Stockholm Research Reports in Demography 2016: 05. Stockholm: Stockholm University.
- Kulu, H. 2008. Fertility and spatial mobility in the life-course: evidence from Austria, Environment and Planning A, 40(3): 632–652. doi: 10.1068/a3914
- Kulu, H. and N. Milewski. 2007. Family change and migration in the life course: an introduction, Demographic Research 17(19): 567–590. doi: 10.4054/DemRes.2007.17.19
- Kulu, H. and F. Steele. 2013. Interrelationships between childbearing and housing transitions in the family life course, Demography 50(5): 1687–1714. doi: 10.1007/s13524-013-0216-2
- Kulu, H., J. Mikolai, S. Vidal, C. Schnor, D. Willaert, F. H. L. Visser, C. H. Mulder, and M. J. Thomas. 2016. Separation and spatial mobility: a cross-national comparison. Paper presented at the BSPS Annual Conference in Winchester.
- Kupiszewski, M., H. P. Durham, and P. H. Rees. 1998. Internal migration and urban change in Poland, European Journal of Population 14: 265–290. doi: 10.1023/A:1006058712865
- Lesthaeghe, R. 2010. The unfolding story of the second demographic transition, Population and Development Review 36(2): 211–251. doi: 10.1111/j.1728-4457.2010.00328.x
- Linköpings kommun. 2014. Studenter vid Linköpings universitet: Bostadskommun och folkbokföringskommun 2013. (Place of residence of the Linköping University’s students.)
- Long, L. 1991. Residential mobility differences among developed countries, International Regional Science Review 14(2): 133–147. doi: 10.1177/016001769101400202
- Lundholm, E. 2007. Are movers still the same? Characteristics of interregional migrants in Sweden 1970–2001, Tijdschrift Voor Economische en Sociale Geografie 98(3): 336–348. doi: 10.1111/j.1467-9663.2007.00401.x
- Lundholm, E. 2010. Interregional migration propensity and labour market size in Sweden, 1970–2001, Regional Studies 44: 455–464. doi: 10.1080/00343400802662674
- Lundholm, E. 2012. Returning home? Migration to birthplace among migrants after age 55, Population, Space and Place 18(1): 74–84. doi: 10.1002/psp.645
- Macmillan, R. 2005. The structure of the life course: classic issues and current controversies, in R. Macmillan (ed), The Structure of the Life Course: Standardized? Individualized? Differentiated? Oxford: Elsevier, pp. 3–24.
- Molloy, R., C. L. Smith, and A. Wozniak. 2011. Internal Migration in the United States, Finance and Economic Discussion Series 2011–30. Washington: Federal Reserve Board, Division of Research and Statistics and Monetary Affairs.
- Molloy, R., C. L. Smith, and A. Wozniak. 2017. Job changing and the decline in long-distance migration in the United States, Demography 54: 631–653. doi: 10.1007/s13524-017-0551-9
- Mulder, C. H. and G. Malmberg. 2011. Moving related to separation: who moves and to what distance, Environment and Planning A 43: 2589–2607. doi: 10.1068/a43609
- Mulder, C. H. and M. Wagner. 1998. First-time home-ownership in the family life course: a West German-Dutch comparison, Urban Studies 35(4): 687–713. doi: 10.1080/0042098984709
- Mulder, C. H. and M. Wagner. 2001. The connections between family formation and first-time home ownership in the context of West Germany and the Netherlands, European Journal of Population/ Revue Europenne de Demographie 17: 137–164. doi: 10.1023/A:1010706308868
- Oláh, L. Sz. and E. Bernhardt. 2008. Combining childbearing and gender equality, Demographic Research 19(28): 1105–1144. doi: 10.4054/DemRes.2008.19.28
- Ravenstein, E. G. 1885. The laws of migration – I, Journal of the Statistical Society 48: 167–227.
- Rees, P. H. and M. Kupiszewski. 1999. Internal Migration and Regional Population Dynamics in Europe: A Synthesis. Strasbourg: Council of Europe.
- Rees, P. H., M. Bell, M. Kupiszewski, D. Kupiszewska, P. Ueffing, A. Bernard, E. Charles-Edwards, and J. Stillwell. 2016. The impact of internal migration on population redistribution: an international comparison, Population, Space and Place 23(6): 1–23.
- Rogers, A. and L. J. Castro. 1981. Model Migration Schedules. Research Report RR-81-30. Laxenburg: International Institute for Applied Systems Analysis.
- Rogers, A., F. Willekens, and J. Ledent. 1983. Migration and settlement: a multiregional comparative study, Environment and Planning A 15: 1585–1612. doi: 10.1068/a151585
- Rogerson, P. A. 1987. Changes in U.S. national mobility levels, The Professional Geographer 39(3): 344–351. doi: 10.1111/j.0033-0124.1987.00344.x
- Sheller, M. 2014. The new mobilities paradigm for a live sociology, Current Sociology Review 62(6): 789–811. doi: 10.1177/0011392114533211
- Sheller, M. and J. Urry. 2006. The new mobilities paradigm, Environment and Planning A 38: 207–226. doi: 10.1068/a37268
- Singer, J. D. and J. B. Willett 1993. It’s about time: using discrete-time survival analysis to study duration and timing of events, Journal of Educational Statistics 18(2): 155–195.
- Statistics Sweden. 2010. Construction and Use of Labour Market Areas in Sweden. Örebro: SCB-Tryck.
- Stillwell, J. and A. G. Coll. 2000. Inter-provincial migration of the Spanish workforce in 1988 and 1994, Regional Studies 34(7): 693–711. doi: 10.1080/00343400050178474
- Thomson, E. 2014. Family complexity in Europe, The ANNALS of the American Academy of Political and Social Science 654: 245–258. doi: 10.1177/0002716214531384
- Willekens, F. 1999. The life course: models and analysis, in L. J. G. van Wissen and P. A. Dykstra (eds), Population Issues: An Interdisciplinary Focus. Dordrecht: Kluwer Academic Publishers, pp. 23–51.
- Wilson, T. and P. Rees. 2005. Recent developments in population projection methodology: a review, Population, Space and Place 11: 337–360. doi: 10.1002/psp.389
- Zaring, O., C. M. Eriksson, and C. Magnus. 2009. The dynamics of rapid industrial growth: evidence from Sweden's information technology industry, 1990–2004, Industrial and Corporate Change 18(3): 507–528. doi: 10.1093/icc/dtp010
- Zelinsky, W. 1971. The hypothesis of the mobility transition, The Geographical Review 61(3): 219–249. doi: 10.2307/213996