
 ?Mathematical formulae have been encoded as MathML and are displayed in this HTML version using MathJax in order to improve their display. Uncheck the box to turn MathJax off. This feature requires Javascript. Click on a formula to zoom.
Abstract
During the nineteenth and early twentieth centuries, urban populations in Europe and North America continued to be afflicted by very high mortality as rapid urbanization and industrialization processes got underway. Here we measure the effect of population redistribution from (low-mortality) rural to (high-mortality) urban areas on changes in Scottish life expectancy at birth from 1861 to 1910. Using vital registration data for that period, we apply a new decomposition method that decomposes changes in life expectancy into the contributions of two main components: (1) changes in mortality; and (2) compositional changes in the population. We find that, besides an urban penalty (higher mortality in urban areas), an urbanization penalty (negative effect of population redistribution to urban areas on survival) existed in Scotland during the study period. In the absence of the urbanization penalty, Scottish life expectancy at birth could have attained higher values by the beginning of the twentieth century.
Introduction
The nineteenth century marked major changes in the histories of many populations in Europe and North America, with the beginning of important demographic, social, economic, scientific, and technological revolutions, among other innovations. In the demographic context, important transitions in the three main components of population dynamics—fertility, migration, and mortality—began in many populations: fertility and mortality levels started their remarkable descents, and very high levels of internal and international migration contributed to an unprecedented shift in the composition of the population due to rapid urbanization. The simultaneous occurrence of those events, in particular the decline in mortality and rapid growth of the urban population, has received considerable attention, since substantial gains in survival were achieved despite the growing weight of the population exposed to the urban penalty—that is, to exceedingly high mortality levels in the cities. This paper explores those phenomena for the Scottish population during the period 1861–1910.
In Europe, the urban penalty existed well before the intensification of urbanization in the nineteenth century. In some pre-modern European cities, mortality was so high that population growth depended mainly on migration, as natural increase was negative. De Vries’ (Citation1990) model of urban demographic transition indicates, for instance, that high urban mortality in pre-transitional populations imposed a ceiling on urbanization (see also Dyson Citation2011). Even today, features of urban life continue to have a negative impact on health and survival in some populations (WHO Citation2016), including Scotland (see Walsh et al. Citation2016; National Records of Scotland Citation2017).
In Europe, high mortality in the largest cities became an object of major concern during the nineteenth century, as the number of people exposed to the urban penalty increased dramatically with rapid urbanization. This, together with significant improvements in the collection and quality of population data, explains why many scholars have explored the issue of the urban penalty at that time. In particular, the case of England and Wales has been examined repeatedly, due to England’s distinctive history of early and fast industrialization and urbanization, and the existence of relatively early and abundant demographic data for that country (e.g., Woods Citation1985, Citation2000, Citation2003; Woods et al. Citation1988, Citation1989; Williams and Galley Citation1995).
Numerous studies on the urban penalty during the period of intense urbanization (in England and Wales and elsewhere) have followed a common strategy, comparing mortality levels and indicators of health status—such as life expectancy at birth, crude death or infant mortality rates, and stature—in urban vs. rural or urban vs. total populations (e.g., Preston and van de Walle Citation1978; Eggerickx and Debuisson Citation1990; Riggs Citation1994; Hubbard Citation2000; Haines Citation2001; Martínez-Carrión et al. Citation2014). While that approach gives an idea of the differences in health and survival in urban vs. rural or urban vs. total populations, it does not say whether (and to what extent) rural-to-urban population redistribution had an impact on overall mortality. Although many of these studies include a description of urbanization as a contextual feature, they have not addressed the potential implications of that important relocation of the population in their analyses. To our knowledge, it was mainly Woods (e.g., Citation1985, Citation2000) who explicitly stated the importance of that issue for the nineteenth century and tried to examine it in more detail. Although hypotheses about the possible relationships between urban mortality, urbanization, and migration for early modern European populations have been developed by other scholars (e.g., Sharlin Citation1978; de Vries Citation1984, Citation1990), here we follow the lines of Woods’ research in that we aim to explore the impact of rural-to-urban population redistribution on mortality.
Woods’ research (e.g., Citation1985, Citation2000) highlights the importance of considering urban and rural mortality differentials when trying to understand total mortality trends in the past, and of taking into account compositional shifts between those subpopulations. He showed that, during the nineteenth century, total life expectancy at birth in England and Wales stabilized for decades until the 1860s, despite a rapidly increasing proportion of the population exposed to the insalubrious urban environment. The persistence of the size of the gap in survival between rural and urban populations suggests, according to Woods, that the measures put in place by the sanitary revolution in the largest cities were very important for preventing further deterioration in living conditions: in the absence of those measures, the urban–rural gap would have widened even further. Moreover, when mortality finally declined, the fastest falls occurred in urban areas. Thus, Woods’ findings indicate that the relationship between mortality and urbanization, by which average mortality levels should increase as more people crowd into unhealthy cities (e.g., Wrigley and Schofield Citation1981), does not describe the English experience during the nineteenth century.
To measure the effects of population redistribution on total mortality in nineteenth-century England and Wales, Woods estimated plausible mortality levels for different urban categories (defined by thresholds of population size) and the rural population. He used a method of component estimation where total mortality for England and Wales is conceived as the weighted mean of its urban and rural parts (Woods Citation2000, p. 368). Although that model takes into account information about urban–rural population composition levels, it does not directly address the issue of population redistribution between urban and rural environments. Moreover, the model can yield more than one possible solution (Szreter and Mooney Citation1998).
These considerations point to a clear need for further research on the direct impact of rural-to-urban population redistribution on changes in total mortality during a period when shifts in the composition of the population between those environments were major phenomena. The aim of this study is to measure the effect of population redistribution between urban and rural areas on changes in life expectancy in Scotland between 1861 and 1910. To do this, we introduce and apply a new method that decomposes changes in life expectancy into two main components: (1) the effect of changes in mortality; and (2) the effect of changes in the composition of the population. This method provides answers to questions such as: what was the contribution of urban–rural population redistribution to changes in life expectancy, controlling for the effect of changes in mortality? and vice versa. Among our main results, we show that population redistribution alone had a negative impact on changes in life expectancy in Scotland. Moreover, most of the negative effect of the urban districts was not due to a deterioration in urban survival but to an adverse impact of increases in the proportion of the urban population. In this sense, besides an urban penalty—which refers to mortality levels—our results point to an urbanization penalty. The latter expression refers to the negative effect on survival that resulted from population redistribution from low-mortality rural to high-mortality urban areas.
This study is organized as follows: the next (second) section briefly introduces the historical context, while the third section describes the data. The decomposition method is explained in the fourth section and the corresponding results presented in the fifth section. The sixth and last part concludes.
Historical context: Mortality and urbanization in Scotland, 1861–1910
shows the evolution of life expectancy at birth in Scotland from 1855 to 2016 and by urban and rural categories from 1861 to 1910. Starting from values of around 40–45 years in the late 1850s, life expectancy at birth in Scotland almost doubled, attaining values of around 80 years in recent times (81.06 and 76.93 years for females and males, respectively, in 2016). This increase was not linear over time, but was marked by periods of decrease, stagnation, and increase at different velocities. The most recent period of increase, since the middle of the twentieth century, was characterized by almost no fluctuations (i.e., a near-linear increase in life expectancy at birth) although recent estimates in the Human Mortality Database (HMD) indicate a slight decline in 2015–16. However, compared with the first half of the century, the rise since the 1950s has visibly slowed. Indeed, despite the disruptions caused by the world wars and the Spanish flu pandemic (see Johnson Citation2004), the first half of the twentieth century seems to be the period when the Scottish population experienced the fastest gains in survival. Our study period (1861–1910) is characterized by a slight stagnation from the late 1850s until the mid-1870s, followed by an increase until the early 1890s. This rise was interrupted during the 1890s, due to a general increase in deaths from diarrhoea and dysentery among infants, especially in urban areas (Flinn et al. Citation1977; Woods et al. Citation1988, Citation1989). After that interruption, Scottish life expectancy resumed its rise at the beginning of the twentieth century, at a faster pace than before the 1890s. Thus, our study period contains what seems to be the start of Scotland’s successful battle against early mortality. It should be noted, however, that Scotland has been referred to as the ‘sick man of Europe’, as gains in survival since the mid-twentieth century have been less pronounced there than in most other western European countries (McCartney et al. Citation2012; Whyte and Ajetunmobi Citation2012).
Figure 1 Annual life expectancy at birth in Scotland from 1855 to 20161, by period and urban–rural categories2 from 1861 to 1910, and best-practice trend3, by sex
1We include all the values of life expectancy at birth for Scotland available in the Human Mortality Database (HMD), to provide a better idea of the particularities of our study period 1861–1910 (bounded by the black dashed vertical lines in the figure). 2The points show estimates of life expectancy at birth for different urban–rural categories at the middle of each defined subperiod (see ‘Data’ section). The original categories in the sources were regrouped as shown by the legend, thus: Principal and large towns (urban); Small towns (semi-urban); and Rural. Note that before 1871, the Rural category includes the small towns with fewer than 10,000 inhabitants. 3Life expectancy at birth among the best-practice (record-holding) populations, based on the rates of increase reported in Oeppen and Vaupel (Citation2002). Source: 7th to 56th Detailed Annual Reports of the Registrar General for Scotland; the HMD; Oeppen and Vaupel (Citation2002).
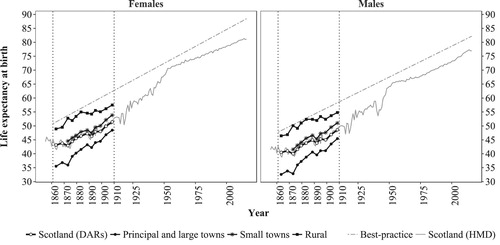
also shows estimates of life expectancy at birth for urban and rural categories in Scotland between 1861 and 1910. Despite the difficulties that may arise in the examination of the evolution of life expectancy at birth in these categories (due to issues of comparability over time and variation in mortality within each category; see ‘Data’ section and Appendix 1 in the supplementary material, respectively), provides an idea of the urban penalty in Scotland during the study period: our estimates for principal and large towns indicate that urban life expectancy at birth in the early 1860s was around 35.5 and 32.6 years for females and males, respectively, compared with 43.1 and 40.5 years in the entire population. This gap of approximately eight years reduced to about three years by the late 1910s, when urban life expectancy at birth was around 48.5 years for females and 45.4 years for males, and total life expectancy was 51.4 and 48.6 years for females and males, respectively. The gap or disadvantage in life expectancy relative to the rural population was considerably higher, as shown by .
Regarding the rural population, it seems reasonable to assume that their expectation of life at birth before 1871 was slightly above the values indicated in , as for those years, small towns with fewer than 10,000 inhabitants were included in the rural category (see ‘Data’ section). Since 1871, when it became possible to distinguish these two subgroups, life expectancy at birth was higher in the rural population than in the total, semi-urban (Small Town Districts), and urban populations. In fact, until the early 1880s, they were not very far from the best-practice populations (i.e., those national populations with the highest recorded levels of life expectancy) in terms of survival (Oeppen and Vaupel Citation2002). Within the rural category, comprised of districts located on the mainland and on the isles, even lower mortality was seen in the ‘insular’ subgroup (Flinn et al. Citation1977). However, during the last two decades of the nineteenth century, a stagnation in rural life expectancy at birth set these populations apart from the best-practice trends. Although the reasons behind that stagnation are beyond the scope of this study, it is worth mentioning some factors that may possibly have played a role in this development, notably the return to the countryside of young people who contracted tuberculosis in urban, industrial centres in the Lowlands (Flinn et al. Citation1977; Hinde Citation2015; Reid and Garrett Citation2018) and the establishment in rural areas of small industries without adequate facilities to reduce their health impacts (Anderson Citation2018).
The Small Town Districts were very similar to the total population in terms of survival. The only particular feature for these populations in is that the gap to the total trend increased from about 1.5 to 2.4 years during the study period, in favour of the Small Town Districts.
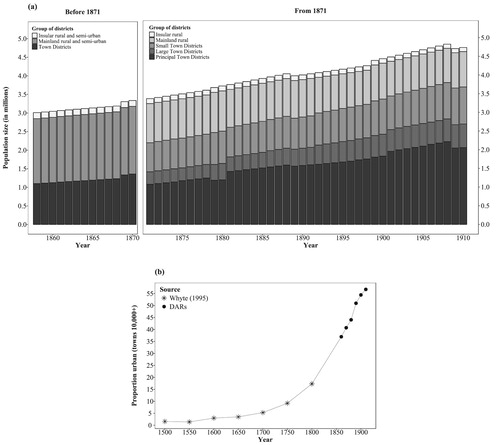
Regarding population growth, composition, and redistribution between urban and rural environments in Scotland during the study period, (a) shows annual estimates of mid-year population size from 1858 to 1910 for different categories, while (b) shows the proportion of the population in towns with 10,000 or more inhabitants, from 1500 to 1910. During our study period, the Scottish population increased from 3 million to over 4.5 million. This increase was accompanied by population redistribution between rural and urban environments, since the proportion of the population living in the largest towns (principal and large town districts combined) increased continuously, from about 36 per cent in 1858 to almost 60 per cent in 1910. In fact, if the estimate for the year 1800 (from Whyte Citation1995) is accurate, the entire nineteenth century was marked by unprecedented growth in the share of the urban population. Although migration was an important factor in this growth, Flinn et al. (Citation1977) argue that natural increase in Scottish urban areas was also important, such that industrial regions in the Lowlands would have been able to meet their own demand for labour needs, at least during the late nineteenth century. Indeed, urban natural increase possibly played an important role in the rapid urbanization process that occurred in Europe during the late-eighteenth and nineteenth centuries (de Vries Citation1990; Dyson Citation2011).
Figure 2 (a) Annual estimates of population size at mid-year, 1858–1910, by district type in Scotland1. (b) Estimates of the proportion of the total population living in cities of 10,000 or more inhabitants, Scotland, 1500–19102
1The bars represent annual estimates of mid-year population by urban–rural category, as reported in each Detailed Annual Report (DAR) from 1858 to 1910. The original urban and rural categories in the sources were retained. There was a change in these categories in 1871 (see ‘Data’ section). In an effort to preserve some continuity with the population data before that change, the 17th DAR provided estimates of population size for each one of the new categories for the year 1861 only (see RGS Citation1875, Table II, p. x). 2The points from the DARs are every tenth year from 1860 to 1910. Source: 4th to 56th Detailed Annual Reports of the Registrar General for Scotland; Whyte (Citation1995).
Finally, it is important to remember that population redistribution refers here to changes in the proportion of the population in different categories resulting from the dynamics of natural increase and migration (internal and international). Regarding the latter, note that large-scale international migration to and from Scotland took place during our study period. Despite substantial return migration and immigration (especially from Ireland), emigration of Scottish-born individuals to England and overseas was larger: in most decades from 1861 to 1910, only the western Lowlands (where most large industrial centres were located) experienced positive migration rates that contributed to population increase (Flinn et al. Citation1977, pp. 304–5).
Data
Sources
The subject of (urban) mortality in Britain has inspired important debates within the field of historical demography (e.g., McKeown and Record Citation1962; McKeown et al. Citation1972; Sharlin Citation1978; Finlay Citation1981; Szreter Citation1988; Harris Citation2004). Most research has focused on England and Wales, despite the existence of relatively abundant, good-quality historical demographic data for Scotland. The well-reputed bills of mortality for the city of Glasgow, which have been available since the 1820s, have been used to illustrate the urban penalty and an approximation of the mortality levels that would have existed in heavily industrialized British cities (e.g., Manchester and Liverpool) before the start of civil registration (e.g., Flinn et al. Citation1977; Szreter and Mooney Citation1998). Urban–rural mortality data from civil registration, from the reports of the Registrar General for Scotland (RGS) and its supplements, have also been used for similar purposes (e.g., Barclay et al. Citation1940; Glass Citation1964; Flinn et al. Citation1977). Here we use data from volumes of the Detailed Annual Report of the Registrar-General of Births, Deaths, and Marriages in Scotland (RGS Citation1865–Citation1912), referred to as the DARs for the remainder of this paper.
The application of the decomposition method (see ‘Methods’ section) requires the use of detailed population and mortality data for subpopulations of interest that sum to a total, for example, all urban and rural environments within a country. Ideally, the mortality data should comprise complete life tables for each subgroup, while the population data should comprise population counts for the same categories, with the same level of detail, for calculating the proportion of the population of each age in each group. Both data sets should correspond to the same years or periods, and more than one year or period should be available to measure the changes in the variables of interest over time.
We used data from the DARs from 1861 to 1910 (RGS Citation1865–Citation1912), available at the Online Historical Population Reports website (Histpop-OHPR project). Since civil registration began in Scotland in 1855, the RGS has produced one summary report on population annually, accompanied by a detailed report, containing more specific information about population and demographic events for different age groups and regions. From these DARs, we digitized mortality information (death counts by age a, that is, in demographic notation, and age-group-specific death rates,
) for each level in the urban–rural hierarchy in Scotland, by sex, for each year from 1861 to 1910. We calculated the corresponding series of population at risk (or exposures,
) by applying the procedure described in the supplementary material (Appendix 2).
For the entire study period, the tables from the DARs contain information with the same level of aggregation by age, comprising data by single year of age for ages 0–4 and grouped data thereafter: by five-year age intervals for ages 5–19, by ten-year age intervals for ages 20 to ω−1 (where ω represents the last open age category), and one group for age ω onwards (where ω = 100 until the year 1900, ω = 90 afterwards). Since our method requires data grouped in age intervals of equal length (ideally one year), we ungrouped these aggregate death counts and exposures using the Penalized Composite Link Model (PCLM) developed by Rizzi et al. (Citation2015). Thus, we obtained good approximations of the number of deaths and size of the mid-year population at each age (0–110+), by sex, in each urban–rural category in Scotland, for each year from 1861 to 1910. Finally, we grouped those annual data into periods of analysis, calculated the set of age-specific death rates for each subpopulation, and systematically computed the corresponding life table for each group using the pash package in ‘R’ (Schöley et al. Citation2017). Therefore, the input data for our method comprised complete life tables from ages 0 to 110+ for each subpopulation.
Urban and rural categories and periods analysed
The urban and rural categories in the sources changed during the study period. Up to 1870, the DARs included only three categories: (1) ‘Towns’ with 10,000 or more inhabitants; (2) rural districts on the ‘Mainland’ (including small towns with fewer than 10,000 inhabitants); and (3) ‘Insular’ rural districts (i.e., those not on the ‘Mainland’). In our analyses, we grouped together both rural categories and treated the ‘Towns’ as urban. In 1871, new divisions were introduced, namely: (1) ‘Principal Town Districts’, cities with 25,000 or more inhabitants (30,000 or more from 1901); (2) ‘Large Town Districts’, cities with 10,000–24,999 inhabitants; (3) ‘Small Town Districts’, towns with 2,000–9,999 inhabitants; (4) rural districts on the ‘Mainland’; and (5) ‘Insular’ rural districts. As with the data before 1871, we combined both rural categories and treated the ‘Principal Town Districts’ together with the ‘Large Town Districts’ as urban. The ‘Small Town Districts’ were treated as semi-urban and were not added to the rural category because we preferred to have separate information for each population. It should be noted, however, that the ‘Large Town Districts’ and ‘Small Town Districts’ contained some rural areas within their boundaries, but in quite small proportions. These differences in the urban–rural categories in the sources, before and after 1871, may create problems of data comparability through time. The way we dealt with those issues is described shortly.
Besides the aforementioned adjustments, we identified years when the content of the urban categories changed with respect to the previous year, that is, years when towns moved from one level to another in the urban hierarchy as they grew in size. In general, this happened soon after a population census, since censuses were the main tool for assessing the size of the population of the country and its regions. In the years between censuses, the same towns were included in the same categories for most years, except when changes in some registration areas were made by the authorities, as occurred in 1875 (see and RGS Citation1880, p. xxxi).
Table 1 Number of towns with 10,000 or more inhabitants, by period and category,1 Scotland 1861–70 to 1901–10
Considering the two previous issues, we needed to identify those points in time when the urban and rural categories changed (due either to a new classification system or a redistribution of towns/counties between categories), since the comparison of categories of population whose definitions and contents vary in time may lead to biased conclusions, such as a significant increase in the size of the urban population, when in reality some towns simply moved from one category to another following a population census. Thus, our comparisons of changes in mortality were made only between years or subperiods that are comparable in terms of their urban–rural components, that is, having the same categories and the same towns within the urban categories. Those comparable years are contained within the periods indicated in .
The identification of the periods shown in implies that, in order to analyse changes in mortality over time, we cannot compare between periods but only within them. As important annual fluctuations in mortality persisted in Scotland during the nineteenth century, the comparison of changes in mortality between single years produces considerable noise, hiding any trends that may have occurred. Thus, within each period shown in , we defined subperiods of equivalent length (at least three years), by grouping together the mortality information from consecutive years. The analyses presented here thus focus on changes in mortality between the following comparable subperiods: 1861–65 vs. 1866–70, 1875–77 vs. 1878–80, 1881–85 vs. 1886–90, 1893–96 vs. 1897–1900, and 1901–05 vs. 1906–10. Note that 1871–74 and 1891–92 are excluded from our comparative analysis, since they would have to be divided into intervals shorter than three years and would thus not be comparable with the other subperiods within the corresponding periods. However, we include information for these two periods in other descriptive analyses.
Methods
Since the 1950s, various methods have been proposed for decomposing differences in a demographic variable of interest into the contributions of meaningful components. In the study of mortality, a common variable of interest is life expectancy at a given age a, , especially at birth,
. The difference between two
values (corresponding to one population at two points in time or to two populations at a specific moment) is commonly decomposed into age-specific or age- and cause-specific effects (e.g., Andreev Citation1982; Arriaga Citation1984; Pressat Citation1985; Pollard Citation1988). In addition, some decomposition methods include a further dimension, estimating the impact of compositional effects (e.g., Andreev et al. Citation2002; Vaupel and Canudas-Romo Citation2002). For example, Shkolnikov et al. (Citation2003) applied a method that decomposes differences in life expectancy and length-of-life inequality (measured by the Gini coefficient) into the age-specific components of changes in mortality and changes in the composition of the population between different subgroups (e.g., educational categories).
Here we introduce an alternative procedure for decomposing changes in life expectancy into the age-specific contributions of changes in mortality and changes in the composition of the population between groups whose mortality levels differ significantly. We apply this method to historical Scottish data, focusing on the effects of population subgroups defined by urban and rural categories during the period 1861–1910. While the method by Shkolnikov and colleagues was based on a sequence-replacement algorithm, our approach relies on the assumption of continuous change in mortality over time. Thus, it shares more fundamental principles with the procedures developed by Keyfitz (Citation1985), Vaupel and Canudas-Romo (Citation2003), and Horiuchi et al. (Citation2008). The latter have shown that the assumption of gradual change provides a justification for the additivity of the contributions of the main components and for the elimination of interaction effects (or residuals). A complete description of the mathematical basis of our approach is presented in the supplementary material (Appendix 3), together with all necessary discrete approximations for computational purposes. Shkolnikov et al.’s (Citation2003) method and ours should yield similar results, as both include an expression showing that the mortality rate at a given age is a weighted sum of the mortality rates at that age in different population subgroups.
The new decomposition method presented here is an extension of one of the mathematical relationships explained in Vaupel and Canudas-Romo (Citation2003). That relationship shows that changes in life expectancy at birth over time in a given population, , can be decomposed in terms of changes in the force of mortality (
), the survival function (
), and life expectancy (
) (see for all matters regarding notation):
(1)
(1) The method introduced here further expands on this age decomposition by including a term that measures the contribution of population redistribution across groups that differ significantly in their mortality levels, such as low-mortality rural vs. high-mortality urban populations. This extension is based on the simple relationship expressed in equation (2), which shows that the total force of mortality in a given population at a certain age and time,
, is a weighted sum of the death rates in each subgroup
, where
is a weighting variable:
(2)
(2) For instance, with subgroups
being rural and urban, the total force of mortality at age 0 (which is approximately equal to the infant mortality rate (IMR)) at a given time can be expressed as a sum of the weighted urban and rural IMRs. Applying properties of derivatives to equation (2), we obtain an expression of the change over time in the force of mortality at age
,
. Replacing
in equation (1), we include information about population redistribution between groups with different mortality rates into the equation of the time derivative of life expectancy. After performing that replacement and reorganizing terms, a new decomposition of changes in life expectancy is obtained (see complete procedure in Appendix 3 of the supplementary material). That decomposition includes not only information about changes in mortality, but also changes in the composition of the population:
(3)
(3) where
is the weighting function
. Equation (3) shows that the time derivative of life expectancy can be decomposed into the contributions of two main components: the first term measures the mortality effect, that is, the contribution of changes in the quantity of deaths (controlling for the composition of the population), whereas the second term measures the compositional effect, that is, the contribution of changes in exposures, such as changes in the proportion of people exposed to urban or rural mortality.
Table 2 Notation1
In addition to the estimation of these two main components, equation (3) can be used to estimate the total contributions by age and population subgroup (as in the framework of cause-of-death decompositions), providing results that are approximately equal to those that would be obtained with other widely known decomposition methods (e.g., Arriaga Citation1984).
Results
In the ‘Historical context’ section, we showed that there was a gradual redistribution of population from high-life-expectancy rural to low-life-expectancy urban environments in Scotland during the study period. Applying our new decomposition method to the Scottish historical data, we will show whether (and to what extent) that redistribution had an impact on changes in life expectancy for the total population. Additionally, considering the rapid improvements in urban survival shown in , we will measure how important those ameliorations were for increasing total life expectancy. The general results are summarized in .
Table 3 Changes in life expectancy at birth between selected periods, and total contributions of changes in mortality and in urban–rural population composition, by sex, Scotland 1861–65 to 1906–10
indicates that, in general, the total changes in life expectancy at birth in Scotland were positive during the study period, the only exception being for males in the 1890s. However, the contributions of changes in mortality were generally higher than the total changes, since the positive effects of reductions in mortality were reduced by the negative impacts of population redistribution from rural to urban environments. For instance, between 1861–65 and 1866–70, Scottish females experienced an annual gain in life expectancy at birth of about 0.13 years per annum. While the total improvements in mortality for females amounted to 0.19 years per annum during that period—that is, almost 2.3 months per year, which is close to the 2.4 months per year achieved by the best-practice countries—the impact of population redistribution diminished that effect by 0.06 years per annum.
That the positive effect of improvements in mortality was reduced by the negative impact of population redistribution from rural to urban areas is noticeable mainly among the nineteenth-century periods in . The last pair of nineteenth-century periods compared, 1893–96 and 1897–1900, corresponds to the crisis years of the 1890s, just before life expectancy started to increase again in the twentieth century (see ). The deterioration in survival during the 1890s is reflected in by the minimal or even negative contributions of changes in mortality (among females and males, respectively) which, furthermore, were considerably reduced by the still negative impact of population redistribution. In the first decade of the twentieth century, when changes in the share of the urban population were trivial compared with those of the nineteenth century, the negative impact of population redistribution was minimal (for females) or totally absent (for males), allowing changes in life expectancy to be explained solely by improvements in survival. In this sense, our results indicate that, besides an urban penalty, Scotland also experienced an urbanization penalty. Whereas the first expression concerns the gap in mortality levels between urban and total or urban and rural populations—as shown in and abundantly discussed elsewhere—the second refers to a process about mortality changes.
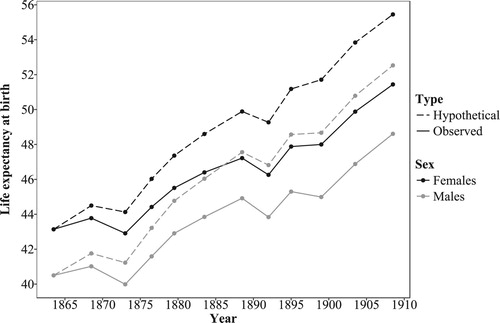
Based on the contributions of changes in mortality alone (which are mostly positive, see ) and applying some assumptions (see supplementary material, Appendix 4), we calculated hypothetical levels of life expectancy without the urbanization penalty, that is, in the absence of the negative impact of changes in the urban–rural composition of the population. shows the results of this exercise. Without the negative impact of population redistribution between urban and rural environments, the total increase in life expectancy at birth in Scotland between 1861–65 and 1906–10 could have been almost 30 per cent instead of 20 per cent. The difference between the observed and hypothetical levels calculated indicates that about four years could have been lost in terms of life expectancy at birth between 1861 and 1910 due to population redistribution between urban and rural environments. This result applies only to our study period, but if it were possible to extend the same exercise to include the first half of the nineteenth century, the cumulated loss in life expectancy due to population redistribution could have been found to be considerably higher (see ‘Conclusions and discussion’ section).
Figure 3 Levels of life expectancy at birth in Scotland, based on rates of change with (‘observed’) and without (‘hypothetical’) the urbanization penalty, by sex, 1861–65 to 1906–101
1Points located at the middle of each time interval as defined in Table A4 (supplementary material). Source: Computed life tables based on data from the Detailed Annual Reports (DARs) of the Registrar General for Scotland (7th to 56th DARs) and the Human Mortality Database; authors’ decomposition results; and Appendix 4 in the supplementary material (Table A4).
In addition to the total effects, our method allows separation of those contributions by age and population subgroups (e.g., urban and rural). (a) and (b) show the annual contributions of changes in mortality and in urban–rural population composition to the total changes in life expectancy at birth, by age, sex, and urban–rural category between 1861–65 and 1906–10.
Figure 4 Annual contributions of changes in mortality and in urban–rural population composition to the total changes in life expectancy at birth in Scotland between selected periods, by sex, urban–rural category, and age: (a) by ten-year age group for ages 0–110; and (b) by single years of age for ages 0–101
1Given the great sensitivity of life expectancy at birth to changes in infant and child mortality during our study period, the results for ages 0–10 are shown by single year of age. Source: Authors’ decomposition results based on data from the Detailed Annual Reports of the Registrar General for Scotland.
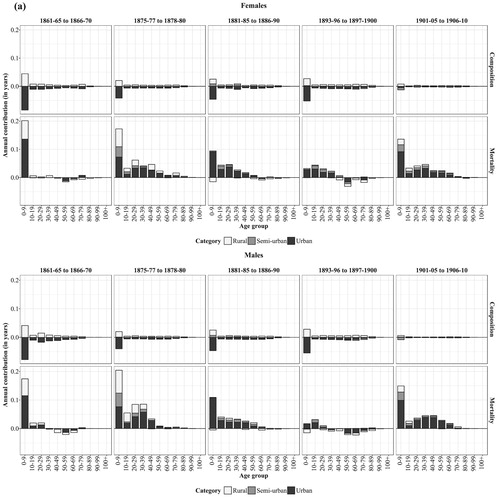
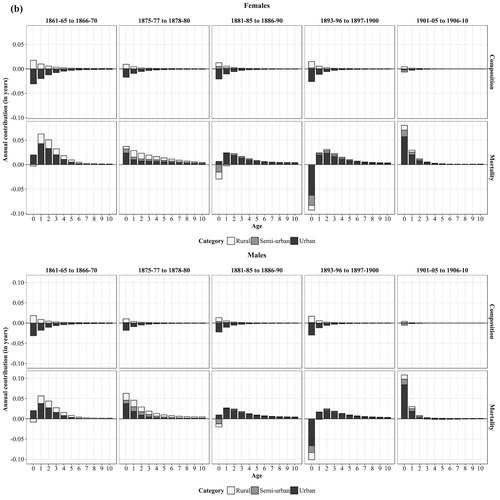
A general overview of (a) and (b) indicates that the urban category had a large impact on mortality change in all periods. In the comparison periods before the 1880s, the contributions of the rural and semi-urban categories to the changes in mortality were also substantial. Notably, the period between 1875 and 1880 was characterized by large improvements in mortality in all regions and at most ages, but especially by reductions in infant and child mortality in rural and semi-urban areas. However, starting from the 1880s, the contributions of these categories reduced considerably, such that the total changes in mortality came to be primarily driven by what happened in the largest towns.
Regarding the contributions by age, (b) suggests that the contributions from infants (aged 0) to the changes in mortality were not particularly large before the 1890s. Indeed, the literature indicates that infant mortality remained relatively high in Scotland during the second half of the nineteenth century, reaching a maximum during the crisis years of the 1890s (Flinn et al. Citation1977). However, IMRs were lower in Scotland than in England and Wales or other European countries during the second half of the nineteenth century.
During the 1890s, total changes in life expectancy were minimal, despite modest improvements in mortality among young children and young adults. (a) and (b) show that, in line with previous research, it was indeed a rise in infant mortality alone (particularly in the largest towns) that was largely responsible for the general stagnation in life expectancy during that decade. By contrast, the new century brought a new situation, where improvements in infant mortality (especially in urban areas) were large and became the most important contributors to changes in mortality. However, improvements among adults in their 20s to 40s (again in urban areas in particular) were important too.
Additionally, (a) indicates that improvements in mortality at ages 10–49 became non-negligible contributors to the general changes in mortality from the mid-1870s, especially in the largest cities. In the 1860s, almost all the changes in mortality were due to improvements among young children (ages 1–4). The comparison between 1861–65 and 1866–70 captures a temporary increase in life expectancy, within a general context of stagnation (see ) due to increased urban child mortality. After the mortality crisis of the middle decades of the nineteenth century, young adults experienced improvements in survival, especially in the largest urban areas; these may have been connected to important reductions in mortality from tuberculosis (Flinn et al. Citation1977).
Concerning the contributions of changes in urban–rural population composition to the changes in life expectancy, (a) and (b) show that, in all periods, the effect was mainly concentrated in the youngest age group (0–9), and within that age group, it was largest at age zero and decreased with age. In almost all cases, the negative effects of this component came exclusively from the urban category, whereas the positive effects corresponded to the rural and semi-urban groups. In fact, it was the large negative effect of increases in the share of the urban population that significantly decreased—or even counterbalanced on some occasions—the positive effect of improvements in urban mortality. indicates that, although improvements in urban mortality had the potential to increase life expectancy considerably for the entire population, the positive effect of those ameliorations was significantly reduced by the negative impact of an increase in the proportion of the urban population. also shows that a few ages (0–4) had a crucial influence on the magnitude of the total urban effect of each component. For instance, in the first pair of periods compared, about half of the negative effect of an increase in the share of the urban population was concentrated in those ages alone. In the same period, practically all the effect of reductions in urban mortality was due to improvements at those ages only. Furthermore, (a) and (b) and show that the negative effect of population redistribution (concentrated at the youngest ages) remained high during the nineteenth century, but practically disappeared during the first decade of the twentieth century. The cessation of that effect occurred because the proportion of the urban population remained almost unchanged between 1901 and 1910 (see ).
Table 4 Annual contribution (in years) of changes in mortality and in population composition to the total changes in life expectancy at birth in Scotland between selected periods, by sex, urban population
To understand the meaning of these results, it is useful to keep in mind that the compositional component captures the effect of population redistribution from rural to urban areas to the changes in total life expectancy. Thus, it is based on information about the changing proportion of the population in each urban–rural category. Since an increase in the proportion of the population in urban areas is necessarily accompanied by an equal decrease in the proportion in the other regions, the negative effects by age group are almost mirrored by positive effects. Nevertheless, the fact that the sum of these effects is negative in all cases (as shown by the final column of ), indicates the existence of meaningful differences in mortality conditions between urban and rural areas. Indeed, population pressure and the unhealthy environment in the largest towns accounted for the negative effect of population transfer from rural to urban areas on the changes in total life expectancy. Given that life expectancy at birth was highly sensitive to changes in mortality at the youngest ages (especially age zero), it was particularly the transfer of births from rural to urban areas that had the largest negative effect on the changes in life expectancy. By the term transfer we do not necessarily refer to migration, but to an increase in the proportion of the population in the largest cities, who would have otherwise been exposed to lower (rural and semi-urban) mortality.
Conclusions and discussion
Together with the urban penalty, the issue of urbanization has frequently been highlighted as a major contextual feature in many studies of population and mortality during the nineteenth and early twentieth centuries. Nevertheless, the impact of urbanization or rural-to-urban population redistribution on mortality has not been measured directly until now.
Here we introduced and applied a method that allowed changes in life expectancy to be decomposed into the contributions of two main components: (1) the effect of changes in mortality; and (2) the effect of changes in population composition between groups with markedly different mortality levels (here urban and rural populations). Consistent with Woods’ (Citation2000) hypothesis for England and Wales, we found that Scottish population redistribution from rural to urban areas had a negative impact on changes in total life expectancy from 1861 to 1910. Thus, our results suggested the existence of an urbanization penalty during that period. This was marked by intense urban population growth as well as by a persistent urban penalty. We proposed the term urbanization penalty to refer to the negative effect of population redistribution from relatively low-mortality (rural) to high-mortality (urban) environments on the changes in mortality for the total population. In that sense, both the urban and urbanization penalties constitute complementary dimensions of the phenomenon of urban mortality within a context of intense population redistribution.
Although we found evidence of an urbanization penalty, our results showed that its effect was, at least during the period covered by this study, always smaller than the effect of changes in mortality. Moreover, leaving aside the crisis years of the 1890s, its negative effect declined during the last decades of the nineteenth century and the first decades of the twentieth. This could have been associated with a slowing down of the urbanization process during the early twentieth century as well as with significant improvements in the urban environment, which finally started to counter the negative effects of crowding during the last third of the nineteenth century (Szreter Citation1988, p. 25). For Scotland, it has been shown, for instance, that the city of Glasgow was only slightly affected by the cholera outbreak that hit that country in 1866 (Flinn et al. Citation1977). While the city had always been hard hit in the three previous episodes, the 1866 cholera epidemic did not raise mortality levels much. This ‘relative immunity’ may have been connected to significant improvements in the distribution of clean water between the third and fourth epidemics. It is indeed possible that the sanitary revolution prevented average mortality deteriorating, as argued by Woods (Citation2000) for England and Wales: our results showed that changes in life expectancy in Scotland were positive during the study period, despite rapid urbanization. The previous discussion indicated the possibility that improvements in the urban environment may have had a double effect: reducing the negative effect of urban population concentration and enhancing improvements in survival. Although an interaction between mortality levels and proportions urban may indeed have existed in our study context, the measurement of such an effect would require an extension of the method presented here, using individual data, which is beyond the scope of this paper. Instead, the continuous approach underlying our decomposition method allows complete separation of the effects of the main components without further data demands.
During the first half of the nineteenth century, before our study period, it is possible that the urbanization penalty had an even larger negative effect on the changes in total mortality. Indeed, the proportion of the population in urban areas rose steadily from the beginning of the nineteenth century (see ), but cities were inadequately prepared for hosting rapidly growing populations. Moreover, mortality conditions in Britain in general were particularly bad, especially during the second quarter of the nineteenth century: the mortality crisis decades of the 1830s to the 1850s affected mainly large urban areas and reflected the ‘failure of municipal governments to cope with the public health problems arising from urban populations of unprecedented size and density’ (Flinn et al. Citation1977, p. 371). Even McKeown (Citation1976), who attributed a minor role to public health improvements in the English mortality decline and instead gave a key role to rising living standards, acknowledged that the appearance of cholera was associated with by-products of rapid urbanization, namely, the deterioration in hygiene conditions and the increased exposure to water- and food-borne diseases. The public health problems that became more acute with rapid urban population growth were mainly associated with inadequate provision of housing, drainage, and clean water. These issues progressively began to be solved during the last decades of the nineteenth century.
In connection with this discussion, it may be pointed out that important variations—in mortality levels, as well as in the start and pace of the mortality decline—existed within the urban category. Those variations were hidden in our results, where all cities with 10,000 or more inhabitants were pooled together. Likewise, the rural category, including small towns before 1871, hides important internal variations. For instance, ‘insular’ rural areas, where a very small proportion of the population lived, experienced higher life expectancy at birth than ‘mainland’ rural districts throughout the entire study period. In the course of industrialization, some rural villages and small towns became quite unhealthy due to the establishment of small industries, and new communities emerged in places with no or deficient sewage and water supply systems (Anderson Citation2018). These examples indicate that, within each of the urban–rural categories used here, there were numerous mortality trajectories experienced by different localities (e.g., Appendix 1 in the supplementary material shows the variation in mortality within different groups of registration districts in 1871). However, the details of all those local trajectories are beyond the scope of this study. A discussion of spatial variations in mortality in Scotland since the mid-nineteenth century can be found in Anderson (Citation2018).
Additionally, it is worth highlighting that, although migration contributed to rapid urbanization in Scotland during our study period, it was not a simple, unidirectional process. Indeed, return and temporary migration of individuals between urban and rural locations may have had an impact on local mortality levels. As already noted, the return to the countryside of migrants who had contracted tuberculosis in the cities may have increased tuberculosis-related mortality in their rural communities. In addition, deaths of temporary migrants and non-urban residents in institutions such as hospitals may have increased urban mortality (and decreased rural mortality) at certain ages, as demonstrated for Denmark during the early twentieth century (Danmarks Statistik Citation1919) and for some Spanish cities in 1877–78 (Ramiro Fariñas Citation2007). For Scotland, however, it is not clear whether this was the case (see Anderson Citation2018). These issues, while relevant to our study, could not be directly addressed in our analyses, as they require other kinds of methods and data (e.g., regression analyses using individual data).
Finally, beyond the issue of the urban penalty, this study has contributed to the line of research focusing on the origins of the historical increase in life expectancy (e.g., Oeppen and Vaupel Citation2002), since it has explored the relationship between important aspects connected to that phenomenon. Although the causes and characteristics of the mortality decline have been objects of intense scientific attention and debate (e.g., McKeown and Record Citation1962; McKeown et al. Citation1972; Razzell Citation1974; Kunitz Citation1983; Fridlizius Citation1984; Fogel Citation1986; Szreter Citation1988; Colgrove Citation2002; Cutler et al. Citation2006), the crucial role of compositional changes in the population has rarely been an explicit part of that discussion. Thus, by bringing together both major phenomena—changes in mortality and in urban–rural population redistribution—the method introduced here may bring new elements of understanding in that regard. For instance, low urbanization levels have been considered as one of the reasons for Nordic countries—namely, Norway and Sweden—frequently being leaders in life expectancy during the nineteenth century (Bengtsson Citation2006). On the contrary, a high ‘urban toll’ has been thought of as one of the main reasons for more economically advanced societies, such as Britain during the nineteenth century, not achieving higher levels of life expectancy. The new method proposed here has allowed further exploration of these important issues by measuring the contributions of urban mortality and population redistribution to changes in life expectancy.
Supplementary Material
Download PDF (87.1 KB)ORCID
Catalina Torres http://orcid.org/0000-0003-3165-6339
Vladimir Canudas-Romo http://orcid.org/0000-0001-6532-0089
Notes
1 Catalina Torres and Jim Oeppen are at the Interdisciplinary Center on Population Dynamics (CPop), University of Southern Denmark, Odense, Denmark. Vladimir Canudas-Romo is at the School of Demography, Australian National University, Canberra, Australia. Please direct all correspondence to Catalina Torres, J. B. Winsløws Vej 9B, 5000 Odense C, Denmark; or by E-mail: [email protected]
2 The authors thank Michael Anderson for his interesting and insightful comments, which helped to improve the paper, as well as Marius D. Pascariu for his help with technical aspects regarding data handling. The first author wrote parts of this paper while visiting the School of Demography at the Australian National University; she thanks them for their kind disposition. This work was supported by the Faculty of Health Sciences, University of Southern Denmark.
References
- Anderson, M. (2018). Scotland’s Populations from the 1850s to Today. Oxford: Oxford University Press.
- Andreev, E. M., 1982. Metod komponent v analize prodoljitelnosty zjizni [The method of components in the analysis of length of life]. Vestnik Statistiki, 9, 42–47.
- Andreev, E. M., V. M. Shkolnikov, and A. Z. Begun. 2002. Algorithm for decomposition of differences between aggregate demographic measures and its application to life expectancies, healthy life expectancies, parity-progression ratios and total fertility rates, Demographic Research 7(14): 499–522. doi: 10.4054/DemRes.2002.7.14
- Arriaga, E. 1984. Measuring and explaining the change in life expectancies, Demography 21(1): 83–96. doi: 10.2307/2061029
- Barclay, R. S., W. O. Kermack, and A. G. McKendrick. 1940. Comparison of the specific mortality rates in town and country districts of Scotland since 1871, Journal of Hygiene 40(4): 423–433.
- Bengtsson, T. 2006. Linear increase in life expectancy: past and present, in T. Bengtsson (ed), Perspectives on Mortality Forecasting. The Linear Rise in Life Expectancy: History and Prospects. Stockholm: Försäkringskassan, Swedish Social Insurance Agency, Vol. 3, pp. 83–96.
- Colgrove, J. 2002. The McKeown thesis: a historical controversy and its enduring influence, American Journal of Public Health 92(5): 725–729. doi: 10.2105/AJPH.92.5.725
- Cutler, D., A. Deaton, and A. Lleras-Muney. 2006. The determinants of mortality, Journal of Economic Perspectives 20(3): 97–120. doi: 10.1257/jep.20.3.97
- Danmarks Statistik. 1919. Ægteskaber, fødte og døde I aarene 1911–15 [Marriages, births and deaths in the years 1911–15]. København: Femte række, Litra A Nr. 13.
- de Vries, J. 1984. European Urbanization, 1500–1800. London: Methuen.
- de Vries, J. 1990. Problems in the measurement, description, and analysis of historical urbanization, in A van der Woude, A. Hayami and J. de Vries (eds), Urbanization in History. Oxford: Clarendon Press, pp. 43–60.
- Dyson, T. 2011. The role of the demographic transition in the process of urbanization, Population and Development Review 37 (Supplement): 34–54. doi: 10.1111/j.1728-4457.2011.00377.x
- Eggerickx, T. and M. Debuisson. 1990. La surmortalité urbaine: le cas de la Wallonie et de Bruxelles à la fin du XIXe siècle (1889–1892) [Urban excess mortality: the case of Wallonia and Brussels at the end of the 19th century (1889–1892)], Annales de démographie historique, Démographie des villes et des campagnes, pp. 23–41.
- Finlay, R. 1981. Natural decrease in early modern cities, Past and Present 92: 169–174. doi: 10.1093/past/92.1.169
- Flinn, M., J. Gillespie, N. Hill, A. Maxwell, R. Mitchison, and C. Smout. 1977. Scottish Population History, from the 17th Century to the 1930s. Cambridge: Cambridge University Press.
- Fogel, R. W. 1986. Nutrition and the decline in mortality since 1700: some preliminary findings, in S. L. Engerman and R. E. Gallman (eds), Long-Term Factors in American Economic Growth. Chicago: University of Chicago Press, pp. 439–556.
- Fridlizius, G. 1984. The mortality decline in the first phase of the demographic transition: Swedish experiences, in T. Bengtsson, G. Fridlizius, and R. Ohlsson (eds), Pre-Industrial Population Change: The Mortality Decline and Short-Term Population Movements. Lund: Almquist and Wiksell International, pp. 75–114.
- Glass, D. V. 1964. Some indicators of differences between Urban and Rural Mortality in England and Wales and Scotland, Population Studies 17 (3): 263–267. doi: 10.1080/00324728.1964.10405771
- Haines, M. R. 2001. The Urban mortality transition in the United States, 1800–1940, Annales de démographie historique 101(1): 33–64. doi: 10.3917/adh.101.0033
- Harris, B. 2004. Public health, nutrition, and the decline of mortality: the McKeown thesis revisited, Social History of Medicine 17(3): 379–407. doi: 10.1093/shm/17.3.379
- Hinde, A. 2015. Sex differentials in phthisis mortality in England and Wales, 1861–1870, The History of the Family 20(3): 366–390. doi: 10.1080/1081602X.2015.1051077
- Histpop–Online Historical Population Reports (OHPR). University of Essex. Available: www.histpop.org
- Horiuchi, S., J. R. Wilmoth, and S. D. Pletcher. 2008. A decomposition method based on a model of continuous change, Demography 45(4): 785–801. doi: 10.1353/dem.0.0033
- Hubbard, W. H. 2000. Urban penalty: towns and mortality in nineteenth-century Norway, Continuity and Change 15(2): 331–350. doi: 10.1017/S0268416099003549
- Human Mortality Database. Berkeley (USA): University of California and Max Planck Institute for Demographic Research (Germany). Available: www.mortality.org.
- Johnson, N. 2004. Scottish ’Flu: the Scottish experience of ‘Spanish Flu’, Scottish Historical Review 83(216): 216–226. doi: 10.3366/shr.2004.83.2.216
- Keyfitz, N. 1985. Applied Mathematical Demography. 2nd ed. New York: Springer.
- Kunitz, S. J. 1983. Speculations on the European mortality decline, The Economic History Review 36(3): 349–364. doi: 10.2307/2594969
- Martínez-Carrión, J. M., P. M. Pérez-Castroviajo, J. Puche Gil, and J. M. Ramon-Muñoz. 2014. La brecha rural-urbana de la estatura y el nivel de vida al comienzo de la industrialización española [The rural-urban gap in heights and living standards at the beginning of Spanish industrialization], Historia Social 80: 35–57.
- McCartney, G., D. Walsh, B. Whyte, and C. Collins. 2012. Has Scotland always been the ‘sick man’ of Europe? An observational study from 1855 to 2006, European Journal of Public Health 22(6): 756–760. doi: 10.1093/eurpub/ckr136
- McKeown, T. 1976. The Modern Rise of Population. London: Arnold.
- McKeown, T. and R. G. Record. 1962. Reasons for the decline of mortality in England and Wales during the nineteenth century, Population Studies 16(2): 94–122. doi: 10.1080/00324728.1962.10414870
- McKeown, T., R. G. Brown, and R. G. Record. 1972. An interpretation of the modern rise of population in Europe, Population Studies 26(3): 345–382. doi: 10.1080/00324728.1972.10405908
- National Records of Scotland. 2017. Life Expectancy for Administrative Areas within Scotland 2014–2016. Available: https://www.nrscotland.gov.uk/statistics-and-data/statistics/statistics-by-theme/life-expectancy/life-expectancy-in-scottish-areas/2014-2016.
- Oeppen, J. and J. W. Vaupel. 2002. Broken limits to life expectancy, Science 296 (5570): 1029–1031. doi: 10.1126/science.1069675
- Pollard, J. H. 1988. On the decomposition of changes in expectation of life and differentials in life expectancy, Demography 25: 265–276. doi: 10.2307/2061293
- Pressat, R. 1985. Contribution des écarts de mortalité par âge à la différence des vies moyennes [The significance of variations in mortality by age on differences in life expectancy], Population 40(4–5): 766–770. doi: 10.2307/1532986
- Preston, S. and E. Van de Walle. 1978. Urban French mortality in the nineteenth century, Population Studies 32(2): 275–297. doi: 10.1080/00324728.1978.10410715
- Ramiro Fariñas, D. 2007. Mortality in hospitals and mortality in the city in nineteenth- and twentieth-century Spain: The effect on the measurement of urban mortality rates of the mortality of outsiders in urban health institutions, in J. Henderson, P. Horden, and A. Pastore (eds), The Impact of Hospitals, 300–2000, Oxford and Bern: Peter Lang, pp. 395–416.
- Razzell, P. E. 1974. ‘An interpretation of the modern rise of population in Europe’—A critique, Population Studies 28(1): 5–17.
- Registrar General for Scotland (RGS). 1865–1912. Detailed annual report of the registrar-general of births, deaths, and marriages in Scotland, Volumes 7th to 56th. Available: Histpop–Online Historical Population Reports (OHPR).
- Registrar General for Scotland (RGS). 1875. Seventeenth detailed annual report of the Registrar General of Births, Deaths and Marriages in Scotland, Edinburgh: Murray and Gibb. Available: Histpop-Online Historical Population Reports (OHPR).
- Registrar General for Scotland (RGS). 1880. Twenty-first detailed annual report of the Registrar General of Births, Deaths and Marriages in Scotland, Edinburgh: Neill and Company. Available: Histpop-Online Historical Population Reports (OHPR).
- Reid, A. and E. Garrett. 2018. Mortality, work and migration: a consideration of age-specific mortality from tuberculosis in Scotland, 1861–1901, Historical Life Course Studies 6(Special issue 1): 111–132.
- Riggs, P. 1994. The standard of living in Scotland, 1800–1850, in J. Komlos (ed), Stature, Living Standards, and Economic Development: Essays in Anthropometric History. Chicago: University of Chicago Press, pp: 60–75.
- Rizzi, S., J. Gampe, and P. H. Eilers. 2015. Efficient estimation of smooth distributions from coarsely grouped data, American Journal of Epidemiology 182(2): 138–147. doi: 10.1093/aje/kwv020
- Schöley, J., M. Pascariu, F. Villavicencio, M. Danko, I. Stott, and A. Baudisch. 2017. Pash – pace and shape analysis in R. Version 0.0.3. Available: github.com/jschoeley/pash.
- Sharlin, A. 1978. Natural decrease in early modern cities: a reconsideration, Past and Present 79(1): 126–138. doi: 10.1093/past/79.1.126
- Shkolnikov, V. M., E. M. Andreev, and A. Z. Begun. 2003. Gini coefficient as a life table function, Demographic Research 8(11): 305–358. doi: 10.4054/DemRes.2003.8.11
- Szreter, S. 1988. The importance of social intervention in Britain's mortality decline c. 1850–1914: a re-interpretation of the role of public health, Social History of Medicine 1(1): 1–38. doi: 10.1093/shm/1.1.1
- Szreter, S. and G. Mooney. 1998. Urbanization, mortality, and the standard of living debate: new estimates of the expectation of life at birth in nineteenth-century British cities, The Economic History Review 51(1): 84–112. doi: 10.1111/1468-0289.00084
- Vaupel, J. W. and V. Canudas-Romo. 2002. Decomposing demographic change into direct vs. compositional components, Demographic Research 7(1): 1–14. doi: 10.4054/DemRes.2002.7.1
- Vaupel, J. W. and V. Canudas-Romo. 2003. Decomposing change in life expectancy: a bouquet of formulas in honor of Nathan Keyfitz’s 90th birthday, Demography 40(2): 201–216. doi: 10.1353/dem.2003.0018
- Walsh, D., G. McCartney, C. Collins, M. Taulbut, and G. D. Batty. 2016. History, politics and vulnerability: explaining excess mortality in Scotland and Glasgow. Available: http://www.gcph.co.uk/publications/635_history_politics_and_vulnerability_explaining_excess_mortality
- Whyte, B. and T. Ajetunmobi. 2012. Still ‘The Sick Man of Europe’?: Scottish Mortality in a European Context 1950–2010, an Analysis of Comparative Mortality Trends. Glasgow: Glasgow Centre for Population Health.
- Whyte, I. 1995. Scotland before the Industrial Revolution: An Economic and Social History, c1050–c1750. London: Longman.
- Williams, N. and C. Galley. 1995. Urban-rural differentials in infant mortality in Victorian England, Population Studies 49: 401–420. doi: 10.1080/0032472031000148746
- Woods, R. 1985. The effects of population redistribution on the level of mortality in nineteenth-century England and Wales, The Journal of Economic History 45(3): 645–651. doi: 10.1017/S0022050700034549
- Woods, R. 2000. The Demography of Victorian England and Wales. Cambridge: Cambridge University Press.
- Woods, R. 2003. Urban–rural mortality differentials: an unresolved debate, Population and Development Review 29: 29–46. doi: 10.1111/j.1728-4457.2003.00029.x
- Woods, R. I., P. A. Watterson, and J. H. Woodward. 1988. The causes of rapid infant mortality decline in England and Wales, 1861–1921, part I, Population Studies 42 (3): 343–366. doi: 10.1080/0032472031000143516
- Woods, R. I., P. A. Watterson, and J. H. Woodward, 1989. The causes of rapid infant mortality decline in England and wales, 1861–1921. part II, Population Studies 43(1): 113–132. doi: 10.1080/0032472031000143876
- World Health Organization (WHO). 2016. Global report on urban health: equitable, healthier cities for sustainable development.
- Wrigley, E. A. and R. S. Schofield. 1981. The Population History of England, 1541–1871: A Reconstruction. London: Arnold.