
 ?Mathematical formulae have been encoded as MathML and are displayed in this HTML version using MathJax in order to improve their display. Uncheck the box to turn MathJax off. This feature requires Javascript. Click on a formula to zoom.
Abstract
It is uncertain whether Latin America and Caribbean (LAC) countries are approaching a single mortality regime. Over the last three decades, LAC has experienced major public health interventions and the highest number of homicides in the world. However, these interventions and homicide rates are not evenly shared across countries. This study documents trends in life expectancy and lifespan variability for 20 LAC countries, 2000–14. By extending a previous method, we decompose differences in lifespan variability between LAC and a developed world benchmark into cause-specific effects. For both sexes, dispersion of amenable diseases through the age span makes the largest contribution to the gap between LAC and the benchmark. Additionally, for males, the concentration of homicides, accidents, and suicides in mid-life further impedes mortality convergence. Great disparity exists in the region: while some countries are rapidly approaching the developed regime, others remain far behind and suffer a clear disadvantage in population health.
Introduction
The epidemiological transition theory (Omran Citation1971) is the starting point and obligatory reference for any global mortality convergence study. This theory sets out global mortality convergence towards a single mortality regime as a feature of the changes in the dynamics of disease and health. However, since its original publication, the theory has been much criticized. For example, Olshansky and Ault (Citation1986) argued that the reduction of cardiovascular diseases was not anticipated and the role of the healthcare systems was omitted. Frenk et al. (Citation1991) demonstrated that, in less developed countries, changes between epidemiological transition stages are not well defined and not all countries experience the same stages. They argued that changes in mortality patterns result from an organized social response to health conditions within a framework of health transition. Following on from this, Vallin and Mesle (Citation2004) suggested a re-examination of the epidemiological transition theory and integrated it as the first stage of a global process of health transition.
More recently, the study of mortality convergence has gained notable attention. For instance, Mayer-Foulkes (Citation2001) argued that life expectancy trajectories of different nations can be grouped into ‘convergence clubs’. These clubs are defined as large-scale clusters of countries with similar life expectancy trends over time. Bloom and Canning (Citation2007) examined which convergence clubs had experienced larger increases in their life expectancies during the 1960s. They found general progress towards higher life expectancies, with several countries jumping from high- to low-mortality clusters, the latter being mostly developed countries. Along the same lines, Wilson (Citation2011) suggested that a global demographic change has taken place during the last century. He argued that inequalities between developed and less developed countries stem from the different onsets of their transitions and the speed of these demographic changes. Altogether, the findings of these studies suggest that the mortality gap between nations has been narrowing and, at the same time, the population health statuses of countries are converging towards similar regimes. This previous research, however, does not explain in detail the mortality dynamics of Latin America and the Caribbean (LAC). Wilson (Citation2011), for example, categorized the region in an ‘other developing countries’ category without providing any further insight about this set of countries.
Some researchers have recently found evidence against mortality convergence and in support of prevailing health inequalities. Caselli et al. (Citation2002), for instance, identified a contradiction between the rapid increases in life expectancy observed in developed countries and the stagnation in less developed nations. McMichael et al. (Citation2004) pointed out that nations can be grouped into those that have shown rapid gains in life expectancy, those whose achieved gains are stagnating, and those in which the trends have reversed. It is not clear in which category LAC is included, since the authors only analysed a few countries (such as Chile, Mexico, and Haiti) that do not fully represent the region. In Chile and Mexico, rapid gains in life expectancy were identified from 1950 to 2000, as was a convergence towards developed countries. However, this study did not address the recent stagnation of life expectancy in Mexico (Canudas-Romo et al. Citation2015). McMichael et al. (Citation2004) also argued that inequalities between countries are impediments to convergence and that future health gains are not guaranteed by any deterministic process of convergence. Other studies have shown that economic development plays different roles in improving life expectancy and reducing infant mortality. Such differences are more noticeable in comparisons between poorer and wealthier nations (Clark Citation2011). In such comparisons, development contributes to convergence in life expectancy but divergence in infant mortality, since poorer countries are slower in bringing down infant mortality. Further, Moser et al. (Citation2005) indicated that since the late 1980s, the world has not only failed to become a more equal place in terms of mortality, but has in fact become less equal.
Latin American mortality profiles
Researchers have situated most LAC countries at the advanced stages of the epidemiological transition (Frenk et al. Citation1996). During the second half of the twentieth century, child and infant mortality declined in LAC and reductions in adult mortality were observed. However, the region exhibited large heterogeneity. Since the 1950s, Argentina, Chile, Costa Rica, Cuba, and Panama have shown rapid progress towards the attainment of life expectancies at age 60 similar to those of developed nations (Palloni and Pinto-Aguirre Citation2011). The downturn in infectious diseases and the stable trends in circulatory diseases are recognized to be the main reasons for these gains (Palloni and Pinto-Aguirre Citation2011). Conversely, in other nations, such as Haiti, the gap remains and life expectancy has even decreased (McMichael et al. Citation2004). The high prevalence of cardiovascular diseases has encouraged such trends. Diabetes has also made a large contribution to the high mortality among men and women in LAC (Canudas-Romo et al. Citation2015; Klenk et al. Citation2016). Likewise, neoplasms have shown an upward trend in Bolivia, Ecuador, Guatemala, Nicaragua, Peru, Paraguay, El Salvador, and Venezuela (Klenk et al. Citation2016). In addition to these health issues, the region seems to be running into other unprecedented obstacles. For instance, there is evidence that longevity in Mexico has recently stagnated due to increasing violence and homicide (Aburto et al. Citation2016, Citation2018). These phenomena seem to be replicating across the region: in recent years interpersonal violence has been an important contributor to deaths among men in Brazil, Colombia, El Salvador, Guatemala, Honduras, and Venezuela, and to a lesser extent in Cuba, Costa Rica, Bolivia, and Peru (Naghavi et al. Citation2015).
Efforts from LAC governments to improve mortality trends and advance health have been translated into several healthcare policies. In most LAC countries, social movements have contributed to healthcare system reforms. Conversely, in Colombia, Costa Rica, and Mexico, the changing epidemiological profile has been the main driver of these reforms (Atun et al. Citation2015). Major policy initiatives have focused on improving maternal and infant health. Most of the recent policy interventions in LAC have aimed for universal coverage of basic healthcare services. Brazil, Chile, and Mexico have made great strides towards this goal (WHO Citation2010, Citation2013). In 2003, the Mexican government introduced a universal healthcare coverage scheme named Popular Health Insurance (Seguro Popular) (Frenk et al. Citation2006). This insurance package eliminated user fees and nowadays covers over 50 million people (Knaul et al. Citation2012; Dmytraczenko and Almeida Citation2015). Governments in Brazil and Cuba have implemented tax-financed universal health systems, combined with interventions aimed at alleviating poverty and improving health access for the most disadvantaged populations (Atun et al. Citation2015). In Chile and Costa Rica, initiatives to expand primary healthcare to the poor have been implemented. These policies have brought positive results, even in a context of slow economic growth, uneven income distribution, and high prevalence of poverty (McGuire Citation2001). Other initiatives such as the ‘Conditional Cash Transfer’ programmes in LAC have also achieved positive results in enhancing population health. The Mexican Oportunidades (formerly Progresa), the Brazilian Bolsa Família, and the Chilean Chile Solidario have been fighting poverty by increasing the income of the poor and, in consequence, improving their diet and health (Soares et al. Citation2010; Behrman and Parker Citation2011).
In other countries, healthcare interventions have been carried out to a lesser extent. Over the past two decades, the Peruvian government has made a major effort to expand health coverage; however, inequalities remain in rural areas and among indigenous populations (Dmytraczenko and Almeida Citation2015). Policies in Honduras, Nicaragua, and El Salvador have focused only on the allocation of more finances for improving health. The reform to healthcare policy in Venezuela has been stagnating for many years due to political and social issues (Atun et al. Citation2015). Regrettably, the five nations mentioned here have moved further away from achieving universal healthcare coverage and health inequalities within those populations have instead increased.
In summary, when studying mortality convergence in LAC, the picture sketched by researchers is less than clear-cut for two main reasons. First, theories such as the epidemiological transition have been conceived in the developed world and then extrapolated to less developed countries. Thus, they might not successfully explain changes in health and mortality pathways in the developing world. Second, there is an apparent inconsistency between findings of previous research. On the one hand, scholars argue that the world is converging to a single demographic regime. On the other hand, recent studies have shown mixed results regarding the narrowing of the gap between mortality regimes.
Convergence: Amenable mortality and variability in the age at death
Amenable mortality refers to those deaths—from specific causes—that should not occur in the presence of timely and effective healthcare (Nolte and McKee Citation2004; Beltrán-Sánchez Citation2011). Mortality from amenable conditions has declined in most developed countries, but still represents a large share of their total mortality (Nolte and McKee Citation2008). Likewise, the diseases that are known to have a large effect on LAC mortality trends are considered amenable to healthcare. In this research we analyse the dynamics of amenable diseases to establish a link between changes in healthcare systems and mortality trends prevailing in the region. Further, this analysis allows us to identify how mortality convergence may result from improvements in healthcare.
The epidemiological transition theory (Omran Citation1971) implies changes in age-at-death distributions from the changing cause-of-death profiles associated with historical mortality declines. Robine (Citation2001) redefined the phases of the epidemiological transition according to changes in lifespan variability. This assessment could not be undertaken by examining just the levels of mortality. His study highlighted the need to analyse lifespan variability in addition to mean lifespan. Likewise, van Raalte et al. (Citation2018) argued that lifespan variability represents a useful summary of mortality regimes, since it depicts both uncertainty in the timing of death at the individual level and the underlying heterogeneity of health at the population level. Thus, diverging lifespan variability between populations means that an overlooked dimension of inequality in health is increasing. We test the universality of this theory by looking at both average length of life and lifespan variability in LAC countries, juxtaposed with a low-mortality benchmark from a set of developed countries.
This investigation addresses the following research question: to what extent are the mortality levels of LAC countries converging towards the levels encountered in developed countries? Specifically, given the major healthcare interventions in most LAC countries over recent decades, we put forward the hypothesis that reductions in diseases amenable to healthcare have contributed to reducing lifespan variability and helped LAC countries to converge towards a ‘developed world’ mortality profile, albeit with large heterogeneity between countries. We expect that healthcare improvements in LAC will have encouraged reductions in the dispersion and high prevalence of amenable diseases. Conversely, we put forward a second hypothesis, that the recent increases in homicide mortality in some of these countries have enlarged the gap between LAC and a developed world mortality regime (indicated by an increase in external mortality). Finally, we scrutinize and quantify to what extent mortality trajectories in LAC countries have converged towards a developed world mortality schedule.
Data and methods
To measure the existing gap in life expectancy and lifespan variability between LAC and the developed world, it is necessary to set a reference point (benchmark) that depicts the mortality trajectories of the most developed nations. The United Nations’ (UN) Human Development Index (HDI) measures the degree of development achieved by societies all over the world (United Nations Citation2016b). The countries are classified according to three dimensions: education, economy, and lifespan; hence, countries that are ranked at the top of this index exhibit the highest levels of human development. The HDI has been released every year since 1990. We include in our benchmark the countries that are ranked above the 95th percentile of the HDI every year since its creation; this ensures that these nations are the front runners in terms of human development. Our developed world benchmark consists of Australia, Canada, Denmark, Germany, Japan, Norway, the Netherlands, Sweden, Switzerland, and the United States (US). Death counts by cause of death and population exposures for these countries are used to compute death rates and multiple-decrement life tables.
We performed a sensitivity analysis by constructing an alternative version of the developed world benchmark. From the original benchmark countries, we selected those that have also displayed the highest life expectancies in the world since 1990. Therefore, the alternative benchmark included just five countries: Australia, Canada, Japan, Sweden, and Switzerland. This benchmark exhibited higher life expectancies and slightly lower standard deviations than the original; however, both trajectories were very much alike over time. The alternative benchmark returned similar results to those presented here, so we opted for the simplest benchmark, without the life expectancy restriction.
To assess lifespan variability, we use the standard deviation of age at death. This is defined as the square root of the lifespan variance and indicates how spread out the ages at death of a population are (Tuljapurkar Citation2001). This measure is closely linked to the age slope of mortality; consequently, differences in this measure are equivalent to discrepancies in the age slope of mortality schedules (Tuljapurkar and Edwards Citation2011). Standard deviations are computed from life table age-at-death distributions. In addition, we can compare life expectancy with standard deviation outcomes since both are expressed in years. Although most dispersion indicators are sensitive to the age range studied, we decided to focus on the full age span so as not to overlook possible major improvements in mortality at very young ages that are more susceptible to public health interventions in LAC countries (Black et al. Citation2003; Elo et al. Citation2014).
We decompose the differences in life expectancies and standard deviations between LAC countries and the benchmark for three five-year periods of observation: 2000–04, 2005–09, and 2010–14. The decomposition of the gap in life expectancies by causes of death is carried out using the method introduced by Arriaga (Citation1984). Differences in standard deviations are disentangled by extending the decomposition method developed by Nau and Firebaugh (Citation2012). This method allows us to investigate the age pattern and cause-of-death structure, and to collapse such information into four components: ‘spread’, ‘timing’, ‘allocation’, and ‘joint’ effects.
Causes of death are grouped into three categories as follows: (1) ‘amenable diseases’, that is, causes amenable to healthcare (diseases stated in the classification introduced by Nolte and McKee (Citation2008) plus cirrhosis and lung cancer); (2) ‘external causes’ (homicide, suicide, and accidents); and (3) all ‘other causes’ of death. We include cirrhosis and lung cancer in the amenable diseases category because both are receptive to medical treatments, public health interventions (e.g., prevention via taxation of alcohol and cigarettes), and health behaviours. Examples of amenable diseases included in the classification used in this study are intestinal infections, malignant neoplasms (of colon, rectum, skin, breast, cervix, and testis), diabetes mellitus, heart diseases (hypertensive, ischaemic, and cerebrovascular), and all respiratory diseases. The complete catalogue of diseases included in this research and their corresponding International Classification of Diseases (ICD-10) codes are shown in Table A1 in the supplementary material. We analyse external causes separately because they are major causes of death in LAC countries (Briceno-Leon et al. Citation2008; Naghavi et al. Citation2015).
Identifying the underlying cause of death is problematic at older ages due to the presence of multiple co-morbidities (Rosenberg Citation1999). Many studies have looked at amenable mortality only at ages below 75, arguing that medical care and policy interventions are likely to be most effective in saving lives at younger ages (Elo et al. Citation2014). However, we consider the complete age span when decomposing differences in standard deviation by spread, allocation, timing, and joint effects. We decided not to truncate the age-at-death distributions at any age for two reasons. First, truncating would heavily affect the right-hand tail of the age-at-death distribution of our benchmark, since most deaths in developed nations are currently concentrated in old age and are shifting towards even older ages (Canudas-Romo Citation2008; Bergeron-Boucher et al. Citation2015). Second, LAC countries and the benchmark have different cause-specific age-at-death profiles; thus, truncating at an arbitrary age could return misleading comparisons. The benchmark represents a mortality profile that has been achieved elsewhere, so it is based on observed and attainable mortality levels. This means that our benchmark is a minimal representation of the amenable mortality level that LAC countries could hypothetically attain (Aburto et al. Citation2018). We performed a sensitivity analysis to consider the age dimension of the concept of amenable mortality. In that analysis, amenable deaths at ages above 75 were categorized as other causes of death and differences in standard deviations were decomposed by the contribution each cause of death makes to each age group. We found that amenable diseases are the largest contributors to the lifespan variability gap in infant and child mortality (ages 0–5), while the excess of deaths due to homicide, suicide, and accidents explains a large share of the gap for young adult males (for this sensitivity analysis we used the Horiuchi et al. (Citation2008) decomposition method; see Figure A1 in the supplementary material for further details).
Data
Multiple-decrement life tables are computed for all LAC countries and for the benchmark over the period 2000–14. We consider solely LAC countries with a population size of at least 3 million. Puerto Rico is not included in the study, as it is an unincorporated territory of the US. We also exclude from the cause-of-death analysis those countries with poor data quality, such as Bolivia, Haiti, and Honduras (WHO Citation2018). We use data by five-year period and sex, aggregated into five-year age groups with an open interval for ages 85 and above. Our cause-of-death data come from the World Health Organization (WHO Citation2017). For comparability between countries, only data coded under ICD-10 are used; however, data coded under this ICD version are not available for all countries over the same period of time. Table A5 displays the specific time period available for every country in this analysis.
In addition to the data constraints relating to time periods, the LAC region still suffers from problems with completeness of information. For death registration, the United Nations (Citation2016a) reported that coverage in most LAC countries is at least 90 per cent. Adult mortality estimates for LAC countries are derived from data on registered deaths by age and sex (United Nations Citation2017). No model life tables are used in the construction of mortality estimates in any of the LAC countries we analyse, but life tables for Bolivia and Haiti are derived solely from survey data. We use death rates from the UN's World Population Prospects (United Nations Citation2017) to mitigate issues with the completeness of information (see Table A6 in the supplementary material for a complete description of the data sources). Further, we apply the cause-of-death distribution retrieved from the WHO database to these death rates and compute multiple-decrement life tables following standard demographic techniques (Preston et al. Citation2000). We also performed robustness checks with recently published data from the Global Health Estimates (WHO Citation2018) for all the LAC countries analysed in this study, correcting for incompleteness. We did not find major deviations from our results (see Figures A2 and A3 in the supplementary material).
In order to make use of the highest-quality data available, our death rates for the benchmark countries come from the Human Mortality Database (HMD) (Citation2017). Both sources (UN and HMD) ensure the quality of their data by making consistency and completeness checks alongside those of national statistical institutes. Additionally, we performed robustness checks against the Latin American Mortality Database (Palloni et al. Citation2014).
We can point out two limitations to this research. First, co-morbidities among older people do not allow us to disentangle the effect of amenable diseases at old ages. Extra sensitivity analysis was performed, both including and excluding the last open age group, and the bias created from this is acknowledged in this paper. Second, misreporting and misclassification of causes of death affect the data quality for LAC countries. We try to overcome this limitation by focusing only on the chapters (broad groupings) of ICD-10 codes and considering just three broad groups of causes of death, assuming that the missing (unregistered) deaths will be proportionally distributed among those correctly recorded.
Decomposition of the differences between standard deviations
Let N denote the total number of life table deaths in a population and Nc represent the number of deaths attributed to cause c, with c = 1, 2, … , C mutually exclusive causes of death, such that . The age at death of individual i who died from cause c is denoted by Xc,
i, such that i = 1, 2, … , Nc. The mean age at death of the population is therefore given by
, and
stands for the mean age of those deaths from cause c. Thus, the lifespan variance (
) of the population is defined as:
(1)
(1) and the cause-specific variance is:
(2)
(2)
Nau and Firebaugh (Citation2012) introduced a method that decomposes differences between lifespan variances. This method is based on analysis of variance (ANOVA) models that account for the sources of variability. In this research, we extend this decomposition method by using the standard deviation of the age at death, defined as the square root of the lifespan variance ().
Let l be a LAC country with lifespan variance and standard deviation
. Similarly, the benchmark that portrays the trajectories of the selected developed countries is represented by b. The difference between standard deviations is expressed as:
(3)
(3)
Thus, the difference in standard deviations is reduced to an already known result for the difference in variances multiplied by a constant as , where
.
According to Nau and Firebaugh (Citation2012), lifespan variances can be expressed as:(4)
(4) where
is the proportion of deaths of cause c among all deaths, such that
and
.
By combining the results derived in equations (3) and (4), the difference between two standard deviations is denoted as:(5)
(5) where these four effects are defined as:
Spread effects account for discrepancies in standard deviations due to cause-specific variability. Allocation effects capture differences in the number of deaths attributed to each cause of death. Timing effects stand for standard deviation inequalities due to different cause-specific mean ages at death. Finally, joint effects account for differences in standard deviations explained by the simultaneous interaction between the three previous terms. Positive values of any of these effects contribute to increasing the gap in lifespan variability between LAC and the benchmark, while negative values contribute to decreasing the gap. More details on this derivation can be found in the supplementary material (see Section A1).
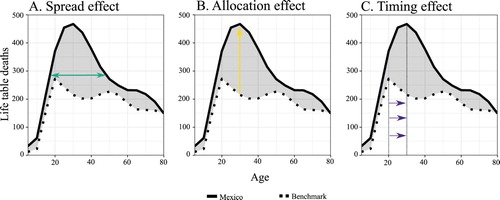
In most populations, spread, allocation, and timing effects occur at the same time. illustrates such effects by comparing (life table) deaths attributed to external causes for males in Mexico with those in the benchmark for the period 2010–14. Panel A shows that external causes prevail in slightly broader age intervals in Mexico than in the benchmark. These discrepancies are considered in the spread effect, which is 0.13 years in this case (Tables A3 and A4 show all the values of the decomposition). The distribution of deaths from external causes is more peaked in Mexico than in the benchmark, as displayed in panel B, which portrays the allocation effect (0.82 years). External-causes-specific mean age at death in the benchmark is around age 20 whereas for Mexico it is age 30. The difference between means is captured by the timing effect in panel C (−0.28 years).
Figure 1 Distribution of deaths attributed to external causes in Mexico vs. the benchmark, showing decomposition effects: males, 2010–14
Notes: Solid and dotted lines represent the number of life table deaths attributed to external causes of death in Mexico and the developed world benchmark, respectively, for the period 2010–14. The shaded grey area depicts the discrepancies between the two mortality schedules by age. Each panel illustrates a different decomposition effect, as shown by the arrows. Source: Authors’ calculations using data from UN World Population Prospects, WHO Mortality Database, and Human Mortality Database.
Results
and show the average and latest values for life expectancy and lifespan variability for all 20 LAC countries, for females and males, respectively. Note that the years considered in these calculations differ from country to country, since data are not available for the same time periods for all countries (see Table A5 for further details). Lifespan variability, as measured by the standard deviation, is generally low in countries with high life expectancies. Chile, Costa Rica, Cuba, and Uruguay, for example, exhibit the highest life expectancies and lowest lifespan variabilities of the region. Females and males in Mexico and Panama exhibit relatively high life expectancies in comparison with other countries in the region, but at the same time, they show higher lifespan variabilities than other countries with similar life expectancies. Conversely, the standard deviations for Argentina and Costa Rica are very much alike, but their average life expectancies for males differ by five years. Figures A4 and A5 in the supplementary material show individual trends in life expectancy and lifespan variability, respectively, for all LAC countries. We also calculated the coefficient of variation (CV) of such trends for each period (shown below Figures A4 and A5) and found that it declines for both measures. This indicates that people in the LAC region are living longer and, at the same time, the uncertainty regarding their age at death is decreasing over time.
Table 1 Life expectancies and standard deviations for Latin America and the Caribbean, and comparisons with a developed world benchmark: females, various years
Table 2 Life expectancies and standard deviations for Latin America and the Caribbean, and comparisons with a developed world benchmark: males, various years
To measure the contributions of amenable diseases and external mortality we decompose differences in life expectancies between LAC countries and the benchmark by cause of death (see and ). Amenable mortality contributes more to the life expectancy gap among women than among men. The average contribution of amenable diseases is 3.79 years for females and 2.90 years for males (equivalent to 58 and 41 per cent of the gap for females and males, respectively). For both sexes, Colombia, Dominican Republic, Guatemala, Mexico, Nicaragua, Paraguay, Peru, and Venezuela exhibit the largest contributions of amenable diseases. Conversely, the proportion of the life expectancy gap attributable to external causes is much higher among males than females (approximately 17 per cent for males and 1 per cent for females). The highest contributions of external mortality to the life expectancy gap in females are seen in Brazil, Colombia, Dominican Republic, Ecuador, El Salvador, and Paraguay. By contrast, external mortality contributions to this gap are almost null in the remaining countries. For males, the average contribution of external mortality to the life expectancy gap is 0.8 years. Brazil, Colombia, Dominican Republic, Ecuador, El Salvador, Guatemala, Panama, Paraguay, and Venezuela display high contributions of external causes to the life expectancy gap for males, whereas Argentina, Cuba, and Peru display the lowest. In Figures A6 and A7 in the supplementary material, we show individual country trajectories in the gap between LAC countries and the benchmark (in life expectancy and lifespan variability, respectively). We also calculated the CV of the gap for each measure and time period, and observed that for both measures the CV decreases, implying that the gap is reducing over time.
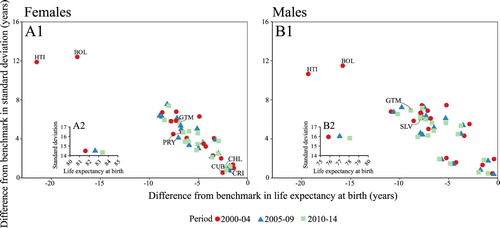
shows a scatter plot of the differences in life expectancy and lifespan variability between every LAC country and the benchmark for females (panel A1) and males (panel B1) during the three time periods. The inset panels A2 and B2 show the observed life expectancy and lifespan variability levels of the benchmark. Within the whole LAC region, life expectancy differences range from less than one year to more than 20 years, while the standard deviation differences go from half a year to over twelve years. Results show a strong correlation between differences in average length of life and differences in lifespan variability. That is, as life expectancy increases, lifespan variability decreases towards the benchmark level. During the period of study, the benchmark shows increasing life expectancy with a constant standard deviation. For females (, panel A2), life expectancy in the benchmark went up by almost two years (from 81.61 in 2000–04 to 83.39 in 2010–14) while lifespan variability remained at around 14.4 years. Similarly, life expectancy for males (, panel B2) increased from 75.85 to 78.01 years, while the standard deviation took values around 15.9 years. This is consistent with mortality in developed countries shifting towards older ages over time. However, substantial disparities between countries exist. Some populations exhibit large differences from the benchmark (e.g., Haiti and Bolivia, although data are available only for the 2000–04 period; see Table A5 in the supplementary material), while others show values similar to the benchmark (e.g., Cuba). For instance, differences from the benchmark in life expectancy for females in Chile, Costa Rica, and Cuba are around two years, while the difference in standard deviation is around one year among these regional longevity leaders. For males in those three LAC countries (, panel B1), the respective values for life expectancy differences are between one and two years, and go as low as half a year for the standard deviation gap. The largest differences for females are found in Paraguay, whereas for males values most distant from the benchmark are found in Guatemala and El Salvador.
Figure 2 Scatterplot of life expectancy and standard deviation differences between Latin American and Caribbean countries and the benchmark, plus benchmark trajectories: (A) females and (B) males, 2000–04, 2005–09, and 2010–14
Notes: The main panels display the differences from the developed world benchmark for females (A1) and males (B1) in LAC countries. Inset panels A2 and B2 show the trajectories of the developed world benchmark for females and males, respectively. Data for Bolivia and Haiti are only available for the period 2000–04. Source: As for .
and show the decomposition results for the differences in standard deviations for the three periods for females and males, respectively. We show results for ten selected countries representing different trajectories in LAC (see Tables A3 and A4 for detailed information for all 20 countries). Each bar component is related to a decomposition effect (spread, allocation, timing, and joint). Negative values indicate that the effect reduces the gap between a LAC country and the benchmark, while positive values show that the effect increases the gap.
Figure 3 Decomposition of standard deviation differences for selected Latin American and Caribbean countries: females, 2000–04, 2005–09, and 2010–14
Notes: Total differences in standard deviation between the benchmark and LAC countries for females can be found in . Source: As for .
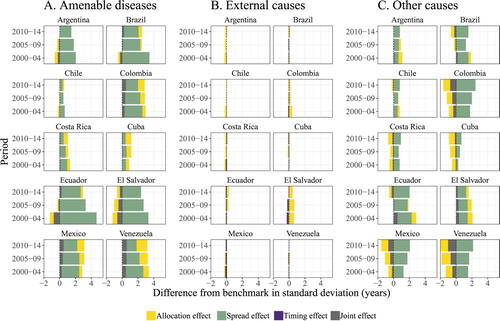
Figure 4 Decomposition of standard deviation differences for selected Latin American and Caribbean countries: males, 2000–04, 2005–09, and 2010–14
Notes: Total differences in standard deviation between the benchmark and LAC countries for males can be found in . Source: As for .
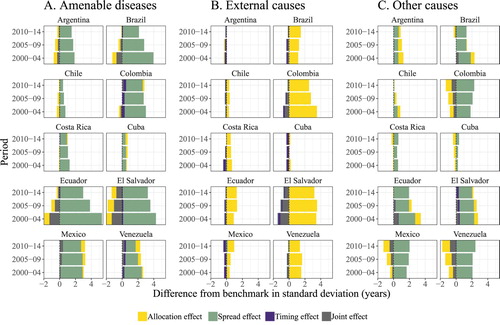
Amenable diseases increase lifespan variability relative to the benchmark (panel A of and ). This is mainly driven by spread effects, which account for 60 per cent of the gap, meaning that amenable diseases are more age dispersed in LAC countries than in the benchmark. For both sexes the absolute impact of amenable diseases is similar. In Argentina, Chile, Brazil, Colombia, Costa Rica, Ecuador, El Salvador, and Venezuela, spread effects have been reducing over time, whereas allocation components have increased. This implies that in LAC, the number of deaths attributed to amenable diseases has gradually gone up and, at the same time, been compressed into narrower age intervals. These diseases are the largest contributors to the lifespan variability gap in infant and child mortality (ages 0–5; see Figure A1 in the supplementary material). Decreases in the lifespan variability gap attributable to amenable diseases are more pronounced in Brazil and Ecuador than in the rest of the LAC populations, where differences between standard deviations remain at similar levels over time.
Amenable diseases and external causes of death act differently in their contributions to the lifespan variability gap. While for females the contribution of external mortality is low, among males it accounts for a large share of the gap with the benchmark. In addition, the large spread effects for amenable diseases contrast with the large allocation components observed for external causes. The latter could be explained by the fact that most external mortality is concentrated at mid-life ages. The effect is concentrated in males from Brazil, Colombia, Ecuador, El Salvador, Mexico, and Venezuela. External causes have a considerable impact on males from El Salvador and Colombia in particular, where allocation effects are responsible for more than two years of the lifespan variability gap. Given that all LAC countries are contrasted with the same benchmark, it is possible to compare their decomposition outcomes. For instance, life expectancies for males in Ecuador and Argentina are very similar over time; however, Ecuador exhibits standard deviations on average 4.4 years higher than Argentina (). This implies that their mortality regimes are also very different. By decomposing the lifespan variability gap, we find that although Ecuador has seen reduced spread effects of amenable diseases over time, these diseases are still more age dispersed than in Argentina. Furthermore, Ecuador is strongly affected by external causes of death, while Argentina is not. In Ecuador, allocation components of external causes are responsible for 1.5 years of the lifespan variability gap for males.
In some countries the ‘other causes’ category can help to explain the gap between LAC and the developed world, as well as the high heterogeneity among LAC populations. Causes in this other category include neurological disorders, unintentional injuries, mental disorders, and HIV. For instance, according to the latest Global Burden of Disease study (GBD 2017 Mortality Collaborators Citation2017), neurological disorders such as Parkinson's disease, epilepsy, multiple sclerosis, Alzheimer's disease, and other dementias represented the third main cause of death in Chile during the period 2010–14. Conversely, such disorders represented a smaller fraction of the total number of deaths in Guatemala, ranking as only the eleventh main cause of death during the same period.
Discussion
The results derived from this research allowed us to analyse mortality convergence trajectories, comparing 20 countries from LAC with a benchmark we constructed based on a developed world mortality regime. By looking into lifespan variability, we were able to identify those countries that have continuously approached the developed world mortality profile in the twenty-first century and those that have experienced slow progress towards the benchmark, together illustrating the large disparities between LAC countries. From our extension of the decomposition method by Nau and Firebaugh (Citation2012) to include standard deviation differences, we are able to test hypotheses about convergence patterns and draw two important conclusions: (1) the dispersion of amenable diseases across the age span makes the largest contribution to the gap between LAC and the developed world; and (2) the concentration of high levels of homicide, accidents, and suicide in mid-life is the main impediment to mortality convergence for males in LAC.
Overall, people in LAC live shorter lives and experience more uncertainty regarding their age at death than those in the developed world. The gap in lifespan variability is mostly attributable to greater age dispersion of amenable diseases in LAC than in the benchmark. Previous research on lifespan variability has shown similar patterns at the subnational level. Lariscy et al. (Citation2016) also found that most of the difference in lifespan variance between Hispanics and Whites in the US is due to the large age dispersion (spread effects) of diseases. Despite the generalized mortality disadvantage of LAC, some countries, such as Argentina, Chile, Costa Rica, Cuba, and Uruguay, have experienced rapid progress over recent decades, which has led them to achieve similar life expectancies and lifespan variability to those seen in the developed world. Improvements in amenable mortality are at the heart of this progress. Most health interventions such as vaccination programmes, healthcare coverage, and primary care are targeted to reduce mortality at very young ages (WHO Citation2013). Hence, these countries are at the top levels of longevity in LAC and also exhibit the lowest levels of lifespan variability. Among developed countries, a similar pattern has been found: the countries with the highest life expectancies are usually the ones experiencing the lowest levels of variability in lifespan, partially due to progress in saving lives at younger ages (Vaupel et al. Citation2011). As a result, there is a strong negative association between life expectancy and lifespan variability (Edwards and Tuljapurkar Citation2005; Smits and Monden Citation2009), which our findings are consistent with.
In Brazil, Colombia, Ecuador, El Salvador, Mexico, and Venezuela a strong component of external mortality exists. This contributes to the overall mortality gap with the developed world. Although in some of these countries (e.g., Brazil, Colombia, and Mexico) major efforts to achieve universal healthcare coverage have been made in the last decade (WHO Citation2013), these efforts have been offset by the high levels of violence and homicide, particularly in men (Briceno-Leon et al. Citation2008). For instance, in Mexico, after six decades of continuous improvement, life expectancy stagnated in the first decade of the twenty-first century because of the burden of homicide and diabetes (Canudas-Romo et al. Citation2015). The unexpected rise in homicide began in 2005, and in the next five years life expectancy decreased in most regions of Mexico, with lifespan variability even increasing (Aburto et al. Citation2016; Aburto and Beltrán-Sánchez Citation2019). Our findings indicate that several LAC countries are experiencing similar eroding effects caused by excess homicide mortality at younger adult ages (see Figure A1 in the supplementary material), which greatly affects lifespan variability (Firebaugh et al. Citation2014; van Raalte et al. Citation2014; Aburto and van Raalte Citation2018). Firebaugh et al. (Citation2014) also found that allocation effects due to homicide make the largest contribution to the lifespan variability gap between Blacks and Whites in the US. Therefore, reducing homicide rates among the Black population in the US could lead to the lifespan variability gap diminishing substantially. This conjecture could be extrapolated to the Latin American case; we would expect reducing homicide rates in LAC countries to lead to substantial gains in life expectancy, accompanied by reductions in lifespan variability heading towards the developed world mortality profile. There is no easy way to reduce violence and homicide in Latin America, and the consequences go beyond life expectancy and lifespan variability. Recent evidence suggests that the number of expected years to live in vulnerability related to violence has increased in the Mexican population in the last decade (Canudas-Romo et al. Citation2017). Similar consequences could be experienced in other countries. Our results provide definitive evidence that external mortality is a major public health issue in the region. Moreover, homicide, accidents, and suicide are important obstacles preventing most Latin American countries from converging towards a developed world mortality regime.
From our analysis the two LAC countries most disadvantaged relative to developed world mortality are clearly Haiti and Bolivia. These nations experience the largest departures from the benchmark and have repeatedly been pointed out as the most disadvantaged countries in LAC (McMichael et al. Citation2004; Palloni and Pinto-Aguirre Citation2011). The high lifespan variability seen in these countries underscores the increasing heterogeneity in the region. From a public health perspective, our results are important because they disclose inequalities existent in these countries. These findings would have been overlooked had we focused only on life expectancy. Both rises and stagnation in lifespan variability have been found in low socio-economic groups within developed countries (van Raalte et al. Citation2014; Sasson Citation2016; Brønnum-Hansen Citation2017). In LAC, Bolivia and Haiti represent examples of this phenomenon. Wilkinson and Pickett (Citation2009) have stated that populations with more equal distributions of income have better health and fewer social problems such as violence, drug abuse, mental illness, and obesity, and are also more cohesive than ones in which the gap between the rich and poor is greater. Therefore, we speculate that taking on the challenging task of reducing inequalities within Bolivia and Haiti, and enhancing their healthcare systems, would help them to catch up with other countries in the region. The data limitations of these nations prevented us from disentangling the convergence/divergence trajectories to/from the benchmark, which highlights the great need to collect high-quality information for future evidence-based policy development.
Inequality, development, and the public health agenda
Latin America is the most unequal region of the world (Lustig et al. Citation2013). However, trends in income inequality seem to be gradually changing for the region as a whole (Lustig et al. Citation2013; Gonzaga et al. Citation2018). From 1990 onwards, and especially during the period 2000–14, health in LAC improved more quickly than income (de Andrade et al. Citation2015). Despite these advancements, important health inequalities persist. LAC is facing growing challenges related to the predominance of non-communicable diseases and the resurgence of some communicable diseases (Borges Citation2017). External causes of death, driven by violent deaths and road traffic accidents, also play an important role in the complex and unequal epidemiological profile of LAC (de Andrade et al. Citation2015).
The overall level of human development in LAC has improved between 1980 and 2010 (United Nations Citation2016b) but, according to the most recent Human Development report (United Nations Citation2016b), LAC countries display high diversity in human development. Argentina and Chile are the only nations in the region exhibiting very high levels of development. In contrast, Bolivia, El Salvador, Guatemala, Honduras, Nicaragua, and Paraguay show moderate human development, while Haiti displays the lowest level in the region (United Nations Citation2016b). Economic, health, and human development inequalities are mirrored in mortality outcomes. Our results on lifespan variability reveal mortality inequalities within and between LAC countries but also in comparison with the developed world. Development seems to be the obvious and simplified solution to reducing inequalities and achieving mortality convergence. However, as Gersh et al. (Citation2010) have pointed out, achieving these outcomes in countries with limited resources and several public health issues is difficult.
Governments of LAC countries have advanced many different approaches to healthcare system reforms, such as controlling communicable diseases (Cuba), improving outcomes in early childhood (Chile Crece Contigo in Chile and De Cero a Siempre in Colombia), or alleviating poverty through conditional cash transfers (Bolsa Família in Brazil). These programmes have proved to be successful at improving the health of Latin Americans (Atun et al. Citation2015). Some of these health reforms have also been successful in terms of mortality. For instance, the expansion of Brazil's primary healthcare programme (Estratégia de Saúde de Família) triggered reductions in amenable mortality between racial groups (Hone et al. Citation2017). LAC governments have also made strong commitments to achieving universal healthcare coverage. According to Wagstaff et al. (Citation2015), LAC countries may not yet have reached universal healthcare coverage, but are making great strides towards it, with Brazil, Colombia, and Mexico at the highest levels of coverage, and Ecuador and Guatemala the lowest (Wagstaff et al. Citation2015). Most universal healthcare programmes in LAC are in the early stages and it would be premature to assess the full impact these policies are having on mortality trends.
The results of our decomposition analysis reveal the role that both amenable diseases and external mortality have played in the substantial heterogeneity in mortality within LAC. This new evidence encourages the debate about the priorities of the public health agenda in LAC, since most countries seem to be immersed in a paradox. On the one hand, many resources have been allocated to policies aiming for universal healthcare coverage (Frenk et al. Citation2006; Knaul et al. Citation2012; Dmytraczenko and Almeida Citation2015) and to programmes focused on the improvement of the general well-being of LAC populations (Frenk et al. Citation2006; Soares et al. Citation2010; Behrman and Parker Citation2011; Atun et al. Citation2015); on the other hand, the violent and crime-related deaths prevailing in the region are shortening the life expectancy of Latin Americans (Jaitman Citation2017). Keeping the former sustainable and eliminating the latter will be indispensable for the improvement of health and well-being of LAC populations. Thus, local governments, NGOs, and other involved institutions need to allocate resources to both these aims in order to reduce inequality.
The nuanced convergence
Frenk et al. (Citation1996) categorized LAC countries depending on their ratios of communicable to non-communicable diseases, as these directly impact the mortality convergence of such countries. In recent years, new communicable diseases (e.g., Zika and HIV/AIDS) have appeared, infectious and parasitic diseases such as cholera and dengue have resurged, and others including malaria, leprosy, and leishmaniasis have intensified (Borges Citation2017). These issues represent constraints to the transition phases of most LAC countries. A clear example is Brazil, where recent analysis has proved that this country has not followed any epidemiological transition model experienced by developed countries (Borges Citation2017). In this sense, our findings echo previous research (Caselli et al. Citation2002; Vallin and Mesle Citation2004), since the epidemiological transition model (Omran Citation1971) fails to explain the mortality and health changes in LAC. The dispersion of amenable diseases across the whole age span and the high prevalence of external causes in middle age make it difficult to place LAC at any particular stage of the epidemiological transition (Omran Citation1971). Thus, the double burden of amenable and external mortality in LAC can be better explained under a new health transition model (Frenk et al. Citation1991), since both types of mortality are receptive to public health interventions (Black et al. Citation2003; Elo et al. Citation2014).
From a global perspective, our results reveal that most LAC countries are converging towards the mortality regimes of the developed world. For the first 15 years of the twenty-first century, LAC has been approaching the ‘main sequence’ of demographic transition as defined by Wilson (Citation2011). However, the large heterogeneity between LAC countries and the prevailing inequalities at subnational level suggests various nuances in the convergence. Following the idea put forward by Mayer-Foulkes (Citation2001) and Bloom and Canning (Citation2007), we can distinguish four main convergence clusters within LAC: (1) the front runners (Argentina, Chile, Costa Rica, Cuba, and Uruguay); (2) those nations mainly affected by amenable diseases, with a low component of external mortality (Dominican Republic, Guatemala, Nicaragua, Panama, Paraguay, Peru, and Uruguay); (3) the LAC countries strongly affected by both external mortality and amenable diseases (Brazil, Colombia, Ecuador, El Salvador, Mexico, and Venezuela); and finally (4) those nations lagging behind (Bolivia and Haiti). Clusters (2) and (3) include most LAC populations and, until now, these countries have displayed moderate convergence attributable to reductions in lifespan variability and gains in life expectancy. Nonetheless, the burden of mortality in these countries represents an impediment to achieving further convergence, since these issues are either non-existent or have little impact on mortality in developed nations.
Supplemental Material
Download PDF (364.5 KB)ORCID
Jesús-Adrián Alvarez http://orcid.org/0000-0002-3724-6149
José Manuel Aburto http://orcid.org/0000-0002-2926-6879
Vladimir Canudas-Romo http://orcid.org/0000-0001-6532-0089
Notes
1 Jesús-Adrián Alvarez and José Manuel Aburto are both based at the Interdisciplinary Centre on Population Dynamics, University of Southern Denmark; José Manuel Aburto is also based at the Max Planck Institute for Demographic Research in Rostock, Germany. Vladimir Canudas-Romo is based at the School of Demography, Australian National University. Please direct all correspondence to Jesús-Adrián Alvarez and José Manuel Aburto at the Interdisciplinary Centre on Population Dynamics, University of Southern Denmark, J. B. Winslows Vej 9, DK-5000 Odense, Denmark; or by E-mail: [email protected] and [email protected]
2 The authors thank Alyson van Raalte for helpful comments on an earlier version of the manuscript and three anonymous reviewers for providing valuable comments and discussions on this paper. Jesús-Adrián Alvarez thanks Jim Vaupel for providing insightful suggestions and encouragement to do this research, Elisabetta Barbi for useful discussions on early versions of this paper, the European Doctoral School of Demography, and Sapienza University.
3 Funding: all authors acknowledge support from their home institutions. Open access funding was provided by the Max Planck Society. José Manuel Aburto acknowledges support from the European Research Council Grant No. 716323.
References
- Aburto, J. M. and H. Beltrán-Sánchez. 2019. Upsurge of homicides and its impact on life expectancy and life span inequality in Mexico, 2005–2015, American Journal of Public Health 2019: e1–e7.
- Aburto, J. M. and A. van Raalte. 2018. Lifespan dispersion in times of life expectancy fluctuation: The case of Central and Eastern Europe, Demography 55(6): 2071–2096.
- Aburto, J. M., T. Riffe, and V. Canudas-Romo. 2018. Trends in avoidable mortality over the life course in Mexico, 1990–2015: A cross-sectional demographic analysis, BMJ Open 8: e022350.
- Aburto, J. M., H. Beltrán-Sánchez, V. M. García-Guerrero, and V. Canudas-Romo. 2016. Homicides in Mexico reversed life expectancy gains for men and slowed them for women, 2000–10, Health Affairs 35(1): 88–95.
- Arriaga, E. E. 1984. Measuring and explaining the change in life expectancies, Demography 21(1): 83–96.
- Atun, R., L. O. M. De Andrade, G. Almeida, D. Cotlear, T. Dmytraczenko, P. Frenz, P. Garcia, O. Gomez-Dantes, F. M. Knaul, C. Muntaner, J. B. De Paula, F. Rigoli, P. C. F. Serrate, and A. Wagstaff. 2015. Health-system reform and universal health coverage in Latin America, The Lancet, 385(9974): 1230–1247.
- Behrman, J. R. and S. W. Parker. 2011. The Impact of the PROGRESA/Oportunidades Conditional Cash Transfer Program on Health and Related Outcomes for the Aging in Mexico. PARC Working Paper Series, WPS 11-02.
- Beltrán-Sánchez, H. 2011. Avoidable mortality, in International Handbook of Adult Mortality. Dordrecht: Springer, 491–508.
- Bergeron-Boucher, M. P., M. Ebeling, and V. Canudas-Romo. 2015. Decomposing changes in life expectancy: Compression versus shifting mortality, Demographic Research 33: 391–424.
- Black, R. E., S. S. Morris, and J. Bryce. 2003. Where and why are 10 million children dying every year?, The Lancet 361(9376): 2226–2234.
- Bloom, D. E. and D. Canning. 2007. Mortality traps and the dynamics of health transitions, Proceedings of the National Academy of Sciences 104(41): 16044–16049.
- Borges, G. M. 2017. Health transition in Brazil: Regional variations and divergence/convergence in mortality, Cadernos de Saude Publica 33(8): 1–15.
- Briceno-Leon, R., A. Villaveces, and A. Concha-Eastman. 2008. Understanding the uneven distribution of the incidence of homicide in Latin America, International Journal of Epidemiology 37(4): 751–757.
- Brønnum-Hansen, H. 2017. Socially disparate trends in lifespan variation: A trend study on income and mortality based on nationwide Danish register data, BMJ Open 7(5): e014489.
- Canudas-Romo, V. 2008. The modal age at death and the shifting mortality hypothesis, Demographic Research 19: 1179–1204.
- Canudas-Romo, V., V. M. García-Guerrero, and C. J. Echarri-Canovas. 2015. The stagnation of the Mexican male life expectancy in the first decade of the 21st century: The impact of homicides and diabetes mellitus, Journal of Epidemiology and Community Health 69(1): 28–34.
- Canudas-Romo, V., J. M. Aburto, V. M. García-Guerrero, and H. Beltrán-Sánchez. 2017. Mexico’s epidemic of violence and its public health significance on average length of life, Journal of Epidemiology and Community Health 71(2): 188–193.
- Caselli, G., F. Mesle, and J. Vallin. 2002. Epidemiologic transition theory exceptions, Genus LVIII(1): 9–52.
- Clark, R. 2011. World health inequality: Convergence, divergence, and development, Social Science & Medicine 72(4): 617–624.
- De Andrade, L. O. M., A. P. Filho, O. Solar, F. Rígoli, L. M. de Salazar, P. C. Serrate, K. G. Ribeiro, T. S. Koller, F. N. B. Cruz, and R. Atun. 2015. Social determinants of health, universal health coverage, and sustainable development: Case studies from Latin American countries, The Lancet 385(9975): 1343–1351.
- GBD 2017 Mortality Collaborators. 2017. Global, regional, and national age-sex-specific mortality and life expectancy, 1950–2017: A systematic analysis for the global burden of disease study 2017, The Lancet 392(10159): 1684–1735. Available: https://www.thelancet.com/journals/lancet/article/PIIS0140-6736(18)31891-9/fulltext.
- Dmytraczenko, T. and G. Almeida. 2015. Toward Universal Health Coverage and Equity in Latin America and the Caribbean: Evidence from Selected Countries. New York: OPS.
- Edwards, R. D. and S. Tuljapurkar. 2005. Inequality in life spans and a new perspective on mortality convergence across industrialized countries, Population and Development Review 31(4): 645–674.
- Elo, I. T., H. Beltrán-Sánchez, and J. Macinko. 2014. The contribution of health care and other interventions to Black-White disparities in life expectancy, 1980–2007, Population Research and Policy Review 33(1): 97–126.
- Firebaugh, G., F. Acciai, A. J. Noah, C. Prather, and C. Nau. 2014. Why lifespans are more variable among blacks than among whites in the United States, Demography 51(6): 2025–2045.
- Frenk, J., J. L. Bobadilla, and R. Lozano. 1996. The epidemiological transition in Latin America, Adult Mortality in Latin America 123(6): 485–496.
- Frenk, J., J. L. Bobadilla, C. Stern, T. Frejka, and R. Lozano. 1991. Elements for a theory of the health transition, Health Transition Review 1(1): 21–38.
- Frenk, J., E. Gonzalez-Pier, O. Gómez-Dantes, M. A. Lezana, and F. M. Knaul. 2006. Comprehensive reform to improve health system performance in Mexico, The Lancet 368(9546): 1524–1534.
- Gersh, B. J., K. Sliwa, B. M. Mayosi, and S. Yusuf. 2010. Novel therapeutic concepts: The epidemic of cardiovascular disease in the developing world: Global implications, European Heart Journal 31(6): 642–648.
- Gonzaga, M. R., B. L. Queiroz, and E. E. C. De Lima. 2018. Compression of mortality: The evolution in the variability in the age of death in Latin America. Revista Latinoamericana de Población 12(23): 9–35.
- Hone, T., D. Rasella, M. L. Barreto, A. Majeed, and C. Millett. 2017. Association between expansion of primary healthcare and racial inequalities in mortality amenable to primary care in brazil: A national longitudinal analysis, PLoS Medicine 14(5): e1002306.
- Horiuchi, S., J. R. Wilmoth, and S. D. Pletcher. 2008. A decomposition method based on a model of continuous change, Demography 45(4): 785–801.
- Human Mortality Database. 2017. University of California, Berkeley (USA), and Max Planck Institute for Demographic Research (Germany). Available: www.mortality.org.
- Jaitman, L. 2017. The Costs of Crime and Violence: New Evidence and Insights in Latin America and the Caribbean. New York: Inter-American Development Bank.
- Klenk, J., U. Keil, A. Jaensch, M. C. Christiansen, and G. Nagel. 2016. Changes in life expectancy 1950–2010: Contributions from age- and disease-specific mortality in selected countries, Population Health Metrics 14: 20.
- Knaul, F. M., E. González-Pier, O. Gómez-Dantes, D. García-Junco, H. Arreola-Ornelas, M. Barraza-Lloréns, R. Sandoval, F. Caballero, M. Hernández-Avila, M. Juan, D. Kershenobich, G. Nigenda, E. Ruelas, J. Sepúlveda, R. Tapia, G. Soberón, S. Chertorivski, and J. Frenk. 2012. The quest for universal health coverage: Achieving social protection for all in Mexico, The Lancet 380(9849): 1259–1279.
- Lariscy, J. T., C. Nau, G. Firebaugh, and R. A. Hummer. 2016. Hispanic-White differences in lifespan variability in the United States, Demography 53(1): 215–239.
- Lustig, N., L. F. López-Calva, and E. Ortiz-Juárez. 2013. Declining inequality in Latin America in the 2000s: The cases of Argentina, Brazil, and Mexico, World Development 44: 129–141.
- Mayer-Foulkes, D. 2001. Convergence clubs in cross-country life expectancy dynamics. WIDER Discussion Papers/World Institute for Development Economics (UNU-WIDER) 2001: 134.
- McGuire, J. 2001. Social policy and mortality decline in East Asia and Latin America, World Development 29(10): 1673–1697.
- McMichael, A. J., M. McKee, V. Shkolnikov, and T. Valkonen. 2004. Mortality trends and setbacks: Global convergence or divergence?, The Lancet 363(9415): 1155–1159.
- Moser, K., V. Shkolnikov, and D. A. Leon. 2005. World mortality 1950–2000: Divergence replaces convergence from the late 1980s, Bulletin of the World Health Organization 83(3): 202–209.
- Naghavi, M., H. Wang, R. Lozano, A. Davis, X. Liang, and M. Zhou. 2015. Global, regional, and national age-sex specific all-cause and cause-specific mortality for 240 causes of death, 1990–2013: A systematic analysis for the Global Burden of Disease Study 2013. The Lancet 385(9963): 117–171.
- Nau, C. and G. Firebaugh. 2012. A new method for determining why length of life is more unequal in some populations than in others, Demography 49(4): 1207–1230.
- Nolte, E. and M. McKee. 2004. Does Healthcare Save Lives? London: The Nuffield Trust.
- Nolte, E. and M. McKee. 2008. Measuring the health of nations: Updating an earlier analysis, Health Affairs 27(1): 58–71.
- Olshansky, S. J. and A. B. Ault. 1986. The fourth stage of the epidemiologic transition: The age of delayed degenerative diseases, The Milbank Quarterly 64(3): 355–391.
- Omran, A. R. 1971. The epidemiologic transition: A theory of the epidemiology of population change, The Milbank Memorial Fund Quarterly 49(4): 509.
- Palloni, A. and G. Pinto-Aguirre. 2011. Adult mortality in Latin America and the Caribbean, in International Handbook of Adult Mortality. Dordrecht: Springer, 101–132.
- Palloni, A., G. Pinto-Aguirre, and H. Beltrán-Sánchez. 2014. Latin American mortality database (LAMdA). Available: www.ssc.wisc.edu/cdha/latinmortality.
- Preston, S., P. Heuveline, and M. Guillot. 2000. Demography: Measuring and Modeling Population Processes. Oxford: Blackwell Publishers Ltd.
- Robine, J. M. 2001. Redefining the stages of the epidemiological transition by a study of the dispersion of life spans: The case of France, Population: An English Selection 13( 1, Biodemographic Perspectives on Human Longevity): 173–193.
- Rosenberg, H. M. 1999. Cause of death as a contemporary problem, Journal of the History of Medicine and Allied Sciences 54(2): 133–153.
- Sasson, I. 2016. Trends in life expectancy and lifespan variation by educational attainment: United States, 1990–2010. Demography 53(2): 269–293.
- Smits, J. and C. Monden. 2009. Length of life inequality around the globe, Social Science & Medicine 68: 1114–1123.
- Soares, F. V., R. P. Ribas, and R. G. Osorio. 2010. Evaluating the impact of Brazil’s Bolsa Familia: Cash transfer programs in comparative perspective, Latin American Research Review 45(2): 173–190.
- Tuljapurkar, S. 2001. The final inequality: Variance of age at death, Journal of Population Research 18(2): 177–193.
- Tuljapurkar, S. and R. D. Edwards. 2011. Variance in death and its implications for modeling and forecasting mortality, Demographic Research 24: 497–526.
- United Nations. 2016a. Demographic Yearbook 2016. Technical Report, Economic and Social Affairs, New York.
- United Nations. 2016b. Human Development Report 2016: Development for Everyone. Technical report, United Nations Development Program, New York.
- United Nations. 2017. World Population Prospects: The 2017 Revision. Available: esa.un.org/unpd/wpp.
- Vallin, J. and F. Mesle. 2004. Convergences and divergences in mortality: A new approach to health transition, Demographic Research 10(2): 11–44.
- Van Raalte, A., P. Martikainen, and M. Myrskyla. 2014. Lifespan variation by occupational class: Compression or stagnation over time?, Demography 51(1): 73–95.
- Van Raalte, A., I. Sasson, and P. Martikainen. 2018. The case for monitoring life-span inequality, Science 362(6418): 1002–1004.
- Vaupel, J. W., Z. Zhang, and A. van Raalte. 2011. Life expectancy and disparity: An international comparison of life table data, BMJ open 1(1): e000128.
- Wagstaff, A., T. Dmytraczenko, G. Almeida, L. Buisman, P. Hoang-Vu Eozenou, C. Bredenkamp, J. A. Cercone, Y. Diaz, D. Maceira, S. Molina, G. Paraje, F. Ruiz, F. Sarti, J. Scott, M. Valdivia, and H. Werneck. 2015. Assessing Latin America’s progress toward achieving universal health coverage, Health Affairs 34(10): 1704–1712.
- WHO. 2010. World Health Report, 2010: Health Systems Financing the Path to Universal Coverage. World Health Organization.
- WHO. 2013. World Health Report, 2013: Research for Universal Health Coverage. World Health Organization.
- WHO. 2017. World Health Organization Mortality Database. Available: http://www.who.int/healthinfo/mortality_data/ en/.
- WHO. 2018. Global Health Estimates 2016: Deaths by Cause, Age, Sex, by Country and by Region, 2000–2016.
- Wilkinson, R. G. and K. E. Pickett. 2009. Income inequality and social dysfunction, Annual Review of Sociology 35: 493–511.
- Wilson, C. 2011. Understanding global demographic convergence since 1950, Population and Development Review 37(2): 375–388.