
Abstract
Young adults migrate more than older people. As populations in many countries get older, this may affect out-migration—and thus immigration to other countries. This is not usually accounted for in projections of future immigration, even though considerable ageing is expected globally. We show how United Nations projections of future age profiles in origin regions can be combined with those regions’ emigration rates by age group to improve national projections of immigration to a destination country, exemplified by Norway. Using various methods for projecting future migration, we show that projected immigration tends to be lower when taking expected ageing in origin regions into account. This may have a considerable effect on population projections: for Norway, taking changing age profiles in origin regions into account in immigration projections would have an effect on the projected population of Norway equivalent to that of reducing the fertility assumptions by 0.1 children per woman.
Introduction
Population projections are essential for planning in numerous areas, and thereby shape future societies. However, producing accurate population projections for nations is challenging, primarily because it is hard to foresee the future of fertility, mortality, and international migration. Of these, international migration is usually considered the most difficult component to forecast (Coleman Citation2008; Bijak Citation2011; Lee Citation2011). The difficulty of forecasting immigration is not primarily due to lack of knowledge about the determinants of international migration; a vast body of literature has already identified several important determinants, such as income differences, unemployment, legal changes, and political unrest (Massey et al. Citation1993; Karemera et al. Citation2000; Hatton and Williamson Citation2003, Citation2005; Kim and Cohen Citation2010; Mayda Citation2010; de Haas Citation2011; Ortega and Peri Citation2013; Conte and Migali Citation2019; Weber Citation2019). The major challenge in forecasting immigration is, rather, that many of these determinants are themselves hard to project accurately in the long term.
International and national statistical agencies take different approaches to projecting future immigration (Cappelen et al. Citation2015), but models for migration forecasting are few in number and relatively underdeveloped (Raymer and Wiśniowski Citation2018). Some agencies keep the immigration level constant at the current level or make forecasts based on expert judgements. Others, such as the United States (US) Census Bureau, project immigration of foreign-born people using rates of emigration from origin countries (United States Census Bureau Citation2018). Origin countries may be grouped into regions, and rates of emigration are calculated by dividing annual figures for immigration from each origin region by figures for the population in those regions. Statistics Sweden uses emigration rates from the Nordic and European Union (EU) countries in its population projections (Statistics Sweden Citation2018), and Statistics Norway bases its immigration projection model on emigration rates from different regions of the world (Cappelen et al. Citation2015).
During the twenty-first century, a marked ageing is expected to take place globally. However, as far as we know, no national or international agency uses estimates of this changing age structure throughout the world in their immigration projection models. Taking this into account is worth considering, for at least five reasons:
The propensity to emigrate is closely related to age, and age profiles of migration have proved quite regular across contexts (Rogers and Castro Citation1981; Raymer and Rogers Citation2008; Wiśniowski et al. Citation2016; Raymer and Wiśniowski Citation2018). Hence, there is reason to believe that changing age composition will affect out-migration.
Unlike for many other determinants of international migration, relatively reliable forecasts exist for future age composition in all countries up to 2100 (United Nations Citation2019a).
These forecasts suggest marked changes in age profiles throughout this century, with potentially profound implications for international migration flows.
Using different rates by age is already an integrated part of many population projections, for example for fertility or mortality and even some migration flows, such as emigration or internal migration.
Taking future age structures into account can be a relatively uncomplicated exercise, as we show in this paper.
Using migration age profiles in the pursuit of better migration forecasts has already been suggested, for instance, by Raymer and Wiśniowski (Citation2018). Within the Bayesian framework, their model forecasts age and sex patterns of immigration and emigration based on observed overall migration flows by age and sex to and from a country, exemplified by South Korea, Sweden, and Australia. We add to this literature by using rates (instead of absolute numbers), which we apply to projected populations in different origin regions, allowing us to take into account expected changes in population size and age structure in different parts of the world.
The aim of this paper is to investigate how data on expected future age profiles in origin regions can inform immigration projections. Population size by age group will, however, most probably not be the only factor determining future international migration, and thus our approach cannot replace careful considerations of how other factors—such as relative economic opportunities, migrant networks, costs of migration, political barriers, etc.—will affect immigration in the years to come.
This paper focuses on international migration. However, internal and international migrants often exhibit similar age structures, and internal migration may also be affected by changing age structures in origin areas. Internal migration accounts for more movements than international migration (Skeldon Citation2017), and as explored, for instance, by Cooke (Citation2011, Citation2013) and Champion et al. (Citation2018), observed declines in the number of internal migrants in many developed countries may be partly due to ageing, in addition to other factors, such as changes to the economy.
Another body of research has used data on changes in population stocks to produce estimates of global bilateral migration flows (Abel and Sander Citation2014; Abel Citation2018; Abel and Cohen Citation2019). Although that research has not projected future immigration or applied age-specific rates to the stocks, it has shown how internationally available population data and sound methods can be used to improve our understanding of migration flows.
In the rest of this paper, we show how the United Nations (UN) Population Division’s projections of future age profiles in origin regions can be combined with rates of emigration by age group to improve projections of immigration to a destination country, using Norway as a case study. First, we briefly present the data used in this paper. Second, we introduce some relatively straightforward ways of incorporating data from the UN on changing age structures in origin regions into projections of future immigration. We use observed rates of emigration from origin regions for different age groups to project future rates, via several standard methods for extrapolating trends. Third, we show the differences in projected immigration between estimates based on disaggregated age groups and similar estimates with no age disaggregation. Finally, we estimate the effect of these differences on the projected future population size of Norway.
Our results show that the projected future total immigration to Norway declines when introducing age disaggregation, no matter which method is used. The effect on projected total population in Norway differs depending on the method used. For most methods, however, the effect of age disaggregation on the projected population in Norway is between 300,000 and 500,000 fewer inhabitants in 2100, which is a sizeable effect for a population that in 2020 numbered 5.4 million inhabitants. The effect size is similar to that of reducing the assumptions on future total fertility by 0.1 children per women throughout the projection period.
Data and descriptives
To forecast future immigration to any country based on emigration rates from origin regions by age group, at minimum two main data inputs are needed:
Data on historical and future population in origin regions, by age group
We use the UN Population Division’s World Population Prospects (WPP) database, which is freely available at https://population.un.org/wpp/. WPP offers estimates of the population in all countries back to 1950 by five-year age group, and provides projections of population by five-year age group for all countries up to 2100. In this study, we use the medium variant from the 2019 Revision of WPP (other variants are also available, such as high and low fertility).
Data on immigration to the destination country, by origin and age group
We use Statistics Norway data on immigration to Norway, which are based on the Norwegian population register and cover all immigrants who have moved to Norway. Unlike many of the world’s migration flows, immigration to Norway is well recorded in the population register. Immigrants are defined as people who were born abroad, with foreign-born parents and grandparents, and who have immigrated to Norway with the intention to stay for at least six months, with legal permission to stay. Immigrants who left the country in the same calendar year as they arrived are removed from this sample; they constitute around 1,000 annually.
By dividing figures on annual migration from an origin region to Norway by the origin population, we obtain annual migration rates—either for the total population or for age groups. From these rates, forecasts of future rates can be made. Several methods can be used for such forecasts, such as an average over a given number of years, or different econometric methods for extrapolation of the observed trends in migration rates. The methods used in this paper are described after the presentation of the origin country groups and age groups.
The country groups
The categorization of origin country groups obviously depends on the national context and migration history. Norway has received immigrants from most countries in the world. Until the mid-1980s, immigrants mostly came from other Western countries. Immigration from non-Western countries has increased substantially since the mid-1980s, and after the EU enlargement in 2004, there was a steep increase in immigration from the new member states.
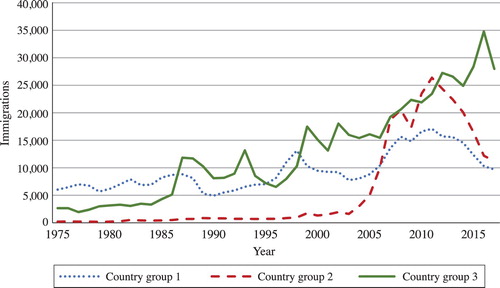
In this paper, immigrants’ origin countries are grouped into three regions, in line with the grouping used in the official Norwegian population projections: Country group 1 includes Western Europe, the US, Canada, Australia, and New Zealand; Country group 2 includes the new Eastern EU member states; and Country group 3 comprises the rest of the world. The five origin countries with most migrants to Norway, 1990–2017, by country group were: Sweden, Germany, Denmark, the United Kingdom, and the US in Country group 1; Poland, Lithuania, Romania, Latvia, and Bulgaria in Country group 2; and Somalia, the Philippines, Iraq, Syria, and Russia in Country group 3. Africa was the origin area for 23 per cent of all immigration from Country group 3.
shows immigration to Norway from these country groups since 1975. Since 2011, immigration from Country group 1 (Western countries) and Country group 2 (new Eastern EU states) has decreased markedly. This decline can mainly be explained by economic circumstances in Norway and in origin areas. Immigration from Country group 3 has not seen the same decrease, but peaked in 2016, due mainly to an influx of Syrian refugees. Immigrants from the three groups tend to be driven by different reasons for immigration (Statistics Norway Citation2019) and to some degree have had to meet different sets of legal frameworks for entering and staying in Norway (however, note that immigrants from the US, Canada, Australia, and New Zealand are not subject to the same free mobility within the European Economic Area as the rest of Country group 1). A breakdown of each country group by single countries is provided in Appendix A in the supplementary material.
Figure 1 Immigration to Norway from three origin country groups, 1975–2017
Source: Statistics Norway.
The age groups
Although immigrants from the three country groups differ, their age profiles at immigration are relatively similar, and these profiles also tend to be quite stable over time. shows the arrival age of immigrants who moved to Norway during 1990–2017, by country group.
Figure 2 Age profiles of immigrants arriving in Norway by origin country group, 1990–2017
Notes: Thick lines show averages; thin grey lines show single arrival years.Source: Statistics Norway and authors’ calculations.
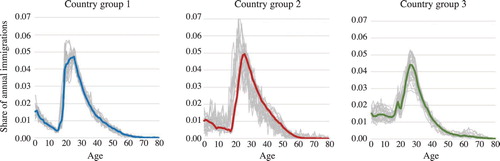
The patterns shown in are fairly similar to many other migration age profiles: the mid-20s is the most common arrival age for all three country groups. The youngest children also constitute a fair share of all immigration, with declining shares until around age 15. Thereafter we see a sharp increase, before the proportions fall again after the mid-20s. Relatively few immigrants are 40 years or older at arrival.
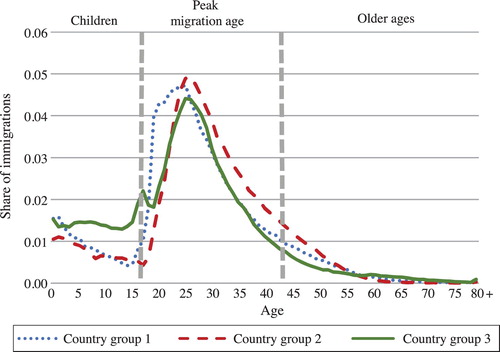
In this paper, we use three age groups as shown in : these can be roughly described as (1) children (0–14 years); (2) peak migration age (15–39 years); and (3) older ages (40 years and older). We prefer to keep the number of groups small to avoid groups with too few observations, and to allow for possible slight changes in the age profiles over time. Since the WPP data on origin populations are provided in five-year age groups, we also ensure that the age division lines are divisible by five. Our peak migration age starts at 15 in order to capture possible peaks among the oldest teenagers, such as students (Wilson Citation2010).
Figure 3 Classification of immigrants’ arrival ages in Norway and average age profiles for immigrants arriving 1990–2017, by origin country group
Source: As for .
The WPP data show that the share of the population in the peak migration ages is on the decline in most of the world. shows estimated and projected population in each origin country group (WPP medium variant) by share in each age group. While the projected share of children is constant or declining in all groups, the share of population at the more sedentary older ages is expected to increase markedly, particularly in Country group 2 (new Eastern EU member states) and Country group 3 (rest of the world).
Figure 4 Share of population in different age groups, estimated and projected by the WPP 2019 medium variant, by country group, 1975–2100
Source: World Population Projections and authors’ calculations.
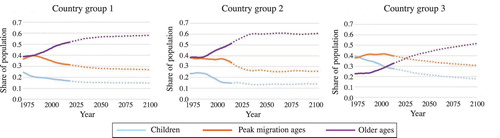
Hence, while the age profiles of migrants seem fairly stable over time, the expected share of population at different ages is expected to change markedly. The fact that most people migrate at ages that will constitute a decreasing share of the population in most origin regions, suggests that this may be an important factor to take into account when projecting future immigration. In the following, we show how this can be done.
Methods
To provide estimates of how disaggregating an immigration forecast model by age group would affect population projections, we apply a four-step procedure.
First, we calculate emigration rates based on registered data up to 2017 (from Statistics Norway on immigration to Norway, and from the UN on population in the three country groups). The rates are calculated for each year by dividing annual immigration to Norway from each country group by the mid-year population (in ‘000s) in the same country group. This is done for the total population and by age group. Figure A1 in Appendix B (in the supplementary material) shows how these rates have changed over time, by age group, and by country group.
Second, we project future emigration rates for each of the three country groups, using several methods for extrapolation. For each method we make two different extrapolations: one based on the emigration rates for the total population, and one based on separate rates for the three age groups defined earlier.
These emigration rates are, in turn, applied to UN projections of population in origin regions, for the total population and also for the population disaggregated into the three age groups. This gives us projections of future migration to Norway with and without the use of age profiles in origin regions. Hence, the aggregated version (projections using the same emigration rates for all ages) takes into account changes only in total population size in origin regions, whereas the age-disaggregated versions (using different emigration rates for the three age groups) take into account the projected changes in age structure shown in , as well as changes in total population size. The aggregated versions can also be seen as estimates of future migration to Norway in a scenario with population growth in origin regions but no changes to age composition.
Third, the differences between the two extrapolations (aggregated and disaggregated by age group) are estimated, showing how immigration projections for Norway could change if changing age profiles in origin regions were taken into account.
Finally, to illustrate the magnitude of these differences, we use the Norwegian model for official population projections to project future population in Norway with and without the differences. This gives us an impression of the long-term, cumulative effect such a model change would have on population projections, exemplified by Norway.
Projecting migration rates
Projections of future migration rates may be obtained from observed annual migration rates in many ways. In this paper we consider seven different methods. For each method, we derive future migration rates for each of the three age groups, as well as for the whole population, to compare projections from the age-disaggregated method with those from the method without disaggregation. This is done for all three country groups.
A schematic overview of the methods is shown in , whereas Appendix C in the supplementary material gives a more detailed description of each method.
Table 1 Projection methods for emigration rates used in this study
The methods can be classified into two main categories. The first category (models M1–M3) is based on the mean of emigration rates over some years before 2018. Model M1 uses the ten years 2008–17 when calculating the means, whereas M2 uses five years (2013–17). M3 uses the same period as M1, but with weighted means, where the most recent years are given most weight.
The second category (models M4–M7) forecasts the emigration rates by using econometric time-series models, that is, vector autoregressive (VAR) and autoregressive (AR) models. VAR and AR models have been used for a long time for the purpose of forecasting. Like the three methods already discussed, they are easy to implement, but these models are stochastic. Using a VAR model specified for three (log-transformed) emigration rates (by age) implies that information from the two other emigration rates is also used when one of the emigration rates is forecasted. In contrast, AR models do not use information from groups other than the one we estimate. Whereas models M6 and M7 use AR(1) and AR(2) models, respectively, for both the aggregated and disaggregated approaches, M4 and M5 use VAR(1) and VAR(2) models in the disaggregated approach and AR(1) and AR(2) models in the aggregated approach (the number in parentheses shows the length of the time lag). Hence, the models used in the aggregated approaches are similar for M4 and M6, and for M5 and M7.
The reason we consider the two models M6 and M7 is that our time series used for estimation are not very long. The annual data cover the years 1990–2017. Using AR models in the disaggregate approach involves fewer unknown parameters than the models based on a VAR specification.
Results
In , the differences between the solid and dotted lines of the same colour show the effect of estimating future immigration using age groups. For projections shown by solid lines, no age information is used, so all the changes stem from changed population size in origin regions. The dotted lines show the sum of immigration estimated separately for each of the three age groups. When the dotted line lies below the solid line of the same colour, introducing age disaggregation in the forecast reduces the projected future immigration to Norway.
Figure 5 Immigration to Norway from three origin country groups, registered 1990–2017 and projected 2018–2100 by seven different methods, aggregated and disaggregated by age
Notes: The line shadings indicate the seven different methods used. Projections using disaggregated age groups in origin regions are shown by dotted/dashed lines and those with no age disaggregation are shown by solid lines. Source: As for .
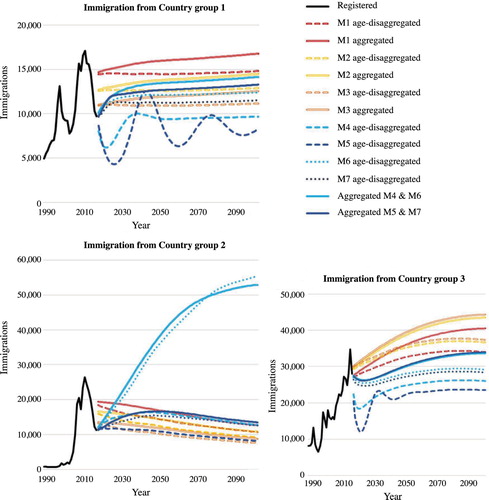
The results are almost unequivocal: for Country group 1 (Western countries) projected future immigration to Norway declines with age disaggregation, no matter which method we use. The same is the case for Country group 3 (rest of the world). For Country group 2 (new Eastern EU member states), six out of seven methods yield similar results. For the remaining method, M6, introducing age disaggregation reduces projected immigration during most of the projection period, but not in the far future. For the whole projection period taken together, however, the aggregate approach in method M6 yields higher immigration projections than the corresponding age-disaggregated method. However, we believe that the projections for Country group 2 produced by method M6 are too high in the case of both the disaggregated and aggregated models (recall that method M6 coincides with method M4 in the aggregated model). It is striking that the projections in this case deviate so substantially from those obtained by using methods M4 (in the disaggregate case), M5, or M7. This may indicate that the time-series models used in method M6 are too simple. In all the AR/VAR models, we leave out possible intervention variables in order to obtain simpler and more mechanical specifications; however, the inclusion of such variables may improve the performance of all methods based on AR/VAR models, especially the one based on the most parsimonious models. (In other research we have made use of a level shift variable to pick up the effect of the extension of EU in 2004, which gave individuals in most of the countries in Country group 2 much easier access to Norway. The level shift variable was 0 until 2003, 0.67 in 2004, and 1 from 2005 onwards. Incorporating this dummy variable, possibly alongside some other intervention variables, could have generated predictions using M6 that would have been more in line with those obtained using the other time-series models.)
Figure A2 in Appendix B (supplementary material) shows the sum of these results across country groups. More detailed figures on the differences by country groups and models are shown in Figure A3.
Since we are not primarily interested in the levels of the forecasts from each of these models, but in the effects of introducing disaggregation by age, in we show only the differences between aggregated and age-disaggregated results within each method, summarized over the three country groups. The lower the line, the more negative is the effect of introducing age disaggregation in projections of immigration.
Figure 6 Difference in annual immigration to Norway, 2018–2100, if projection method disaggregates by age (for sum of the three origin country groups)
Source: Authors’ calculations.
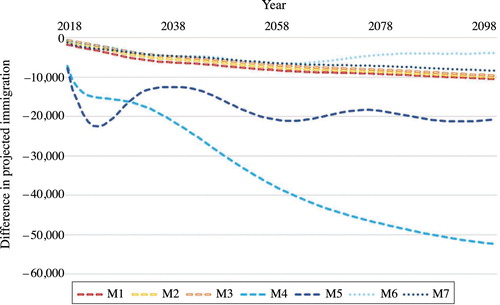
The results based on methods M4 and M5 deviate somewhat from the others in that the effects are quite large, and we judge them not to be credible. As revealed by Figure A3 in Appendix B, these results are related to Country group 2 in the case of method M4 and Country group 3 in the case of method M5. For both country groups it may be advantageous to include intervention variables in the time-series models to pick up effects of important events that have occurred during the estimation period. For most of the other methods used, annual total forecasted immigration would be lower by between 100 and 1,000 if future age profiles in origin regions were taken into account.
Effect on the projected population
One way to measure the long-term effect of introducing age disaggregation could simply be to add up the annual differences in projected immigration over the projection period. However, this does not necessarily correspond to the effect on the population size, since some immigrants emigrate from Norway, some die, and some give birth. By using the Norwegian model for (official) population projections, we calculate the effect on the projected total population in Norway. This model is a cohort component model in which different rates of fertility and emigration from Norway are applied to different immigrant groups, according to origin region (corresponding to the country groups described earlier) and duration of stay, as well as by age and sex (Syse et al. Citation2018). In addition to immigration projected for people born in the three country groups, the model also incorporates the return migration of people of Norwegian origin (currently at around 7,000 annually; this flow is further discussed later). Mortality rates are similar for immigrants and natives. We use the same rates for fertility, mortality, and out-migration as were used in the official Norwegian population projection published in 2018. The only differences from those projections are the changes made in immigration assumptions for each country group, where the differences resulting from age disaggregation were subtracted from the original immigration assumptions.
shows the differences in the projected population size of Norway due to the introduction of age disaggregation. Not surprisingly, the differences are largest (more than 2 million inhabitants in 2100) for method M4 (which also showed the largest differences in projected immigration in ).
Figure 7 Differences in projected population size in Norway, 2018–2100, caused by introducing age disaggregation into immigration projections
Source: As for .
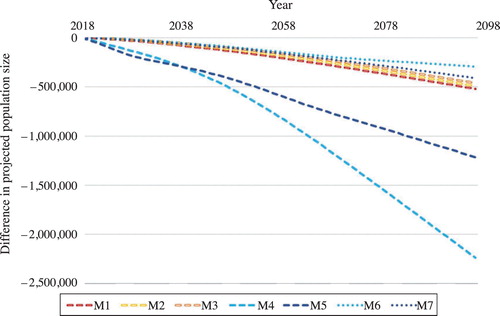
For most methods, however, the effect on the projected population in Norway in 2100 lies between 300,000 and 500,000 inhabitants. This is a considerable effect, given that Norway’s population in January 2020 was 5.4 million, and is projected to increase to about 7.3 million by 2100 according to the 2018 official projection’s main projection. For comparison, Norway’s capital Oslo was home to 690,000 inhabitants and the second largest city Bergen had 280,000 (as at January 2020). However, given the large uncertainty in population projections, the size of this age-disaggregation effect may instead be illustrated by comparing it with the effect of changing other assumptions: if the assumption on fertility had been reduced by 0.1 children per woman, the effect on projected population size in 2100 would have been around 450,000, almost the same as the effect of disaggregating by age using the majority of our methods. Or to put it differently: disaggregation by age in the immigration projections has approximately the same effect on projected future population size as reducing the assumptions on future period total fertility by 0.1 children per woman.
Conclusion and further work
Population projections are essential tools in planning for our future societies. However, they are uncertain, not least because projections of future immigration are very uncertain.
In the literature on determinants of international migration, a lot of work has been devoted to estimating the effect of different factors on migration flows. However, for these estimates to be useful for migration projections, forecasts of these relevant factors must also be available, which is seldom the case in the very long term. Here, we instead focus on a virtually neglected demographic factor relevant for migration, for which relatively reliable forecasts exist: ageing in origin regions.
Population ageing is already taking place in most countries of the world, as a result of declining fertility and increasing life expectancy, and it is expected to continue in the years to come. This ageing can have clear implications for migration flows, simply due to a reduced share of the population group with the largest propensity to migrate. By making the role of the international demographic process of ageing explicit in immigration projections, we are treating international migration as an integrated part of other global demographic patterns and processes.
Using different standard projection methods, we find that accounting for ageing in origin regions tends to lower projected immigration to Norway for the period 2018–2100. We compare two strategies for projecting immigration to Norway from three different regions. First, we disregard the age structure, and project emigration rates from the regions to Norway for all ages combined. Second, we use specific emigration rates for three age groups. We find that the effects of disaggregating by age are sizeable, although they vary somewhat between the different methods. In most methods, however, disaggregation by age in the immigration projections has approximately the same effect on future population size as reducing the assumptions on future period total fertility by 0.1 children per woman.
Thus, although many trends, such as cheaper transport and more transnational ties, may suggest increasing migration between countries in the years to come, our results suggest that ageing in origin regions is likely to pull in the other direction and contribute to lower migration.
It is possible that the effects of changing age structure may in fact be stronger than we estimate. Smaller cohorts may meet quite different opportunities in their home country compared with larger cohorts (Pampel and Peters Citation1995). For instance, their possibilities in the labour market may be different, with less competition for jobs, while different demands or expectations in the family sphere may also emerge if there are fewer siblings to take care of elderly parents. Such factors may increase the propensity for smaller cohorts to stay in their country of origin.
One aim of this paper is to present approaches that can also be used outside Norway. Since the UN data are freely available, it is possible in all national contexts to obtain information on projected ageing in origin countries. The UN publishes its data at the country level, which allows for high flexibility when it comes to tailoring the country groupings to mirror the immigration situation in the destination country studied.
The approach presented in this paper has some limitations and also some potential for further exploration and expansion. First, the country grouping is tailored for projecting immigration to Norway; other groupings of countries will be more relevant for projecting immigration to other countries. In addition, Country group 3 is large, encompassing many very different countries. One further development could be to split this group into several smaller groups. For instance, Africa could be a separate group, since this continent faces a different demographic outlook compared with Asia, for instance. Figure A4 in Appendix B (supplementary material) illustrates the effect of separating Africa from the rest of Country group 3 (mainly Asia, Latin America, and Eastern Europe outside the EU). The projected immigration is higher when considering Africa separately. However, for most of the methods applied, the effect of introducing age groups in the estimations (which is the main concern of this paper) is quite similar whether we split Country group 3 or not.
In principle, all the methods we apply can be used with more than three country groups. However, the quality of the data may vary, and it may be hard to obtain time series of the length used in this analysis. For the autoregressive time-series models, and especially the VAR models, it is important that the time series are of sufficient length. Thus, it may be challenging to use such models when applied to a very disaggregated grouping of the countries, if that affects the quality of the time series. Large country groups may also give more stable results when migration flows increase from some countries and decrease from other countries within the same group, whereas the use of smaller country groups essentially assumes no shift in migration trends between origin areas (apart from those due to changing population and age structure).
The second limitation concerns projections of return migration of natives (in this case, people of Norwegian origin). This type of migration is harder to estimate using the methods presented in this paper, because there are usually no data—or, equally important, forecasts—available for natives living abroad, particularly not by age, as needed as denominators in the estimations and projections. In the Norwegian population projections, this return migration is projected by a simple extrapolation of the registered immigration in this group, usually around 7,000–10,000 annually (Syse et al. Citation2018). One alternative could be to estimate a ‘pool’ of natives abroad, by using registered (and projected) out-migration of natives alongside assumptions on their mortality. Then return migration rates may be applied to such a pool, an approach explored in Sweden’s population projections (Statistics Sweden Citation2014). To estimate such a pool, UN ‘International migrant stock’ data on migrants by origin country might also be useful (United Nations Citation2019b), although these data are not published by age and do not include forecasts.
Another way around this could be to replace immigration of those born in other countries with all immigration entries by country or region of departure, no matter where the people were born. However, many national population projections produce figures of residents by origin. In those cases, this latter approach would require some additional assumptions on the share of immigrants from each region who are native born.
Finally, while the method outlined in this paper allows population size and age composition in origin regions to change, it basically assumes that other factors affecting migration—such as economic conditions—are held constant, which most probably will not be the case. However, it is possible to extend the method to include other determinants of migration, estimating emigration rates as left-hand variables in an econometric model. The official population projections published by Statistics Norway use econometric models that resemble those reported by Cappelen et al. (Citation2015). These were dynamic single-equation models for total emigration rates, where right-hand variables were relative income per capita, unemployment rates, and stock of immigrants already living in Norway as a proxy for network effects. Furthermore, some dummy variables were included to capture the effects of special events. Within this framework it should also be possible to use an age-disaggregated approach, in which each of the three regions has a set of three regression equations, where the left-hand variables are (logs of) emigration rates for the three age groups we consider in this paper.
In conclusion, the results of this study make a case for accounting for changing age profiles in origin regions when projecting future immigration to any country, irrespective of the method currently in use. Although this is only one of a multitude of factors that may affect future migration flows, it is one of few where forecasts exist for the very long term.
Supplementary Material
Download PDF (1,015.7 KB)Additional information
Funding
Notes
1 Terje Skjerpen is based at Statistics Norway. Marianne Tønnessen is based at the Norwegian Institute for Urban and Regional Research, Oslo Metropolitan University. Please direct all correspondence to Marianne Tønnessen, P.O. Box 4, St. Olavs plass, 0130 Oslo, Norway; or by E-mail: [email protected]
2 We are grateful for constructive comments provided by the editor, two anonymous reviewers, Gunnar Andersson, Astri Syse, and Michael Thomas, as well as participants at Stockholm University’s SUDA Colloquium and the Nordic 2019 meeting for population projections in Copenhagen. This work was supported by Statistics Norway and the Swedish Research Council (Vetenskapsrådet) through the Swedish Initiative for Research on Microdata in the Social and Medical Sciences (SIMSAM), grant number 340–2013–5164.
References
- Abel, G. J. 2018. Estimates of global bilateral migration flows by gender between 1960 and 2015, International Migration Review 52(3): 809–852. doi:10.1177/0197918318781842 doi: 10.1111/imre.12327
- Abel, G. J., and J. E. Cohen. 2019. Bilateral international migration flow estimates for 200 countries, Scientific Data 6(1): 1–13. doi: 10.1038/s41597-019-0089-3
- Abel, G. J., and N. Sander. 2014. Quantifying global international migration flows, Science 343(6178): 1520–1522. doi: 10.1126/science.1248676
- Bijak, J. 2011. Forecasting International Migration in Europe: A Bayesian View. Dordrecht: Springer.
- Cappelen, Å, T. Skjerpen, and M. Tønnessen. 2015. Forecasting immigration in official population projections using an econometric model, International Migration Review 49(4): 945–980. doi: 10.1111/imre.12092
- Champion, T., T. Cooke and I. Shuttleworth (eds). 2018. Internal Migration in the Developed World: Are We Becoming Less Mobile? Oxon: Routeledge.
- Coleman, D. 2008. The demographic effects of international migration in Europe, Oxford Review of Economic Policy 24(3): 452–476. doi: 10.1093/oxrep/grn027
- Conte, A., and S. Migali. 2019. The role of conflict and organized violence in international forced migration, Demographic Research 41(14): 393–424. doi: 10.4054/DemRes.2019.41.14
- Cooke, T. J. 2011. It is not just the economy: Declining migration and the rise of secular rootedness, Population, Space and Place 17(3): 193–203. doi: 10.1002/psp.670
- Cooke, T. J. 2013. Internal migration in decline, The Professional Geographer 65: 664–675. doi: 10.1080/00330124.2012.724343
- de Haas, H. 2011. The determinants of international migration. IMI Working Papers (32), International Migration Institute.
- Hatton, T. J., and J. G. Williamson. 2003. Demographic and economic pressure on emigration out of Africa, Scandinavian Journal of Economics 105(3): 465–486. doi: 10.1111/1467-9442.t01-2-00008
- Hatton, T. J., and J. G. Williamson. 2005. What fundamentals drive world migration?, in G. J. Borjas and J. Crisp (eds), Poverty, International Migration and Asylum. London: Palgrave Macmillan, pp. 15–38.
- Karemera, D., V. I. Oguledo, and B. Davis. 2000. A gravity model analysis of international migration to North America, Applied Economics 32(13): 1745–1755. doi: 10.1080/000368400421093
- Kim, K., and J. E. Cohen. 2010. Determinants of international migration flows to and from industrialized countries: A panel data approach beyond gravity, International Migration Review 44(4): 899–932. doi: 10.1111/j.1747-7379.2010.00830.x
- Lee, R. 2011. The outlook for population growth, Science 333(6042): 569–573. doi: 10.1126/science.1208859
- Massey, D. S., J. Arango, G. Hugo, A. Kouaouci, A. Pellegrino, and J. E. Taylor. 1993. Theories of international migration: A review and appraisal, Population and Development Review 43: 1–466.
- Mayda, A. M. 2010. International migration: A panel data analysis of the determinants of bilateral flows, Journal of Population Economics 23(4): 1249–1274. doi: 10.1007/s00148-009-0251-x
- Ortega, F., and G. Peri. 2013. The effect of income and immigration policies on international migration, Migration Studies 1(1): 47–74. doi: 10.1093/migration/mns004
- Pampel, F. C., and H. E. Peters. 1995. The Easterlin effect, Annual Review of Sociology 21(1): 163–194. doi: 10.1146/annurev.so.21.080195.001115
- Raymer, J., and A. Rogers. 2008. Applying model migration schedules to represent age-specific migration flows, in J. Raymer and F. Willekens (eds), International Migration in Europe: Data, Models and Estimates. Chichester, UK: Wiley, pp. 175–192.
- Raymer, J., and A. Wiśniowski. 2018. Applying and testing a forecasting model for age and sex patterns of immigration and emigration, Population Studies 72(3): 339–355. doi: 10.1080/00324728.2018.1469784
- Rogers, A., and L. J. Castro. 1981. Model migration schedules. International Institute for Applied System Analysis, Austria.
- Skeldon, R. 2017. International migration, internal migration, mobility and urbanization: Towards more integrated approaches. Population Division Department of Economic and Social Affairs United Nations Secretariat, New York, USA.
- Statistics Norway. 2019. Immigrants by reason for migration. Statistics. Available: https://www.ssb.no/en/befolkning/statistikker/innvgrunn (accessed: September 2019).
- Statistics Sweden. 2014. Sverigeföddas återinnvandring efter bakgrund [Re-immigration of Swedish-born by background], Bakgrundsmaterial om Demografi, Barn och Familj 2014: 1.
- Statistics Sweden. 2018. Sveriges framtida befolkning 2018–2070. [The future population of Sweden 2018–2070], Demografiska Rapporter 2018: 1.
- Syse, A., S. Leknes, S. Løkken, and M. Tønnessen. 2018. Norway’s 2018 population projections: Main results, methods and assumptions. Reports 2018/22, Statistics Norway.
- United Nations. 2019a. World Population Prospects 2019. Population Division, Department of Economic and Social Affairs. Available: https://population.un.org/wpp/ (accessed: September 2019).
- United Nations. 2019b. International Migrant Stock 2019. Population Division, Department of Economic and Social Affairs. Available: www.un.org/en/development/desa/population/migration/data/estimates2/estimates19.asp (accessed: May 2020).
- United States Census Bureau. 2018. Methodology, Assumptions, and Inputs for the 2017 National Population Projections. Available: https://www2.census.gov/programs-surveys/popproj/technical-documentation/methodology/methodstatement17.pdf (accessed: September 2019).
- Weber, H. 2019. Can violent conflicts explain the recent increase in the flow of asylum seekers from Africa into Europe?, Journal of Immigrant and Refugee Studies 17(4): 405–424. doi: 10.1080/15562948.2018.1517424
- Wilson, T. 2010. Model migration schedules incorporating student migration peaks, Demographic Research 23(8): 191–222. doi: 10.4054/DemRes.2010.23.8
- Wiśniowski, A., J. J. Forster, P. W. F. Smith, J. Bijak, and J. Raymer. 2016. Integrated modelling of age and sex patterns of European migration, Journal of the Royal Statistical Society: Series A (Statistics in Society) Journal of the Royal Statistical Society: Series A 179(4): 1007–1024. doi: 10.1111/rssa.12177