
 ?Mathematical formulae have been encoded as MathML and are displayed in this HTML version using MathJax in order to improve their display. Uncheck the box to turn MathJax off. This feature requires Javascript. Click on a formula to zoom.
Abstract
International migration has increased since 1990, with increasing numbers of migrants originating from low- and middle-income countries (LMICs). Efforts to explain this compositional shift have focused on wage gaps and other push and pull factors but have not adequately considered the role of demographic factors. In many LMICs, child mortality has fallen without commensurate economic growth and amid high fertility. This combination increases young adult populations and is associated with greater outmigration: in the poorest countries, we estimate that a one-percentage-point increase in the five-year lagged growth rate of the population of 15–24-year-olds was associated with a 15 per cent increase in all-age outmigrants, controlling for other factors. Increases in growth of young adult populations led to 20.4 million additional outmigrants across 80 countries between 1990 and 2015. Understanding the determinants of these migration shifts should help policymakers in origin and destination countries to maximize their potential positive effects.
Introduction
International migration has increased in both absolute and relative terms since 1990, with increasing numbers of migrants originating from low- and middle-income countries (LMICs, as defined by the World Bank (Citation2020)) (). Explanations for this compositional shift have focused on migration as a response to hardship, with people pushed from their homes by factors such as conflict, corruption, and climate change, and pulled to the relative safety and prosperity offered elsewhere (Lee Citation2003). Here we consider if these explanations should give greater consideration to the role of demographic transitions: shifts in a country’s total population growth rate that occur with changes in child (under-five) mortality and fertility, which usually coincide with economic shifts. In many contemporary LMICs, these transitions are unfolding differently from previous transitions elsewhere, resulting in expanding populations of young adults of working age (Hatton and Williamson Citation1994; Clemens Citation2014) alongside stagnating incomes (): a scenario with significant new implications for global migration.
Figure 1 International migrants, 1990–2019: (a) Percentage of the total global population who are international migrants and (b) Composition of total stock of international migrants by World Bank income group of origin country
Notes: World Bank income groups are based on gross national income per capita (GNIpc) in 2018 US dollars (USD): Low-income economies (<$1,025); Lower-middle-income economies ($1,025–$3,995); Upper-middle-income economies ($3,995–$12,375); and High-income economies (>$12,375).
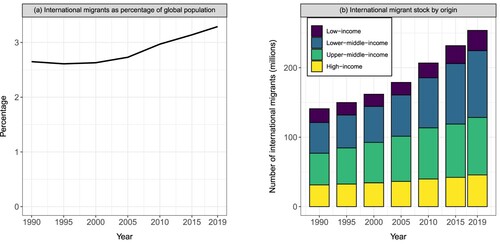
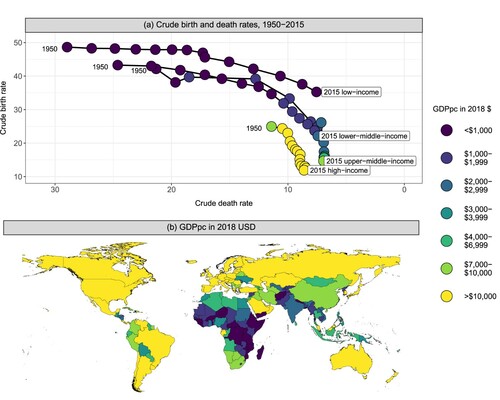
Figure 2 (a) Trajectories of crude death and birth rates for countries in each of the four contemporary World Bank income groups, 1950–2015; and (b) GDPpc by country, 2018
Notes: In panel (a) one dot represents each five-year period. World Bank income groups are based on gross national income per capita (GNIpc) in 2018 US dollars (USD): Low-income economies (<$1,025); Lower-middle-income economies ($1,025–$3,995); Upper-middle-income economies ($3,995–$12,375); and High-income economies (>$12,375). For panel (b) gross domestic product per capita (GDPpc) in 2018 USD comes from the Institute for Health Metrics and Evaluation’s GDPpc time series, which provides complete modelled estimates back to 1950.
Source: World Population Prospects 2019 dataset (United Nations Population Division Citation2019).
The high child mortality rates that characterized populations for most of human history (Deaton Citation2013) fell alongside increasing economic development in many of today’s high-income countries. Declines in fertility lagged behind this change, before stabilizing in a period of low mortality and fertility (Kirk Citation1996). The initial combination of low child mortality and high fertility produced a ‘natural increase’ in these countries’ populations and a change in their age structures, resulting in higher proportions of working-age young adults: a scenario which, when coupled with favourable policy conditions, can produce a potential ‘demographic dividend’ for growing economies (Bloom, Canning, and Finlay Citation2010).
In most LMICs, child mortality began to decline later, with the sharpest declines beginning after 1970 in South Asia and after 1990 in sub-Saharan Africa (Lam Citation2011). Since 2000, child mortality rates have been falling even in the most impoverished nations (Burstein et al. Citation2019), altering the historical relationship between income and child survival. Concurrently, fertility has remained high in many LMICs, especially in Africa (Howse Citation2015; Bongaarts Citation2017). The combination of higher rates of child survival and slow declines in fertility has meant that populations are growing fast in those countries with low gross domestic product per capita (GDPpc) (Bloom, Canning, and Sevilla Citation2001; Headey and Hodge Citation2009; United Nations Population Division Citation2019): see . In the period since 1950, countries such as the United States (US) and France experienced their fastest growth rates in the population of young adults aged 15–24 in around 1970 (3.6 per cent and 3.9 per cent annually, respectively), when the GDPpc of those nations was roughly $25,000 (2018 US dollars [USD]). In contrast, countries in sub-Saharan Africa and Southeast Asia experienced their fastest young adult population growth rates around 1990 (e.g. 3.9 per cent in Ethiopia and 5.1 per cent in Bangladesh), when the GDPpc of those nations was well below 1,000 USD (James et al. Citation2012; United Nations Population Division Citation2019).
Zelinsky (Citation1971) pioneered the idea of a mobility transition and theorized that the different stages of demographic transition and the modernization of societies had implications for migration. Zelinsky (p. 230) argued that ‘early transitional societies’ with rapidly declining mortality, ongoing high fertility, and high population growth would experience ‘major outflows of emigrants’. Easterlin (Citation1961) and others (Hatton and Williamson Citation1994) observed nineteenth-century immigration to the US from European countries and found a greater association for nations with higher rates of natural increase 20 years prior, even those with rising incomes. The theoretical literature is divided, however, on whether the co-occurrence of high fertility and high child survival in contemporary lower-income countries produces, on balance, greater outmigration. On one hand, high fertility and higher child survival generally result in a higher proportion of working-age young adults, and the expectation is that this population is more likely to emigrate than their older and younger counterparts, especially in countries with high youth unemployment (Clemens Citation2014). On the other hand, the low incomes in many LMICs may have the greater influence on outmigration, depriving young adults of the resources needed to move, thus hindering them from emigrating (Hatton and Williamson Citation2003; Sander and Charles-Edwards Citation2017). Still other researchers have contested the explanatory power of demographic change over current outmigration, concluding that outmigration is conditional on differential wages, migrant networks, or labour markets in the destination country (Hanson and McIntosh Citation2010; Salinari and De Santis Citation2013; Hanson and McIntosh Citation2016) or is just one modest contributor in the larger push–pull framework (Massey Citation1998; Mayda Citation2010; Van Hear, Bakewell, and Long Citation2018). Zlotnik (Citation2004, p. 25), for instance, concluded: ‘In sum, the relation between net migration and natural increase according to the only global set of estimates available does not seem to be strong enough to merit further exploration’.
Incomplete and incomparable migration data have hindered quantitative assessments of the relative roles of young adult population growth, GDPpc, and youth unemployment in spurring outmigration in LMICs. Until recently, international data were drawn largely from Europe and other high-income nations. Accordingly, assessments of the demographic determinants of international migration generally ignored South-to-South migration, instead relying on mortality and fertility rates to produce indirect estimates of net migration based on the residual population of those poorer countries (Hanson and McIntosh Citation2010; Cuaresma, Moser, and Raggl Citation2013; Ramos and Suriñach Citation2017; Gamso and Yuldashev Citation2018). More recently, Abel and Cohen (Citation2019) used data from the United Nations (UN) sequential stock tables to produce direct estimates of the total number of outmigrants from each country to every other country during five-year periods between 1990 and 2015.
We seek to quantify the impact of young adult population growth in LMICs on the compositional shifts occurring in migration (i.e. more international migrants coming from LMICs in both relative and absolute terms). To do so, we use migration and population estimates from the UN’s World Population Prospects 2019 (WPP2019) data (United Nations Population Division Citation2019) to investigate whether rapid growth rates in young adult populations (aged 15–24, lagged by five years) were associated with increased total (all-age) outmigration in 80 LMICs between 1990 and 2015. We also consider the roles of GDPpc and the youth unemployment rate (as estimated by the International Labour Organization Citation2018) in moderating the observed effect of young adult population growth on migration, and we estimate the magnitude of the observed effect from 1990 to 2015 by geographic region, country income group, and individual country compared with a hypothetical scenario where there had been no population growth over the period.
Policy debate over immigration has intensified alongside the compositional shift in migration flows, leading to social unrest in wealthy nations and a wave of nationalist electoral victories. Estimating the association between growth in the young adult population and outmigration is a novel analysis that should help policymakers in origin and destination nations to understand the determinants of these shifts in migration flows and thus to plan for and maximize the potential positive effects of young adult population growth and future migration.
Methods
We estimate an extended gravity model using bilateral migration flow data to examine the relationship between growth in an origin country’s young adult population (aged 15–24, lagged by five years) and outmigration. Each country-dyad (pair of countries) enters the model twice, with each country once as the origin and once as the destination country. We focus on the relationship between the lagged population growth rate for ages 15–24 in the origin country and the total number of migrants leaving that country, conditional on other origin- and destination-country characteristics. By focusing on an origin-country characteristic, we are deliberately focusing on outflows. We estimate models for all countries and also estimate separate models using data stratified by region as defined by the Global Burden of Diseases, Injuries, and Risk Factors (GBD) study (Murray et al. Citation2012). We control for a range of alternative drivers in origin countries (push factors): the employee–population ratio; the growth rate of GDPpc; the proportion living in urban areas; political freedom; the average gap between the GDPpc of the origin and destination countries; and mortality shocks from both war (conflict, military operations, and terrorism) and natural disasters. We estimate counterfactual scenarios in order to contextualize the relative impact of the observed lagged young adult population growth rate over our period of analysis, 1990–2015. Our study follows the Guidelines for Accurate and Transparent Health Estimates Reporting (GATHER) (Stevens et al. Citation2016; see supplementary material, section 1).
Migration and population data
We use estimates of bilateral migration flows across 80 countries between 1990 and 2015. Abel and Cohen (Citation2019) used data from sequential population stock tables published by the UN to estimate bilateral outmigration rates directly by using data from place-of-birth responses in censuses, refugee surveillance programmes, and other demographic registers. The authors compared a series of proposed estimation methods. By comparing these with known migrant flow data produced by select countries with robust population tracking systems, Abel and Cohen (Citation2019) suggested that closed demographic accounting approaches are the preferred method for estimating global bilateral migrant flows based on incomplete stock data. For our main analysis, we use the ‘demographic accounting, pseudo-Bayesian (closed)’ method, which is the one most well supported in Abel and Cohen (Citation2019) and most like the method previously introduced by Azose and Raftery (Citation2018) (for further discussion, see supplementary material, section 2). The result is estimates of the total number of outmigrants from each country to every other country within five-year periods between 1990 and 2015. In order to focus on geographical regions of the world that have experienced dramatic improvements in child survival since 1950, we subset these data to origin countries in four regions: (1) sub-Saharan Africa; (2) North Africa and the Middle East; (3) Asia; and (4) Latin America and the Caribbean. Our dependent variable of interest is the count of migrants that flow from each origin country to each destination country globally. Further discussion on migration databases and previous bilateral analyses can be found in the supplementary material (sections 2–3).
We use population estimates from WPP2019 (United Nations Population Division Citation2019) to calculate our independent variable of interest, the annualized exponential growth rate in the total young adult population (aged 15–24). These numbers are prepared by the Population Division of the Department of Economic and Social Affairs of the UN Secretariat. We aggregate populations to 10-year age groups and five-year period totals to align with the five-year migration totals. For each country () and year (
), we then calculate the annualized exponential growth rate (
) illustrated in Equationequation (1)
(1)
(1) for the population aged 15–24 (
) compared with the size of that population in year
:
(1)
(1) As human populations grow exponentially rather than linearly, we believe this formulation of the growth rate is the most appropriate. In our regression models described later, growth (
) is lagged by one five-year period. By examining the relationship between contemporary outmigration and the lagged growth rate, we are more precisely observing the point at which relatively large cohorts age into the prime migrating ages (20–29). For further discussion and context for using this lagged measure of population growth, see the supplementary material (section 4).
Covariate data
We control for a variety of political and macroeconomic factors that have been shown to be associated with outmigration rates. These include GDPpc, the employee–population ratio, mortality shocks from war and natural disasters, political freedom, and the proportion of the population living in urban areas.
Estimates of GDPpc are taken from estimated time series provided by the Institute for Health Metrics and Evaluation (IHME), which uses five sources of GDPpc data to estimate a single GDPpc series (corrected for purchasing power parity) that is complete across all countries and years included in this study (James et al. Citation2012). We transform these data in several ways. First, we use GDPpc in each country-year as a proxy for current economic and labour conditions. It is expected that during periods with low GDPpc, countries may be less equipped to provide employment to larger young adult cohorts, and this may push larger proportions to out-migrate. Second, we include the gap in GDPpc between every origin and destination country. This variable serves as a proxy for the traditional macroeconomic push–pull theory of international migration. Many scholars argue that as gaps in capital and labour widen between capital-poor/labour-rich and capital-rich/labour-poor countries, international migration will naturally increase; this is termed the neoclassical economic theory of international migration. Third, to examine whether the relationship between growth in the young adult population and outmigration is moderated by national economic conditions, we include the interaction of GDPpc with our lagged young adult population growth rate measure.
The employee–population ratio is taken from Key Indicators of the Labour Market (International Labour Organization Citation2018). This indicator measures the share of a country’s working-age population (aged 15 and older) that is employed. The ratio is often used to assess the ability of an economy to produce jobs in accordance with the population of working-age individuals. The unemployment rate can change as a function of individuals simply leaving the labour force or via changing definitions of who is counted as a worker, making it difficult to compare this rate across time and countries. The employee–population ratio is less affected by short-term fluctuations in the labour market and more representative of the long-run ability of an economy to produce jobs (in our case, over five-year periods). This measure is comparable to the approaches that other international migration scholars have used to assess the impact of countries’ ‘absorptive capacity’ on pushing young adults to migrate (or not) (Boyd Citation2002).
The near-universal process of urbanization across countries may act as a ‘safety valve’ for migration, thereby reducing the effect of population pressure. We control for a measure of urbanization from 2018 Revision of World Urbanization Prospects: the percentage of total population residing in each urban agglomeration with 300,000 inhabitants or more in 2018, by country (United Nations Population Division Citation2018). Urban agglomerations capture the population both within a city or town and in the suburban areas adjacent to the city boundaries.
In addition to broad social and economic trends within countries, it is important to account for exogenous shocks that may plausibly have acute effects on either suppressing or spurring outmigration. Two categories of such events are natural disasters and war, which can both create periods of substantial refugee outmigration or physically inhibit mobility among populations that may otherwise be pushed to migrate. To account for this, we include estimates of mortality shocks from IHME in our model (GBD Citation2017 Causes of Death Collaborators Citation2018). These estimates are based on vital registration data for countries with high-quality systems, but the vast majority of countries (122 out of 195) are designated as not meeting these criteria. Because we are focusing on LMICs in the present analysis, the mortality shock estimates we include in our modelling for military operations and terrorism are derived from the Uppsala Conflict Data Program and for natural disasters, transport accidents, fires, exposure to mechanical forces (e.g. building collapses or explosions), and famine are derived from the Centre for Research on the Epidemiology of Disasters’ International Disaster Database.
Last, the Polity2 index, a measure of a country’s political framework ranging from strongly democratic to strongly autocratic, is a proxy for political freedom, which can also inhibit or encourage mobility (Integrated Network for Societal Conflict Research Citation2017). This index is taken from the Polity IV Annual Time-Series, 1800–2017 (Center for Systemic Peace Citation2019), and is modified for time-series analyses. Unlike mortality shocks, which may spur high levels of outmigration, restricted political freedom may result in artificially low outmigration. In support of this, Wesselbaum and Aburn (Citation2019) found (also using Polity2) that democracy in the origin country acts as a push factor: as democracy increases, outmigration from that country also increases.
Gravity model of migration flows
The conventional gravity model (based on Newton’s law of universal gravitation) has been used for decades to study international trade, migration, and commuting flows (Lewer and Van den Berg Citation2008; Beine, Bertoli, and Fernández-Huertas Moraga Citation2016). This mathematical model posits that the gravitational force (M) between two objects (), given their masses (
,
), the distance between them (
), and a constant (
), is given by the following equation:.
(2)
(2) Previous analyses of international trade and migration have extended the basic empirical gravity model to include relevant push and pull factors that might modulate the basic gravity relationships between ‘mass’ and distance (Lewer and Van den Berg Citation2008; Beine, Bertoli, and Fernández-Huertas Moraga Citation2016). When using panel data that include migration flows across multiple years, some analyses have included country or regional fixed effects to account for time-invariant, unobserved characteristics that might confound the estimated relationship between the target variable and migration flows (Llull Citation2016). In the present analysis, we draw on these innovations to estimate the extended gravity model for total observed migrants (M) from origin (i) to destination (j) using our migration flow panel data (for 1990–95, 1995–2000, 2000–05, 2005–10, and 2010–15):
(3)
(3)
The first line includes the gravity terms, reflecting the basic model that all else being equal, the migrant flow from origin country () to destination country (
) in year (
) is a function of the size of the population in the origin country (
) and the destination country (
), the distance between them (
), and a constant (
).
The second line indicates our key independent variables for predicting fluctuations around this basic gravity model: the lagged population growth rate (), log GDPpc (
), and their interaction. These terms reflect our core hypothesis that the magnitude of outmigration from a given country is influenced by the growth rate of the population ageing into prime migrating ages (20–29), conditional on the economic situation (GDPpc) in that country.
The third line includes several controls. First, we include a vector of origin-country characteristics (): the GDP gap with the destination country, the employee–population ratio, the Polity2 index of democratic governance, the proportion living in urban areas, the mortality rate from war/conflict, and the mortality rate from natural disasters. Second, we include fixed effects (
) for the origin country to account for unobserved, time-invariant heterogeneity in migrant flows. Last, we include fixed effects for the destination region (
) to account for unobserved, time-invariant heterogeneity in the pull factors associated with migrant destinations. All variables are normalized with mean ‘0’ and standard deviation ‘1’, with the exception of
. This means that we can interpret the parameter of interest,
in Equationequation (3)
(3)
(3) , as the multiplicative increase in expected migrants conditional on a specific level of GDPpc in the origin country with all controls at their means.
We estimate the unknown parameters using a Quasi-Poisson regression. There are two primary advantages of the Quasi-Poisson specification over the alternative log-linear ordinary least squares model. First is the straightforward incorporation of observed zero counts, which are prevalent in bilateral flow data (23 per cent of the 54,563 country-year dyads in our final analytic sample contain zero migrants), and parameter estimates in the traditional log-linear model can be very sensitive to how these are handled (e.g. through adding some arbitrary offset). Second, the Quasi-Poisson model specifically makes a less restrictive assumption about the mean–variance relationship than the Poisson model, and this is preferable when data are overdispersed (which is the case in the current data).
An alternative model specification (zero-inflated Poisson) is provided in the supplementary material (section 5). We find that the differences across these model specifications do not produce substantive differences in our main conclusions regarding the relationship between the lagged young adult population growth rate and migration, so we present all results using the more parsimonious Quasi-Poisson model, which is the model now frequently used in studies estimating empirical gravity models. We also provide tests for non-linearity in the growth rate and GDPpc interaction term in the supplementary material (section 6), but we do not find conclusive evidence to suggest the use of a more flexible functional form. All models are fitted using the R statistical learning software, version 4.0.2.
Counterfactual migrant totals
To obtain an estimate of the number of additional migrants over the observed period that were due to observed changes in the population growth rate of young adults, we generate a counterfactual comparison using our fitted gravity model (Equationequation (3)(3)
(3) ). The logic of this natural counterfactual comparison is to examine the difference between the predicted number of migrants in our observed data (i.e. what actually happened) with the predicted number of migrants if we hold young lagged adult population growth rates at zero but still allow all other factors to change as observed (i.e. what would have happened had growth been zero). This contrast provides an additional (and perhaps more intuitive) perspective to the regression coefficients, which themselves are comparing only the marginal difference between two hypothetical potential outcomes, holding all other characteristics constant at their averages.
This comparison is illustrated in Equationequation (4)(4)
(4) , and we sum this expected value across all destination country-years to arrive at a total cumulative estimate of additional migrants attributable to growth for every origin country (
) over the entire period 1990–2015:
(4)
(4) These counterfactual estimates are presented by country and also aggregated to GBD regions and World Bank income groups. We also compare the absolute contribution estimated from the counterfactual scenario of a young adult population growth rate of zero with several other counterfactual scenarios (supplementary material, section 7) to contextualize the relative magnitude of the contribution of observed growth to outmigration.
Results
Using data on bilateral migration flows from 80 origin LMICs to all destination countries, we employ our extended gravity model of migration to estimate the association between increases in the lagged growth rate of the young adult population (aged 15–24) and total migrants five years later, when those relatively large cohorts age into the prime migrating window at ages 20–29 (United Nations Population Division Citation2019). Our analysis shows there was a positive association between lagged growth rates and outmigration during the study period, 1990–2015 (). In a model using data from all countries (), we compare the effects of lagged young adult population growth on outmigration, controlling for alternative drivers in origin countries, for example growth in GDPpc, urbanization, political freedom, the employee–population ratio, mortality shocks, and the income gap between origin and destination countries (Hanson and McIntosh Citation2012; Salinari and De Santis Citation2013; Flahaux and De Haas Citation2016). Further detail on mortality shocks is presented in the supplementary material (section 8). Estimates for all countries, as well as descriptive statistics on control variables, are presented in the supplementary material (Table S3).
Table 1 Regression results (exponentiated coefficients) for models including an interaction between the lagged young adult population growth rate and: (1) gross domestic product per capita (GDPpc); (2) gross national income per capita (GNIpc); or (3) youth unemployment
Moderating effects of GDPpc and youth unemployment
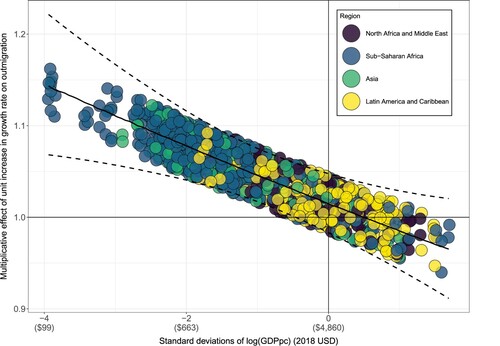
Our analysis of all 80 origin LMICs combined also indicates that GDPpc and, to a lesser extent, youth unemployment moderated the effect of lagged young adult population growth rates on migration (; growth rate by GDPpc interaction term in ). We find similar results using gross national income per capita (GNIpc). We plot the growth rate interaction effect by levels of GDPpc in observed country-years in . In the poorest country-years in our study (four standard deviations below the average log GDPpc of all global country-years 1990–2015, that is, roughly $99 in 2018 USD), a one-percentage-point increase in the lagged young adult population growth rate was associated with a 15 per cent increase in total (all-age) outmigrants from 1990 to 2015, compared with a 4 per cent decrease in the wealthiest country-years (1.5 standard deviations, $21,821). The poorer country-years are clustered in sub-Saharan Africa and Asia (). Youth unemployment yielded similar, but not statistically significant, results to GDPpc (i.e. more youth unemployment was associated with a stronger influence of growth on outmigration; ).
Figure 3 Estimated relationship between lagged growth rates in the young adult population (aged 15–24) and total outmigrants five years later for all low- and lower-middle-income country-years, by region, 1990–2015
Notes: The y-axis represents the multiplicative increase in total outmigrants associated with a one-percentage-point increase in the lagged young adult population growth rate. GDPpc is represented in terms of global 1990–2015 standard deviations on the x-axis. Each point represents a country-period (e.g. Uganda 2000–05). Although each value along the x-axis (GDPpc) corresponds only to a single predicted coefficient value on the y-axis, the points in this figure are jittered, adding random noise , to reduce overlap and more clearly visualize results in terms of regions.
Source: Authors’ analysis of data from a variety of sources; see Methods section for further details.
In separate models using data stratified by region (supplementary material, section 9), we find that a one-percentage-point increase in the lagged young adult population growth rate (range: −4.1 to 8.1 per cent, median: 2.8 per cent) was associated with a 13 per cent increase in total outmigrants from sub-Saharan Africa over our period of analysis, 1990–2015, the only region where this relationship was significant in stratified models. The relationships between young adult population growth and outmigration in North Africa and the Middle East (8 per cent), Latin America (5 per cent), and Asia (7 per cent) were all smaller, but positive (supplementary material, section 9).
Impact of young adult population growth on absolute number of migrants, 1990–2015
To examine the absolute contribution of lagged young adult population growth to total (all-age) outmigration, we estimate a counterfactual scenario of expected outmigration, had countries not experienced young adult population growth (at ages 15–24) five years prior (). We find that if there had been no growth in this population over the period, there would have been 20.4 million fewer outmigrants across all 80 LMICs between 1990 and 2015 () compared with what was observed. The largest positive contributions of young adult population growth to overall outmigration were seen in lower-middle-income nations (11.1 million additional outmigrants) and low-income nations (8.7 million) over the study period. In upper-middle-income countries, where the young adult share of the population was largely shrinking between 1990 and 2015, the positive effect of lagged growth rates on the total number of outmigrants was much smaller (0.6 million).
Table 2 Estimates of the positive and negative contributions to total outmigrants by region, 1990–2015, from the effect of the lagged young adult population growth rate compared with if the young adult population growth rate were zero
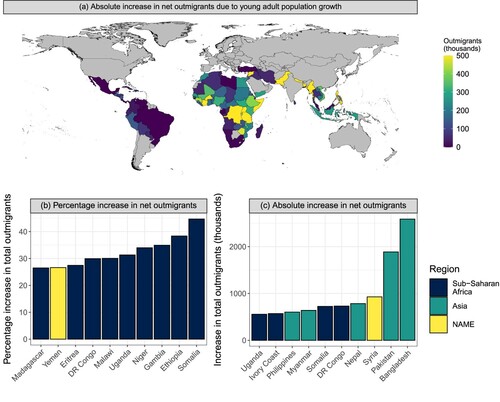
Geographically, South Asia experienced the largest positive contribution of outmigrants associated with lagged young adult population growth rates (5.3 million), followed by eastern sub-Saharan Africa (4.2 million) and western sub-Saharan Africa (3.8 million) (; (a)). The large absolute effect of lagged young adult population growth rates in South Asia was mostly a result of the population size of the affected nations, with the populous nations of Bangladesh and Pakistan contributing the greatest associated numbers of outmigrants ((c)). In Africa, the largest positive contributions of outmigrants that were associated with lagged young adult population growth rates occurred in the Democratic Republic of Congo and Somalia, countries characterized by relatively high young adult population growth rates and low GDPpc ((c)). The largest relative increases in outmigration occurred largely in Africa, especially in Somalia, Ethiopia, Gambia, and Niger ((b)).
Figure 4 (a) Map of absolute contributions of lagged young adult population growth rates to total net outmigrants over the period 1990–2015; Estimates for the top ten countries in terms of the (b) relative and (c) absolute contributions of young adult population growth to total net outmigrants, 1990–2015
Note: NAME = North Africa and the Middle East. Source: As for .
Discussion
The effect of demographic transitions in low-income nations on migration
Our study found that the effect of lagged young adult population growth rates on total (all-age) outmigration was strongest in those countries without commensurate economic growth (supplementary material, Table S3). The effect of lagged young adult population growth on outmigration was largest in the sub-Saharan African and South Asian regions in our study (), where GDPpc was lower than in other regions and which experienced average declines in child (under-five) mortality (of 49 and 54 per cent, respectively) between 1990 and 2015 (United Nations Population Division Citation2019). Within sub-Saharan Africa, the subregions with the largest impact of growth on outmigration were eastern and western sub-Saharan Africa (), where regional average child mortality rates declined by 60 and 46 per cent, respectively, between 1990 and 2015, and total fertility was 4.43 and 5.18 births per woman, respectively, in 2015 (United Nations Population Division Citation2019).
Most of the countries with large percentage increases in net outmigrants due to growth in young adult populations were in sub-Saharan African nations experiencing significant declines in child mortality amid low GDPpc and high fertility ((b); supplementary material, Table S3). In Ethiopia, Gambia, Niger, Somalia, and Uganda, the realized effect of lagged young adult population growth is estimated to have increased net outmigrants by 32–45 per cent over the study period ((b)). The absolute numbers of net outmigrants added by the effect of young adult population growth were largest in the populous nations of Bangladesh (2.6 million), Pakistan (1.9 million), Syria (0.9 million), Nepal (0.8 million), and the Democratic Republic of Congo (0.7 million) ((c)). In contrast, a higher GDPpc in many countries in Latin America and the Caribbean and in North Africa and the Middle East, as well as more political instability in the Middle East and Africa, may have influenced refugee flows and diminished the effect of macro drivers, such as young adult population growth, on migration during the study period.
In supplementary analysis, we also found that the association between a one-percentage-point increase in the lagged young adult population growth rate and all-age outmigrants in low-income countries was larger between 1990 and 2010 (22 per cent) than it was over the full 25-year study period (15 per cent) (supplementary material, Figure S4). This gradual decline in the effect of young adult population growth on outmigration in the poorest nations is worthy of further research, especially if the trend persists, as it may inform the theoretical literature on the dissipating effect of young adult population growth on outmigration that occurs as demographic transitions play themselves out (Hatton and Williamson Citation2011).
Limitations
Outmigration estimates are only as robust as the inputs from the sequential migrant stock tables produced by the UN. These estimates, largely based on censuses or other demographic surveillance programmes, may vary in comprehensiveness and quality, especially across Africa and the Middle East. Movement of refugees is included in estimates of outmigration only where refugee populations are taken into account in the UN stock data (i.e. in countries where specific refugee statistics are collected). While subject to these limitations, this database of outmigration provides the highest-quality direct estimates currently available and represents a marked improvement relative to previous data. Past analyses attempting to estimate how population growth or economic trends are related to total outmigration have either used indirect estimates of net migration across LMICs or been based on a limited subset of wealthy Organisation for Economic Co-operation and Development countries. In addition, outmigration estimates are calibrated to be consistent with the indirect net migration estimates produced by the UN (WPP2019; United Nations Population Division Citation2019), which, while impossible to split into in- and outmigration, are based on residual estimates derived from more reliable mortality and fertility data.
Although we included a diverse set of control covariates for predicting national shifts in outmigration, some factors are difficult to measure. We used GDPpc as a proxy for broad economic development and for the population rebalancing associated with the push–pull of economic opportunity (Ravenstein Citation1885). GDPpc, however, may not be a proper substitute for real wage estimates across specific labour sectors. The International Labour Organization compiles real wage estimates for all countries based on statistics from national labour agencies, but beyond high-income countries these statistics are largely incomplete or incomparable (International Labour Organization Citation2018). Cycles of migrant departure, settlement, and return are motivated by social networks that may explain otherwise weak correlations in international migration between high- and low-wage countries (Massey et al. Citation1993). These bilateral variables, such as historical colonial connections, were not included in our analysis because the goals of the present study were to clarify the association between population growth in the young adult population and trends in outmigration across all LMICs and to analyse how this correlation relates to economic growth. The omission of more specific social ties between countries may bias this estimated relationship.
The counterfactual comparison in Equationequation (4)(4)
(4) may be interpreted causally only under the assumption that there is no model misspecification and no unmeasured confounding. The issue of endogeneity is particularly relevant for examining the relationship between population and migration, as there is a direct dependence. We do not presume to have overcome these obstacles fully to produce a causal estimate in our analysis, although we attempted to effectively minimize the risk of confounding by including a diverse set of previously identified time-varying confounders and origin and destination fixed effects to account for time-invariant confounding. The comparison illustrated in Equationequation (4)
(4)
(4) was provided primarily as another view of our estimated model—in absolute terms—which may be more intuitive and relevant for policy.
Last, our analysis focused on the implications of the growth in young adult populations in origin countries and its relationship with outmigration. Alternatively, these same bilateral data could be used to focus on destination-country characteristics of the age structure associated with total in-migrants. We controlled for the most important of these established macro pull factors (e.g. the gap in GDPpc), but future analyses could focus on whether migration is more likely to occur to countries with smaller proportions of their populations in working ages; this might suggest that potential migrants are aware and react to this potential need in the labour market. It may also be useful to study the relationship between outmigration and the origin country’s population age structure, as outmigration itself will shrink the origin country’s population to some degree, and this relationship might be another useful facet in understanding the broader connection between demographic transition and migration in low-income nations. Finally, the relationship observed in this paper between the growth in young adult populations in origin countries and outmigration might extend to internal migration as well, but that question was beyond the scope of our analysis and is difficult to assess, given the limited international data available on internal migration (Zelinsky Citation1971; Bernard and Perales Citation2021).
Implications for policy
It is too soon to grasp how the coronavirus pandemic will affect the association between young adult population growth and outmigration in low- and lower-middle-income nations. Circumstances may well change, but so far, Covid-19 has disproportionately killed people aged over 70 and been less dangerous to children and young adults. Childhood immunizations for diseases other than Covid-19 have fallen globally, but more modestly than many had feared (Bill & Melinda Gates Foundation Goalkeepers Citation2021). The coronavirus pandemic has already had deep economic consequences for low-income nations, with the International Monetary Fund describing the labour market prospects for low-skilled workers and young adults in these countries as ‘bleak compared with those for other demographic groups’ (International Monetary Fund Citation2021, p. 7). While almost every child globally has been affected by the pandemic, children in many of the poorest countries have missed out on significant proportions of their expected lifetime education due to school closures and lockdowns (Evans et al. Citation2021).
If fertility remains high in most sub-Saharan African nations, our analysis suggests that the demographic forces spurring outmigration from that region are likely to expand in the coming decades, assuming GDPpc and youth unemployment trends continue. Since 2015, child mortality has fallen rapidly (Burstein 2019) in many of the same low-income countries (e.g. Ethiopia, Liberia, and Niger) that are already seeing significant growth in their young adult populations. In 2018, there were 217 million young adults aged 15–24 living in Africa; this number is expected to increase by 30 per cent by 2030 and to double by 2055 (United Nations Population Division Citation2015).
Programmes that promote girls’ education and voluntary family planning may reduce the volume and duration of outmigration resulting from young adult population growth in poor nations, but such programmes are unlikely to alter the trajectory of this demographically driven outmigration significantly in the near term (Bloom et al. Citation2009; Bhattacharya and Chakraborty Citation2014; Williamson Citation2015; United Nations Population Division Citation2015). Projected young adult population growth in Africa remains high even under the UN’s low-fertility scenarios (United Nations Population Division Citation2019). While the rate of refugees (individuals forced to emigrate due to persecution, conflict, or violence) leaving Africa has declined since 1990 and, before the pandemic, refugees represented only 10 per cent of the outmigrants leaving the region, rates of forced displacement may be poised to rise (Gonzalez-Garcia et al. Citation2016). Most of the countries leading the indices of fragile states are in sub-Saharan Africa, and conflict in those states may increase outmigration (The Fund for Peace Citation2018). Additionally, climate change is increasing the risk of natural disasters and conflict, as well as reducing the availability of arable land in the region at the same time that the young adult population is growing (Kumssa and Jones Citation2010; Abel et al. Citation2019).
Increased migration from poorer nations, especially from sub-Saharan Africa, has occurred alongside increased hostility and social unrest in the European Union (EU) and the US. Despite growing unease with immigration, many EU and US policymakers have failed to examine and understand the drivers of that migration and their implications. For wealthy destination countries, the average tightening of entry laws reduced immigration by about 6 per cent between 1980 and 2006 (Ortega and Peri Citation2013). During the coronavirus pandemic, nearly every nation imposed travel and entry restrictions, and the crisis spurred a rise in anti-immigrant sentiment in some countries (Gamlen Citation2020; Martin and Bergmann Citation2021). These entry restrictions may not be sufficient to reduce the sizable migration expected to occur and may perpetuate irregular migration, which occurs outside the laws of the destination state. For example, 22,654 migrants have died crossing the Mediterranean Sea since the beginning of 2014, in an attempt to reach Europe (International Organization for Migration Citation2021). Likewise, our results suggest that the adoption of protectionist trade measures by wealthy nations may lower both economic growth and low-skilled youth employment in manufacturing in poorer nations, thereby increasing the pressure for outmigration in LMICs (Bollyky Citation2018).
With outmigration flows from sub-Saharan Africa likely to increase substantially, there is a need for policies in origin and destination nations to facilitate positive outcomes from that migration. Designing and adopting strategies to expedite the integration of migrants into the workforce has helped destination countries to harness the positive economic contribution of that young and healthy adult labour force and to fill labour shortages not being addressed by existing workers, reducing dislocation and social unrest (Peri Citation2012; Jaumotte, Koloskova, and Saxena Citation2016; Clemens et al. Citation2018). The 2018 Global Compact for Safe, Regular, and Orderly (United Nations Citation2018) Migration advocated the use of global skill partnerships, which train people in skills needed in both origin and destination countries and put those who successfully complete training into contact with employers in both countries. Such programmes have been implemented as pilot projects (e.g. an ICT training partnership between Belgium and Morocco), and their broader use has been advocated as a means to address growing youth unemployment in Africa. Documented and integrated migrant workers can provide a needed source of long-term or temporary labour and tax revenues in destination countries, particularly for the many with ageing populations, low fertility, and shrinking labour forces (Liebig and Mo Citation2013; Aiyar et al. Citation2016).
With policies that promote access to financial services and investment, outmigration can also benefit origin nations. Previous studies have shown that remittances and knowledge transfer from outmigrants back to their home countries can improve nutrition, education, and investment in human capital (Adams and Page Citation2005; Carletto et al. Citation2021; Dustmann and Glitz Citation2011; Ambler, Aycinena, and Yang Citation2015; Clemens and Tiongson Citation2017). Remittances are already an important source of foreign exchange and income for sub-Saharan African countries, officially representing 2.8 per cent of GDP in the region in 2018 (World Bank Citation2018).
Geographically, the effect of young adult population growth is most manifest in sub-Saharan Africa and South Asia, where global health investments have sharply reduced child mortality (Burstein 2017; GBD Citation2017 Causes of Death Collaborators Citation2018; Dieleman et al. Citation2019). Those global health investments should be sustained and integrated into a development strategy that recognizes that surviving children grow up to become adults (Bollyky Citation2018). International development aid programmes, on their own, have not been shown to improve the economic growth of destination nations significantly, but targeted investments in quality education and health can help to increase the productivity of rising young workers (Dieleman et al. Citation2019; Clist and Restelli Citation2021). Context-specific approaches (e.g. wage subsidies and apprenticeships) that reduce the barriers to skills development might help to increase youth employment and reduce rates of demographically driven migration (Clemens and Postel Citation2018; World Bank Citation2019). Furthermore, by reducing unwanted pregnancies, voluntary family planning provision enables more women to participate in the labour force and allows for greater investment in the health and education of children that parents choose to have (Becker and Lewis Citation1973; Bloom et al. Citation2009; Strulik Citation2017). Our results suggest that without this broader social and economic development, the young adult beneficiaries of improved global health are looking for opportunities elsewhere.
Rather than being seen as strictly a response to hardship, migration driven by young adult population growth can also be a catalyst for a better future at home and abroad. In the near term, a viable legal pathway for immigration and policies to channel migrants towards labour shortages should increase the benefits of outmigration for both origin and destination nations and reduce pressure for irregular migration. Over the longer term, less restrictive trade policies and greater investment in family planning, educational quality, and youth employment should help lower-income countries to harness the enormous potential economic benefits of a growing young adult population.
Supplementary Material
Download PDF (701 KB)Disclosure statement
No potential conflict of interest was reported by the authors.
Notes
1 The first two authors (Thomas J. Bollyky and Nick Graetz) contributed equally to the paper. Thomas J. Bollyky conceptualized this paper and its policy implications and co-authored the manuscript. Nick Graetz performed the quantitative analyses and co-authored the manuscript. Joseph Dieleman, Michel Guillot, and Simon I. Hay consulted on the methods. Diana Shoder and Sean Joyce contributed to the background research, figures, and editing. Molly K. Miller-Petrie and Simon I. Hay consulted on the writing of the manuscript. We thank Nicole Weaver for her assistance with this paper.
2 Please direct all correspondence to Thomas J. Bollyky, Senior fellow for global health, economics, and development, and Director of the global health programme, Council on Foreign Relations, 1777 F Street NW, Washington, DC, 20006, USA; or by Email: [email protected]
3 Thomas J. Bollyky and D. Schoder are based at the Council on Foreign Relations (USA). Nick Graetz is based at the Population Studies Center, University of Pennsylvania, and also the Institute for Health Metrics and Evaluation, University of Washington. Michel Guillot is based at the Population Studies Center, University of Pennsylvania. Molly K. Miller-Petrie is based at the Institute for Health Metrics and Evaluation, University of Washington. Joseph Dieleman and Simon I. Hay are both based at the Institute for Health Metrics and Evaluation and also the Department of Health Metrics Sciences, School of Medicine, both at the University of Washington. Sean Joyce is based at the University of California.
4 Funding: We would like to thank the generous support of Bloomberg Philanthropies. Simon I. Hay and Molly K. Miller-Petrie also acknowledge funding from The Bill & Melinda Gates Foundation, outside the submitted work. Nick Graetz was supported by the Eunice Kennedy Shriver National Institute of Child Health and Human Development (T32-HD-007242-36A1). The authors declare no competing interests.
5 Data and materials availability: Our study follows the Guidelines for Accurate and Transparent Health Estimates Reporting (supplementary material, section 1). All code used for these analyses is publicly available online on Github. The findings of this study are supported by data available in public online repositories as follows. WPP2019: https://population.un.org/wpp2019/Download/Standard/Population/ and IHME data: http://www.healthdata.org/results/data-visualizations.
References
- Abel, Guy J. and Joel E. Cohen. 2019. Bilateral international migration flow estimates for 200 countries, Scientific Data 6(82): 1–12. https://doi.org/https://doi.org/10.1038/s41597-019-0089-3
- Abel, Guy J., Michael Brottrager, Jesus Crespo Cuaresma, and Raya Muttarak. 2019. Climate, conflict, and forced migration, Global Environmental Change 54: 239–249. https://doi.org/https://doi.org/10.1016/j.gloenvcha.2018.12.003
- Adams, Richard H., Jr. and John Page. 2005. Do international migration and remittances reduce poverty in developing countries?, World Development 33(1): 1645–1669. https://doi.org/https://doi.org/10.1016/j.worlddev.2005.05.004
- Aiyar, Shekhar, Bergljot Barkbu, Nicoletta Batini, Helge Berger, Enrica Detragiache, Allan Dizioli, Christian Ebeke, et al. 2016. The Refugee Surge in Europe: Economic Challenges. Discussion Note, International Monetary Fund.
- Ambler, Kate, Diego Aycinena, and Dean Yang. 2015. Channeling remittances to education: A field experiment among migrants from El Salvador, American Economic Journal: Applied Economics 7(2): 207–232. https://doi.org/https://doi.org/10.1257/app.20140010
- Azose, Jonathan J. and Adrian E. Raftery. 2018. Estimating large correlation matrices for international migration, The Annals of Applied Statistics 12(2): 940–970. https://doi.org/https://doi.org/10.1214/18-aoas1175
- Becker, Gary S. and H. Gregg Lewis. 1973. On the interaction between the quantity and quality of children, Journal of Political Economy 81(2): S279–S288. https://doi.org/https://doi.org/10.1086/260166
- Beine, Michel, Simone Bertoli, and Jesús Fernández-Huertas Moraga. 2016. A practitioner’s guide to gravity models of international migration, The World Economy 39(4): 496–512. https://doi.org/https://doi.org/10.1111/twec.12265
- Bernard, Aude and Francisco Perales. 2021. Linking internal and international migration in 13 European countries: Complementarity or substitution?, Journal of Ethnic and Migration Studies, 1–21. https://doi.org/https://doi.org/10.1080/1369183X.2020.1868983
- Bhattacharya, Joydeep and Shankha Chakraborty. 2014. Contraception and the fertility transition. Working Paper, SSRN. Available: https://doi.org/https://doi.org/10.2139/ssrn.2385309
- Bill & Melinda Gates Foundation Goalkeepers. 2021. Innovation and Inequity 2021 Report. Seattle: Bill & Melinda Gates Foundation.
- Bloom, David E., David Canning, and Jaypee Sevilla. 2001. Economic Growth and the Demographic Transition. Working Paper 8685, National Bureau of Economic Research.
- Bloom, David E., David Canning, and Jocelyn E. Finlay. 2010. Population aging and economic growth in Asia, in Takatoshi Ito and Andrew Rose (eds), The Economic Consequences of Demographic Change in East Asia (NBER-EASE Volume 19). Chicago: University of Chicago Press, pp. 61–89.
- Bloom, David E., David Canning, Günther Fink, and Jocelyn E. Finlay. 2009. Fertility, female labor force participation, and the demographic dividend, Journal of Economic Growth 14: 79–101. https://doi.org/https://doi.org/10.1007/s10887-009-9039-9
- Bollyky, Thomas J. 2018. Plagues and the Paradox of Progress: Why the World is Getting Healthier in Worrisome Ways. Cambridge: MIT University Press.
- Bongaarts, John. 2017. Africa’s unique fertility transition, Population and Development Review 43(1): 39–58. https://doi.org/https://doi.org/10.1111/j.1728-4457.2016.00164.x
- Boyd, Robert. 2002. A “migration of despair”: Unemployment, the search for work, and migration to farms during the Great Depression, Social Science Quarterly 83: 554–567. https://doi.org/https://doi.org/10.1111/1540-6237.00100
- Burstein, Roy, Nathaniel J. Henry, Michael L. Collison, Laurie B. Marczak, Amber Sligar, Stefanie Watson, Neal Marquez, et al. 2019. Mapping 123 million neonatal, infant and child deaths between 2000 and 2017, Nature 574: 353–358. https://doi.org/https://doi.org/10.1038/s41586-019-1545-0
- Carletto, Calogero, John A. Maluccio, Savant Man Shrestha, and Mackenzie F. Stewart. 2021. Migration, economic crisis and child growth in rural Guatemala: Insights from the Great Recession, Food Policy 104: 16–27. https://doi.org/https://doi.org/10.1016/j.foodpol.2021.102145
- Center for Systemic Peace. 2019. Polity5 Project, Political Regime Characteristics and Transitions, 1800-2017. http://www.systemicpeace.org/inscrdata.html.
- Clemens, Michael. 2014. Does Development Reduce Migration? Working Paper 359, Center for Global Development.
- Clemens, Michael A. and Hannah M. Postel. 2018. Deterring emigration with foreign aid: An overview of evidence from low-income countries, Population and Development Review 44(4): 667–693. https://doi.org/https://doi.org/10.1111/padr.12184
- Clemens, Michael, Cindy Huang, Jimmy Graham, and Kate Gough. 2018. Migration Is What You Make It: Seven Policy Decisions That Turned Challenges into Opportunities. Washington, DC: Center for Global Development.
- Clemens, Michael A. and Erwin R. Tiongson. 2017. Split decisions: Household finance when a policy discontinuity allocates overseas work, The Review of Economics and Statistics 99(3): 531–543. https://doi.org/https://doi.org/10.1162/REST_a_00657
- Clist, Paul, and Gabriele Restelli. 2021. Development aid and international migration to Italy: Does aid reduce irregular flows?, The World Economy 44(5): 1281–1311. https://doi.org/https://doi.org/10.1111/twec.13017
- Cuaresma, Jesus Crespo, Mathias Moser, and Anna Raggl. 2013. On the Determinants of Global Bilateral Migration Flows. Working Paper 5, WWWforEurope. Available: https://ideas.repec.org/b/wfo/wstudy/46849.html.
- Deaton, Angus. 2013. The Great Escape: Health, Wealth, and the Origins of Inequality. Princeton, NJ: Princeton University Press.
- Dieleman, Joseph L., Krycia Cowling, Irene A. Agyepong, Sarah Alkenbrack, Thomas J. Bollyky, Jesse B. Bump, Catherine S. Chen, et al. 2019. The G20 and development assistance for health: Historical trends and crucial questions to inform a new era, The Lancet 394: 173–183. https://doi.org/https://doi.org/10.1016/S0140-6736(19)31333-9
- Dustmann, Christian, and Albrecht Glitz. 2011. Migration and Education. Discussion Paper, Norface Migration, https://econpapers.repec.org/paper/norwpaper/2011011.htm.
- Easterlin, Richard A. 1961. Influences in European overseas emigration before World War I, Economic Development and Cultural Change 9(3): 331–351. https://doi.org/https://doi.org/10.1086/449911
- Evans, David, Susannah Hares, Amina Mendez Acosta, and Christelle Saintis. 2021. It’s been a year since schools started to close due to COVID-19. Center for Global Development. Available: https://www.cgdev.org/blog/its-been-year-schools-started-close-due-covid-19 (accessed: 24 September 2021).
- Flahaux, Marie-Laurence, and Hein De Haas. 2016. African migration: Trends, patterns, drivers, Comparative Migration Studies 4: 1–25. https://doi.org/https://doi.org/10.1186/s40878-015-0015-6
- Gamlen, Alan. 2020. Migration and Mobility after the 2020 Pandemic: The End of an Age? Working Paper 146, Centre on Migration, Policy, and Society, University of Oxford.
- Gamso, Jonas, and Farhod Yuldashev. 2018. Does rural development aid reduce international migration?, World Development 110: 268–282. https://doi.org/https://doi.org/10.1016/j.worlddev.2018.05.035
- GBD 2017 Causes of Death Collaborators. 2018. Global, regional, and national age-sex-specific mortality for 282 causes of death in 195 countries and territories, 1980-2017: A systematic analysis for the Global Burden of Disease Study 2017, The Lancet 392(10159): 1736–1788. https://doi.org/https://doi.org/10.1016/S0140-6736(18)32203-7
- Gonzalez-Garcia, Jesus R., Ermal Hitaj, Montfort Mlachila, Arina Viseth, and Mustafa Yenice. 2016. Sub-Saharan African migration, patterns and spillovers, Spillover Notes 9: 1–16. https://doi.org/https://doi.org/10.5089/9781475546668.062.A001
- Hanson, Gordon H. and Craig McIntosh. 2010. The Great Mexican Emigration, Review of Economics and Statistics 92(4): 798–810. https://doi.org/https://doi.org/10.1162/REST_a_00031
- Hanson, Gordon H. and Craig McIntosh. 2012. Birth rates and border crossings: Latin American migration to the US, Canada, Spain and the UK, The Economic Journal 122(561): 707–726. https://doi.org/https://doi.org/10.1111/j.1468-0297.2012.02509.x
- Hanson, Gordon H. and Craig McIntosh. 2016. Is the Mediterranean the new Rio Grande? US and EU immigration pressures in the long run, Journal of Economic Perspectives 30(4): 57–82. https://doi.org/https://doi.org/10.1257/jep.30.4.57
- Hatton, Timothy and Jeffrey G. Williamson. 1994. What drove the mass migrations from Europe in the late nineteenth century?, Population and Development Review 20(3): 533–559. https://doi.org/https://doi.org/10.2307/2137600
- Hatton, Timothy J. and Jeffrey Williamson. 2003. Demographic and economic pressure on emigration out of Africa, The Scandinavian Journal of Economics 105(3): 465–486. https://doi.org/https://doi.org/10.1111/1467-9442.t01-2-00008
- Hatton, Timothy J. and Jeffrey G. Williamson. 2011. Are third world emigration forces abating?, World Development 39: 20–32. https://doi.org/https://doi.org/10.1016/j.worlddev.2010.05.006
- Headey, Derek D. and Andrew Hodge. 2009. The effect of population growth on economic growth: A meta-regression analysis of the macroeconomic literature, Population and Development Review 35(2): 221–248. https://doi.org/https://doi.org/10.1111/j.1728-4457.2009.00274.x
- Howse, Kenneth. 2015. What is fertility stalling and why does it matter?, Population Horizons 12(1): 13–23. https://doi.org/https://doi.org/10.1515/pophzn-2015-0003
- Integrated Network for Societal Conflict Research. 2017. Polity IV annual time-series, 1800-2017, Center for Systemic Peace. Available: http://www.systemicpeace.org/inscrdata.html.
- International Labour Organization. 2018. ILOSTAT. Available: https://www.ilo.org/global/statistics-and-databases/lang–en/index.htm.
- International Monetary Fund. 2021. World Economic Outlook Update: Fault Lines Widen in the Global Recovery. Washington, DC: International Monetary Fund.
- International Organization for Migration. 2021. Missing Migrants Project. Available: https://missingmigrants.iom.int/region/mediterranean (accessed: 24 September 2020).
- James, Spencer L., Paul Gubbins, Christopher J. L. Murray, and Emmanuela Gakidou. 2012. Developing a comprehensive time series of GDP per capita for 210 countries from 1950 to 2015, Population Health Metrics 10: 1–12. https://doi.org/https://doi.org/10.1186/1478-7954-10-1
- Jaumotte, Florence, Ksenia Koloskova, and Sweta Chaman Saxena. 2016. Impact of migration on income levels in advanced economies, Spillover Notes 8: 1–21. https://doi.org/https://doi.org/10.5089/9781475545913.062.A001
- Kirk, Dudley. 1996. Demographic transition theory, Population Studies 50(3): 361–387. https://doi.org/https://doi.org/10.1080/0032472031000149536
- Kumssa, Asfaw, and John F. Jones. 2010. Climate change and human security in Africa, International Journal of Sustainable Development & World Ecology 17(6): 453–461. https://doi.org/https://doi.org/10.1080/13504509.2010.520453
- Lam, David. 2011. How the world survived the population bomb: Lessons from 50 years of extraordinary demographic history, Demography 48(4): 1231–1262. https://doi.org/https://doi.org/10.1007/s13524-011-0070-z
- Lee, Robert. 2003. The demographic transition: Three centuries of fundamental change, Journal of Economic Perspectives 17(4): 167–190. https://doi.org/https://doi.org/10.1257/089533003772034943
- Lewer, Joshua J., and Hendrik Van den Berg. 2008. A gravity model of immigration, Economics Letters 99(1): 164–167. https://doi.org/https://doi.org/10.1016/j.econlet.2007.06.019
- Liebig, Thomas, and Jeffery Mo. 2013. The fiscal impact of immigration in OECD countries, in OECD (ed), International Migration Outlook. Paris: OECD Publishing, pp. 125–189.
- Llull, Joan. 2016. Understanding international migration: Evidence from a new dataset of bilateral stocks (1960–2000), SERIES 7: 221–255. https://doi.org/https://doi.org/10.1007/s13209-016-0138-5
- Martin, Susan and Jonas Bergmann. 2021. (Im)mobility in the age of COVID-19, International Migration Review 55(3): 660–687. https://doi.org/https://doi.org/10.1177/0197918320984104
- Massey, Douglas S. 1988. Economic development and international migration in comparative perspective, Population and Development Review 14(3): 383–413. https://doi.org/https://doi.org/10.2307/1972195
- Massey, Douglas S., Joaquin Arango, Graeme Hugo, Ali Kouaouci, Adela Pellegrino, and J. Edward Taylor. 1993. Theories of international migration: A review and appraisal, Population and Development Review 19(3): 431–466. https://doi.org/https://doi.org/10.2307/2938462
- Mayda, Anna Maria. 2010. International migration: A panel data analysis of the determinants of bilateral flows, Journal of Population Economics 23: 1249–1274. https://doi.org/https://doi.org/10.1007/s00148-009-0251-x
- Murray, Christopher J. L., Majid Ezzati, Abraham D. Flaxman, Stephen Lim, Rafael Lozano, Catherine Michaud, Mohsen Naghavi, et al. 2012. GBD 2010: Design, definitions, and metrics, The Lancet 380(9859): 2063–2066. https://doi.org/https://doi.org/10.1016/S0140-6736(12)61899-6
- Ortega, Francesc and Giovanni Peri. 2013. The effect of income and immigration policies on international migration, Migration Studies 1(1): 47–74. https://doi.org/https://doi.org/10.1093/migration/mns004
- Peri, Giovanni. 2012. The effect of immigration on productivity: Evidence from U.S. states, Review of Economics and Statistics 94(1): 348–358. https://doi.org/https://doi.org/10.1162/REST_a_00137
- Ramos, Raul and Jordi Suriñach. 2017. A gravity model of migration between the ENC and the EU, Tijdschrift voor economische en sociale geografie 108: 21–35. https://doi.org/https://doi.org/10.1111/tesg.12195
- Ravenstein, Ernest George. 1885. The laws of migration, Journal of the Statistical Society of London 48: 167–235. https://doi.org/https://doi.org/10.2307/2979181
- Salinari, G. and Gustavo De Santis. 2013. Population growth and migration in Northern and Western Africa, Genus 69(1): 61–81.
- Sander, Nikola and Elin Charles-Edwards. 2017. Internal and international migration, in Hans Groth and John F. May (eds), Africa’s Population: In Search of a Demographic. New York: Springer, pp. 333–349.
- Stevens, G. A., L. Alkema, R. E. Black, J. T. Boerma, G. S. Collins, M. Ezzati, J. T. Grove, et al. (The GATHER Working Group). 2016. Guidelines for accurate and transparent health estimates reporting: The GATHER statement, The Lancet 388(10062): e19–e23. https://doi.org/https://doi.org/10.1016/S0140-6736(16)30388-9
- Strulik, Holger. 2017. Contraception and development: A unified growth theory, International Economic Review 58(2): 561–584. https://doi.org/https://doi.org/10.1111/iere.12227
- The Fund for Peace. 2018. Fragile State Index. Available at: https://fragilestatesindex.org/excel/.
- United Nations Population Division. 2015. Youth population trends and sustainable development. Available: http://www.un.org/en/development/desa/population/publications/pdf/popfacts/PopFacts_2015-1.pdf.
- United Nations. 2018. UN Global Compact for Migration. New York: United Nations. para. 33(e).
- United Nations Population Division. 2018. 2018 Revision of World Urbanization Prospects. Available: https://population.un.org/wup/.
- United Nations Population Division. 2019. World Population Prospects 2019. Available: https://population.un.org/wpp/Download/Standard/Population/.
- Van Hear, Nicholas, Oliver Bakewell, and Katy Long. 2018. Push-pull plus: Reconsidering the drivers of migration, Journal of Ethnic and Migration Studies 44(6): 927–944. https://doi.org/https://doi.org/10.1080/1369183X.2017.1384135
- Wesselbaum, Dennis and Amelia Aburn. 2019. Gone with the wind: International migration, Global and Planetary Change 178: 96–109. https://doi.org/https://doi.org/10.1016/j.gloplacha.2019.04.008
- Williamson, Jeffrey G. 2015. World migration in historical perspective: Four big issues, in Barry R. Chiswick and Paul W. Miller (eds), Handbook of the Economics of International Migration. Amsterdam: Elsevier, North Holland, pp. 89–101.
- World Bank. 2018. World Development Indicators 2018. Available: http://datatopics.worldbank.org/world-development-indicators/wdi-archives.html.
- World Bank. 2019. World Development Report 2019: The Changing Nature of Work. Washington, DC: World Bank Group.
- World Bank. 2020. World Bank Country and Lending Groups. Available: https://datahelpdesk.worldbank.org/knowledgebase/articles/906519-world-bank-country-and-lending-groups.
- Zelinsky, Wilbur. 1971. The hypothesis of the mobility transition, Geographical Review 61(2): 219–249. https://doi.org/https://doi.org/10.2307/213996
- Zlotnik, Hania. 2004. Population growth and international migration, in Douglas S. Massey and J. Edward Taylor (eds), International Migration: Prospects and Policies in a Global Market. Oxford University Press, pp. 15–34.