
Abstract
This study uses income accumulated over ages 20–60 to examine whether richer or poorer individuals have more children. Income histories are calculated using yearly administrative register data from contemporary Sweden for cohorts born 1940–70. Differences by parity and income distribution are examined separately by sex. There is a strong positive gradient between accumulated disposable income (and to a lesser extent earnings) and fertility for men in all cohorts and a gradual transformation from a negative to a positive gradient for women. In particular, accumulated incomes are substantially lower for childless men and women than those with children. For men, fertility increases monotonically with increasing income, whereas for women much of the positive gradient results from low fertility among women with very low accumulated incomes in later cohorts. Most of the positive income–fertility gradient can be explained by the high incomes of men and women with two to four children.
Introduction
The relationship between income and fertility is a classical topic in demography. The pioneers of social science in the nineteenth century, such as Francis Galton and Karl Pearson, were interested in the gradient between income and fertility, and throughout the twentieth century the topic was of continuing interest for social scientists. The relationship was also central to the theorizing on the relationship between the economy and population growth done by classical economists and demographers, such as Thomas Malthus and David Ricardo, and has, since the 1960s, once again become a major topic in labour economics (e.g. Becker Citation1991). Throughout the twentieth century and until today, sociologists and demographers have continued to examine empirically how fertility is related to various dimensions of social status (see e.g. Skirbekk Citation2008). To understand why we observe an income gradient, two questions are central and have guided previous research on the topic:
How does income affect childbearing?
How does having children affect income?
In this study, I examine the net outcome of these two relationships by examining the relationship between fertility and accumulated income. I also assess the overall bivariate association between fertility and accumulated income at different ages. The goal of the study is to answer the following research question:
How is accumulated income associated with fertility over the life course for men and women, and how has this changed over time?
The study provides an answer to whether individuals with higher or lower incomes have more children over the life course, in Sweden. To my knowledge, the relationship between accumulated income and fertility has never been empirically assessed in previous studies. The research question directly addresses an important unresolved issue in the social sciences, often referred to as the extent of differential fertility or the income gradient of childbearing.
I use longitudinal Swedish register data containing over 44 years of annual income histories to relate accumulated income over the life course to fertility outcomes at ages 20–60. Accumulated income over the life course is an ideal measure for assessing whether richer or poorer individuals have more or fewer children, as it accurately captures different wage trajectories, reduced formal labour participation following childbearing, and income penalties related to childbearing. I focus on differences between men and women and how these differences have changed over time, which is important given changes in women’s labour force participation over the study period. The longitudinal scope and life-course measurements provide several advantages over earlier research on the topic. The study offers evidence of a mostly positive association between fertility and income, which has grown stronger over time and is due mostly to higher incomes among men and women with two to four children and lower incomes among those with no children or one child.
I first summarize previous theorizing on the two-way relationship between childbearing and fertility. Much of this research has been motivated by the puzzle of an empirical negative income–fertility gradient, and various explanations have been suggested as to why higher income may lead to lower fertility (Jones et al. Citation2010). After discussing theories on a causal two-way relationship between income and fertility, I summarize previous empirical research on this topic. I then discuss theoretical perspectives on how to measure income and how accumulated income is connected to the related concept of ‘permanent income’.
Background
Does higher income increase childbearing?
A different way to put the question of whether fertility increases with income is: Does an increase in income increase the ‘consumption’ of children? In general, more income and wealth lead to greater possibilities for meeting the demands and desires related to most aspects of life. The question can then be posed as to whether children are a ‘normal good’ (where income increases consumption, to apply the terminology of economics). Because children are both very desirable for most people and very costly, in material resources as well as time, this is an intuitive assumption. If these two requirements are met (as they arguably are for children), we would then expect the demand for quality (e.g. education) and quantity to increase with income, and richer individuals would be expected to have more children. Classical demographic theory, such as that presented in Thomas Malthus’s writing on population (Malthus Citation1798), assumes that childbearing will increase with increasing income and resources. In historical societies and in less developed societies, the evidence for such a relationship is robust (Lee Citation1987; Galloway Citation1988; Skirbekk Citation2008). In all societies, the financial costs of children for families are very substantial, and in high-income contexts children provide few resources for their parents. For dual-earner couples, these costs are particularly large in countries with non-subsidized preschool childcare, whereas for couples where one partner is the primary breadwinner, there is instead a major ‘opportunity cost’ of children (the lost income of the caregiver).
While the theoretical arguments suggesting that children are like a normal good are strong (as are those that richer parents should be able to afford more and ‘higher-quality’ children), industrial societies in the twentieth century have instead shown the reverse pattern. In most twentieth-century populations, it has repeatedly been shown that income, and to an even greater extent education, is negatively related to completed parity for both men and women (e.g. Jones and Tertilt Citation2008; Skirbekk Citation2008). Based on such evidence, economists (most famously Gary Becker) have instead theorized that because children are very time intensive and time is fixed for all parents (and assumed to be non-substitutable, unlike for most other goods), the relative costs of children increase with income (Becker and Lewis Citation1974; Becker Citation1991). In essence, the argument is based on the idea that much of the investment in children consists of parental time, which is fixed for all parents. Higher-income parents will therefore have a higher relative demand for leisure and other goods than poorer parents, who will have a relative abundance of time. The ‘shadow cost’ of childbearing is therefore higher for higher-income individuals. The relative cost of children will be lower for lower-income parents and, consequently, these parents will have more children. There are many variations on this argument (see Jones et al. Citation2010 for an excellent summary). In general, a large number of assumptions must be met for this argument to be true (Jones et al. Citation2010): most importantly that children require time investments that are not easily substitutable (i.e. employed non-parent caregivers cannot replace parent caregivers) and that there is a strong elasticity of substitution between leisure and childrearing (i.e. individuals must choose between them).
Does childbearing affect income?
It is also possible that having children will influence income over the life course. This would be the second part of the two-way relationship that contributes to the overall relationship between accumulated income and fertility. It is clear that having children is labour intensive and, as such, competes with wage labour. Even with public or private childcare during workdays, having children competes with time in paid labour (because taking care of children takes time), and if cultural norms dictate that parents (or wives) should stay at home to take care of children, such effects will have a dramatic effect on combined household income. In all societies, parents stay outside the labour market at least briefly, and even if the government subsidizes parental leave, this period will reduce income and disrupt careers. Sociologists and economists have focused a great deal on ‘fatherhood premiums’ and ‘motherhood penalties’ in the labour market, as employees may change their behaviour after parenthood and employers may treat employees differently (Budig and England Citation2001; Sigle-Rushton and Waldfogel Citation2007). It seems clear, based on empirical evidence, that there is a negative effect of having a child, both on women’s labour supply and on their wages after the birth (Budig and England Citation2001). Many of the structural factors related to combining work and childbearing (both in how the labour market is organized and in cultural norms that discourage mothers’ labour force participation in some societies) can be viewed as negative effects of having children on income. Overall, such factors have caused a primarily negative relationship between yearly earnings and childbearing for women. In Sweden, these factors have gradually diminished in importance over the twentieth century, though certainly not disappeared (Stanfors and Goldscheider Citation2017).
Fertility, income, preferences, and selection
It is also possible that fertility is different among high and low income earners for other reasons. Groups may differ in their desire (or ‘taste’, in economics terminology) for children (e.g. for cultural, family background, religious reasons), and these groups may also differ in income. In such cases, we might observe a relationship between income and fertility when such individual- or group-level traits are not taken into account, but once such factors are adjusted for, there could be either a positive or negative relationship between fertility and income (based on the researcher’s view of the underlying relationship). One example might be that among recent immigrants, fertility tends to be high and incomes tend to be low, which can create a spurious relationship between income and fertility. Such arguments have been used to explain the observed negative empirical relationship between income and fertility for both men and women in the twentieth century (Easterlin Citation1969; Borg Citation1989; Jones et al. Citation2010). According to such theories, the underlying relationship between fertility and income is positive, and negative empirical observations are due to a missing variable problem, which could in theory be adjusted for. For example, in 1960 Becker theorized that it was differences in knowledge and access to contraception that explained the negative gradient in the United States (US), although the underlying demand for children was as for a normal good. Most previous theorizing has been based on the assumption that childbearing decisions are planned by parents and driven primarily by rational calculations and stable preferences (see Blake Citation1968). This is a reasonable perspective on Swedish reproductive behaviour during the period under study—when cohort fertility was stable, and abortion and most contraceptives were available largely without constraints from the mid-1960s onwards—but might be less valid in other time periods and contexts.
It is important to stress that the association between life-course income and fertility may vary across time, space, and context. This may be because rational calculations are context dependent across different societies or because cultural preferences change over time. The goal of the current study is to determine empirically the overall income–fertility gradient in Sweden.
Previous empirical investigations
Overall, there is evidence of a positive association between income and fertility in low-income and historical societies: to a larger extent for number of surviving children and to a lesser extent for marital fertility (Lee Citation1987; Skirbekk Citation2008). During the fertility transition, a negative relationship started to emerge, with high-status groups being first to reduce their fertility (Livi-Bacci Citation1986; Dribe et al. Citation2014). Over the twentieth century, most richer societies have consistently shown a negative gradient between income and fertility (Jones and Tertilt Citation2008; Skirbekk Citation2008), with partial exceptions during times of rising fertility, such as the during the ‘baby boom’ in the mid-twentieth century. Most research has examined men’s income or household income, and less research has focused on the gradient between women’s income and fertility (although research on women’s labour force participation and fertility is common).
Some study designs have looked for exogenous variations in fertility to examine this relationship. Variations in child benefits seem to support the notion that an exogenous increase in child benefits is associated with higher fertility in Quebec and Israel (Milligan Citation2005; Cohen et al. Citation2013). Studies from the US over the past 50 years have provided mixed evidence for men’s and women’s income using a variety of identification strategies and theoretical models (e.g. Becker and Lewis Citation1974; Freedman and Thornton Citation1982; Borg Citation1989; Schaller Citation2016), although overall broad associations appear to be consistently and robustly negative (Jones and Tertilt Citation2008).
Compared with many other rich countries, which saw a uniform negative association between income and fertility over the twentieth century, Sweden has shown a less clear pattern. For the period around 1920, Swedish researchers (Edin and Hutchinson Citation1935) contrasted a positive household income and fertility association in urban Stockholm (although poorer rural areas still reported higher fertility) with the negative association found in other rich countries. Dribe and Smith (Citation2020) examined marital fertility by household occupational status in Southern Sweden over the twentieth century and found that higher occupational class tended to be associated with higher transition rates to higher parities, although this was less the case after adjusting for income. In the first half of the twentieth century, Sweden showed a clear negative gradient between women’s labour force participation and fertility, but this weakened from the middle of the century onwards (Sandström and Marklund Citation2019). Bernhardt (Citation1972) examined the relationship between fertility and income (measured in the 1960s) among Swedish married couples. She found no strong gradient for entry into parenthood, a slight positive gradient for having a second child, and a negative gradient for higher-order births. Overall, this translated into a slight negative gradient. However, couples in the highest income groups also had large numbers of children.
There is recent evidence of positive income–fertility associations in Scandinavia when current income is compared with the propensity to have a child the following year: particularly for men, but also for women (Andersson Citation2000; Duvander and Andersson Citation2003; Andersson and Scott Citation2008; Dribe and Stanfors Citation2010; Jalovaara and Miettinen Citation2013; Silva Citation2014). Silva (Citation2014) showed a positive relationship between income decile measured at age 50 and completed fertility at age 50 for men (for cohorts born between 1942 and 1959) and a negative gradient for women. Kolk and Barclay (Citation2021) found that fertility, education, intelligence, marriage, and accumulated income were all positively associated among Swedish men. There is also some recent evidence of a positive macro-level (country and regional) cross-sectional association between gross domestic product (GDP) or Human Development Index and fertility at high levels of development (Myrskylä et al. Citation2009; Fox et al. Citation2019). In terms of education, researchers still typically find a negative gradient between longer education and fertility (e.g. Skirbekk Citation2008; Preston and Hartnett Citation2010), but this, too, is changing in Scandinavia in recent cohorts, where gradients are positive for men and neutral for women (Jalovaara et al. Citation2019), in particular where both partners are highly educated (Dribe and Stanfors Citation2010).
There is strong support for a positive association historically between positive economic cycles and fertility, typically based on how mean salaries and grain prices have affected fertility prices (e.g. Galloway Citation1988; Lee and Anderson Citation2002; Bengtsson et al. Citation2003). Such a relationship is central in a Malthusian model of population development. There is also increasing evidence of macro-level procyclical fertility in richer countries (e.g. Sobotka et al. Citation2011). However, a negative relationship is clear when societies are examined cross-sectionally, based on the level of development (see Thornton Citation2005). From a long-term historical perspective, it is also clear that people in vastly poorer societies have had more children. Therefore, it is important to keep in mind that the theories and empirical findings on the income–fertility gradient presented here are related to the relative income distribution within a society and are likely not as relevant to absolute income and fertility over longer time spans.
Measuring income and fertility
The classical method of assessing the relationship between income and fertility has been simply to examine the bivariate association between income at a given age and current parity (see many examples in the review by Skirbekk Citation2008). In contemporary research, an increasing number of studies have instead used survival analysis models, in which longitudinal data are used to assess the relationship between conception risk and current income (at the time of risk of conception; e.g. Andersson Citation2000; Silva Citation2014). Through these two approaches, we have learned much about the association between fertility and income. However, both approaches are inconsistent with how researchers know men and women arrive at fertility decisions. Fertility choices are endogenously related to expectations of future income trajectories. There are also strong negative short-term effects of childbearing on income and labour supply, particularly for women. Therefore, it is potentially misleading when examining the relationship between fertility and income either to use income after childbearing is complete (e.g. at age 55) or to examine how current income is related to the decision to have an (additional) child. Many such considerations have been listed by Ewer and Crimmins-Gardner (Citation1978).
Contemporary research on European and US populations has often used survival analysis models with time-varying covariates to assess how labour force participation and income affect the chance of conception at various parities (e.g. Andersson Citation2000). This is clearly appropriate for studying how economic shocks affect fertility and gives a good indication of how current income is related to when parents choose to time their births. However, this approach will by necessity focus on income in early adulthood, a time when income may not be a good predictor of life-course income. It also risks mixing up the question of when is a good time to have children with the different research question of whether higher-income men and women have more or fewer children. Finally, there are endogeneity problems related to such an approach, as fertility is typically carefully planned in contemporary societies and income before birth is likely endogenous to fertility plans. For couples living in societies with income-based parental leave benefits, there are often strong incentives to maximize income before a birth. This may create a spurious positive gradient between income and fertility if the income effect is only very temporary, but such parental leave systems will also strengthen the link between income and fertility and thus contribute to a positive gradient overall. It has also been suggested that the timing of births in Sweden has been influenced by reforms affecting how parental leave benefits are linked to income before childbirth (Hoem Citation1993). By virtue of their design, such studies do not take into account the post-birth effects of childbearing on income. A different, potentially problematic aspect of using income before childbearing is that individuals with high-status occupations will experience much more dramatic income acceleration in the middle of their working careers than individuals in low-status occupations (Bhuller et al. Citation2011). Because the costs of childbearing are spread out decades after the birth of a child, individuals with steeper income growth will have much better opportunities to afford a large number of children. By mid-adulthood, most individuals have at least a rough idea of their future career and income trajectories, and it seems likely that expected life-course income will play a part in their calculation of how many children they can afford.
In economics, the concept of accumulated life-course income is closely related to that of permanent income (Friedman Citation1957). Permanent income plays a major role in economic theory and is typically conceptualized as future expected income, which is modelled based on present characteristics (e.g. sex, educational level, parental background, or occupation in early adulthood). It is only very rarely assessed or validated using retrospective empirical data. Richard Easterlin made a strong case for the value of permanent income in studying the income–fertility relationship (Easterlin Citation1969), but this call has not been answered in empirical research. Becker also suggested that a fuller treatment of income and fertility required attention to the permanent income concept (Becker Citation1960). One study (Ewer and Crimmins-Gardner Citation1978) made a serious attempt to resolve how income measured at various life stages relates to life-course income and how this affects the income–fertility relationship. The authors examined current income, expected income, and income trajectories and found that relying on the current income measure was deeply problematic for assessing the relationship between life-course income and fertility. Freedman and Thornton (Citation1982) also compared current and expected income to some extent in their assessment of the relationship between income and fertility.
Some authors have argued that expected income (which is more closely related to how permanent income is conceptualized) is a better measure than actual income. This is motivated by the notion that expectations are what matter at the time of deciding to have a child. As such, expected income might be relevant to understanding childbearing decisions, if not overall associations between fertility and accumulated income. To some extent, fertility decisions will be made on expected income rather than eventual unknown (accumulated) income. Thus, accumulated income will measure empirical fertility gradients, although it may for some individuals be less applicable for fertility decisions early in life (in particular if an individual ends up with an atypical income trajectory given their educational background). Expected income will always need to be inferred and is typically based on cross-sectional or historical data, using imputation techniques and assumptions based on, for example, current educational level (e.g. Bollen et al. Citation2007). Expected income calculated in such a way will by necessity capture typical and average trajectories and not the messy income trajectories observed in empirical populations. It is also unclear empirically if expected income based on a limited selection of observable variables (e.g. years of education), each associated with measurement error, in practice approximates individuals’ own (realistic or unrealistic) assessments of their future income. To understand observed stratification, and the macro-level consequences of such stratification, using retrospective summations of actual income is also more useful for measures of potential income. For some research questions, hypothetical income, given an alternative life course, is more relevant: for example, when assessing women’s opportunity cost of childbearing. This is not, however, the research aim of this study.
A limited number of previous studies have correlated life-course income with current income at various ages (Bjorklund Citation1993; Böhlmark and Lindquist Citation2006). They found that at all ages, current income was an imperfect predictor of life-course income but that it was highest around and after age 45. At ages 25–35 the correspondence was rather poor, which casts doubt on the usefulness of current income before childbearing in relation to future income trajectories. Such research has focused on men, but the problems when applying it women are likely much greater, as women’s labour force participation generally varies dramatically across the life course. For women, fertility is often directly and strongly related to labour force participation. It should also be noted that the association between current income and life-course income looks very different for different occupational trajectories. For assessing social mobility, it is more robust to examine life-course income than midlife income (Grätz and Kolk Citation2022).
The current study measures individual life-course trajectories. Unlike much previous research, the aim is not to measure household income. With increasing women’s labour force participation, increasing union instability, and an increasing proportion of the life course spent outside unions, an individual rather than a household perspective on life-course income becomes increasingly relevant for understanding an individual’s socio-economic position, particularly in Sweden, but also in other western societies. The concept of life-course earnings must also by necessity be an individual measure, which cannot be applied to a couple (in particular in a context of increasing age at union formation and prevalence of union dissolution). An individual-level perspective additionally provides assurance that the sample reflects the complete population and that the results are generalizable for understanding societal-level processes.
As already discussed, many issues with assessing the relationship between income and fertility can be avoided by using empirical data with accumulated income histories. In particular, this overcomes possible issues related to examining age patterns at unique life-course stages and incomes, and it accounts for differences in career income trajectories unlike most previous approaches. However, individuals’ future income expectations at younger ages are only partially reflected in observed income at later ages. Also, as accumulated income relies on observed income, it does not reflect potential shadow costs of childbearing. That accumulated income histories have been used very rarely partly reflects much previous research having been oriented towards how income before childbearing is related to current income, but it is also likely to reflect a lack of empirical data rather than any theoretical objections. Unlike some other research designs in previous literature, the goal of this study is not to examine whether—everything else being equal—higher income increases or decreases childbearing. The goal is to give a detailed and unambiguous answer to the question of whether individuals with higher or lower incomes have more children over the life course, as observed in population data.
Data and methods
In this study, I examine how lifetime accumulated income correlates with fertility at various ages, using Swedish register data on the complete population for cohorts born between 1940 and 1970. Administrative income registers are available from 1968 until 2012 (the end of the data set) for ages 20–60, together with complete fertility histories. For most cohorts, income and fertility trajectories are available from age 20, although for the earliest cohort (1940) the income measurements begin at age 28 and are therefore not directly comparable with those for more recent cohorts. The income and fertility histories of the more recent cohorts are right-truncated in 2012, before age 60. The information on fertility is derived from the Swedish Multi-Generational Register, which is based on yearly birth records and documents recognized biological parents. All children can be linked to both parents, as long as the father is known (over 99 per cent of cases) and the parents survived until 1960. Administrative registers on taxation contain all income known by the authorities, including transfers made by Swedish state or municipal governments. Sweden had a system of individual taxation throughout the period (although joint taxation for spouses was optional in 1968–71), and all income refers to individual (not couple) income.
The study population is the Swedish population who survived to age 60 (or 2012) and never migrated. (The population that experienced death or emigration is not right-censored but is instead not part of the study population.) Income measurements refer to the total taxed income of that year. Measures of hours worked and wages are not available in Swedish registers. All data are derived from annual tax declarations of yearly income. Fertility measurements are based on current parity at that age (although I also provide results using final rather than current parity in the supplementary material) and are compared with accumulated income up to that age. I examine how this relationship has evolved over time, as well as estimating trends separately for women and men and differences by parity. I also assess mean fertility in relation to various accumulated income brackets at age 50. In Figure S1 in the supplementary material, a Lexis diagram shows data availability for the cohorts under study. The population includes all residents of Sweden, but even in the complete population, some of the groups contain very few individuals (e.g. men of high parity at a very early age and women with very high earnings). The estimates for these groups are unstable, and interpretation should be made with care (for the income group statistics, data points with fewer than five members have been removed).
I use two time series for men’s and women’s income. The first is disposable income, which is net of (progressive) taxes and includes all social benefits and transfers paid by the government, including social welfare schemes. Importantly, it includes both child allowances and parental leave benefits. The second is earnings, which is a measure of all income from labour and is gross of taxes. Notably, it does not include parental leave but does include brief episodes of sick leave. These are the two reliable time series available in Swedish registers since 1968. Income series are adjusted for inflation (with 2000 as reference year) and presented in Swedish kronor (SEK); during the 2000s the exchange rate was one krona to around 0.10–0.15 euro.
The two time series capture different aspects of economic resources for parents. Because disposable income includes incomes after transfers (i.e. income after progressive taxation as well as targeted support to disadvantaged groups), its distribution is much more equal than for gross earnings. Crucially for this study, various government transfers targeting parents (e.g. the universal Swedish child allowance, which is higher for large family sizes) are included in the disposable income measure. Equally important, the measure includes the generous Swedish parental leave benefits, as well as benefits for the support of sick children.
The measure of earnings, in contrast, is a conservative measure. It is based on pre-tax income, and as it does not include parental leave (which is paid by the government, not the employer), any episode away from work has a strong negative effect on accumulated earnings (even though the parent receives social insurance payments close to income replacement for the first year). The measure is representative of the employer’s perspective on an individual’s labour supply. As it is based on income before progressive taxation and excludes social transfers, it is less concentrated than the disposable income measure (which is after taxation).
Child allowances are by default paid to the mother, and it is uncommon (although possible) for this to be changed. Paid parental leave was introduced in 1976, and at that time men took 0.5 per cent of all days. Men took less than 10 per cent of paid parental leave until the mid-1990s and less than 20 per cent until 2006 (Duvander and Johansson Citation2012). Therefore, measures of women’s earnings are affected much more by childbirth compared with measures of their disposable income (which include parental leave benefits and so the sex differences are less marked). Men’s higher incomes also mean that men are affected by progressive taxation to a greater extent than women.
Results
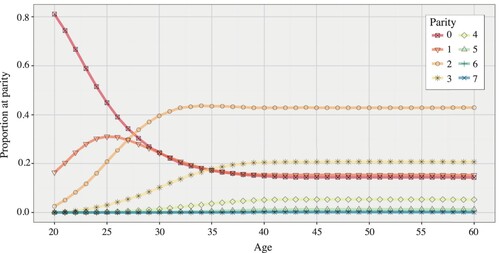
I begin by giving a descriptive picture of cohort fertility over time ( and Figures S2 and S3, supplementary material). Figure S2 shows mean fertility by age and cohort. Although period fertility varies substantially over time (Andersson and Kolk Citation2016), this is not reflected in completed cohort fertility, which is stable over time for the study cohorts. However, the mean age at childbearing increases across cohorts. The parity distribution by age for women in the 1950 cohort is shown in for background, as many of the later results are shown by parity. The distribution for men is very similar, but is shifted a few years to the right. As seen in Figure S2 completed parity distribution was constant over time, with the exception of some fertility postponement. In Figure S3 I show the distribution of women ever at a given parity by age and cohort.
Figure 1 Parity distribution by age: Swedish women born in 1950
Source: Swedish Multi-Generational Register.
In Figure S4, supplementary material, I show yearly earnings and disposable income by age, for men and women across time. Both earnings and disposable income increase greatly with increasing age and over time, consistent with the strong GDP per capita growth over the period (except during a recession in the early 1990s). This income growth is much stronger for women than for men. The measure of accumulated income is the life-course movement of a member of a cohort across the diagonals of Figure S4.
Mean accumulated income by parity
I present the relationship between current parity and current accumulated income in contemporary Sweden by sex for the 1940, 1950, 1960, and 1970 cohorts in . and show accumulated income up to each age, and the different lines represent the mean accumulated income (all income before that age) of men and women of that parity. The results refer to men and women born in a given year, who at that age have reached a specific parity (e.g. life-course income at age 30 and parity two is the income up to age 30 for individuals with two children by age 30). I also calculate trends based on the final parity of men and women in those cohorts (where e.g. life-course income at age 30 and parity two refers to the income up to age 30 of individuals that eventually have two children). The trends are overall very similar, and are virtually identical after age 50, only differing somewhat for parities zero and one at low ages (as most men and women transition from those states). These results are available in Figures S5 and S6, supplementary material. In and , I present the same data for the age with the latest measurement point in 2012 (or at age 60 if it occurred before 2012).
Figure 2 Accumulated disposable income and current parity at ages 20–60: cohorts of women and men born in Sweden in 1940, 1950, 1960, and 1970
Note: Data points are mean accumulated income up to that age, for individuals of that parity.
Source: Author’s analysis of data from Swedish multigenerational register and Swedish taxation registers.
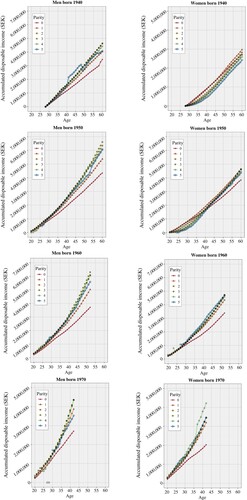
Figure 3 Accumulated disposable income and parity in 2012: women and men born in Sweden in 1940, 1950, 1960, and 1970
Source: As for .
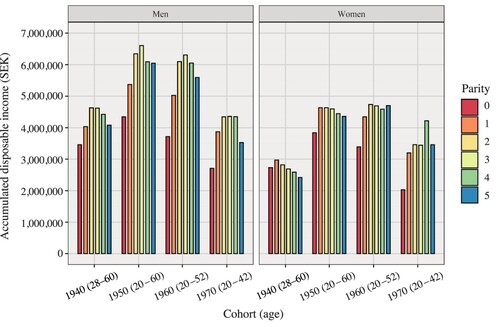
Figure 4 Accumulated earnings and current parity at ages 20–60: cohorts of women and men born in Sweden in 1940, 1950, 1960, and 1970
Note: Data points are mean accumulated income up to that age, for individuals of that parity.
Source: As for .
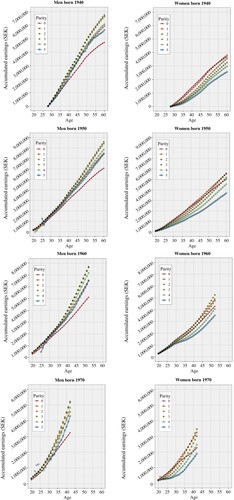
Figure 5 Accumulated earnings and parity in 2012: cohorts of women and men born in Sweden in 1940, 1950, 1960, and 1970
Source: As for .
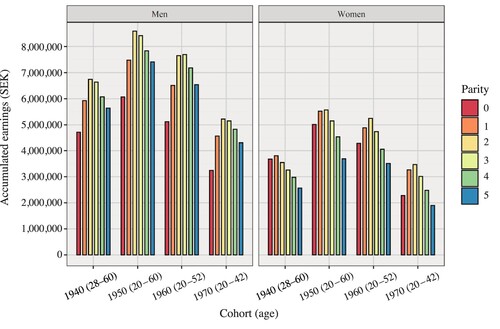
To understand the overall gradient in income and fertility, the difference in accumulated income between those at parities zero and one compared with those at parities two and three is most important for the overall gradient. The parity distribution is heavily weighted towards parity two and to a lesser extent three, with a substantial share also of parity zero and parity one individuals (see and Figure S3). Parities four and five are however very rare (less than 7 per cent of the population have four or more children, and less than 1.5 per cent have five or more), as shown in . At young ages, men and women at parity five are uncommon, so the time series are occasionally unstable.
I begin by showing the relationship between accumulated disposable income and parity from age 20 to age 60, for cohorts born 1940–70, in and , the latter showing the same information in a more comparable form. The main change in the relationship between accumulated disposable income and fertility is a change over time to an increasingly positive gradient between income and fertility. Men show a positive gradient in all cohorts: accumulated income over time is clearly lower for those at parity zero and to a lesser extent parity one. This relationship starts out substantive, but increases in magnitude over time. Overall, the highest accumulated disposable income is seen among men of parities two and three, while men at parity five do slightly worse but have substantially higher disposable income than childless men and those at parity one. For women, the 1940 cohort shows a slightly negative relationship, where the highest accumulated disposable incomes are seen at parities one, two, and zero (in that order), but by the 1950 cohort there is already a positive gradient. For later cohorts, the women’s pattern increasingly resembles that of men, with a strong positive gradient. However, the major divide is between childless women and women at all other parities. For the 1970 cohort, the positive gradient at the highest age (42) is very strong. In summary, there is strong evidence of an increasingly positive relationship across cohorts between fertility and accumulated income, where childless men and women are particularly disadvantaged in income. It should be noted that the measure of disposable income includes (tax-free) child allowances, other government subsidies such as housing allowances, and parental leave; as such, it is an accurate measurement of how much money individuals actually receive in a year, but is less reflective of men’s and women’s incomes from earnings.
The results for accumulated earnings are shown in and . Similar to the measure of accumulated disposable income, there is a gradual pattern of an increasingly positive relationship between earnings and fertility. The pattern for men is very similar to the positive gradient observed for disposable income. For women, there is a clear negative relationship for the 1940 cohort, and to a lesser extent the 1950 cohort. In the 1960 and 1970 cohorts there is a more ambiguous pattern, with low incomes for childless women, high incomes for women at parities one, two, and three, and the lowest incomes for women with five children. The highest income is seen among women with two children. It should be noted, however, that the measure of accumulated earnings is a very strict definition of earnings from labour. Most importantly, the generous Swedish parental leave benefits are not included in the measure, even though they could be viewed as an insurance payment. These parental leave benefits provide 80–90 per cent of lost income up to a high threshold that includes almost all women and a clear majority of men. The low accumulated earnings of women at high parities are typically related to subsequent episodes outside the labour market with no earnings (but parental leave payments), and in this context the high accumulated earnings of women at parities two and three are notable. It is striking that women born in 1970 with two children by age 42 have earned more money in the labour market than childless women, despite (on average) being outside the labour market for more than two years.
Mean fertility by categories of accumulated income
In the previous subsection, I described how mean accumulated income varied by final parity. Here, I instead focus on differences in the income distribution and on how mean fertility varies across different accumulated income brackets. I show results on mean fertility for accumulated disposable income and earnings up to age 50 for the 1940, 1950, and 1960 birth cohorts of men and women. The disposable income results are shown in and the earnings results in . The distributions of men and women by income bracket for the different cohorts are shown in Figure S7, supplementary material. As seen in Figure S4 on income change over time, more recent cohorts of both men and women have substantively higher incomes at age 50. Therefore, the distributions of men and women shift substantively towards higher accumulated incomes in the more recent cohorts.
Figure 6 Mean completed fertility by age 50, by accumulated disposable income categories: cohorts of (a) women and (b) men born in Sweden in 1940, 1950, and 1960
Note: In some cases, points are omitted for the top income groups due to very few individuals.
Source: As for .
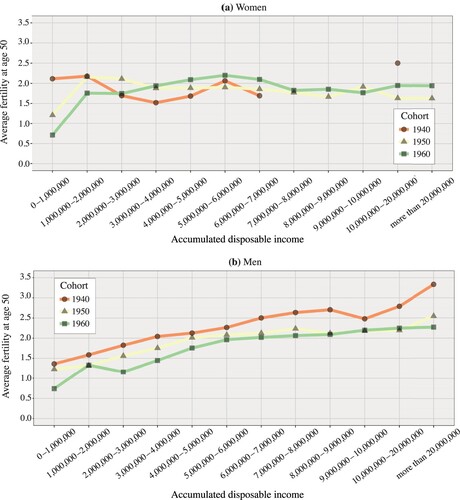
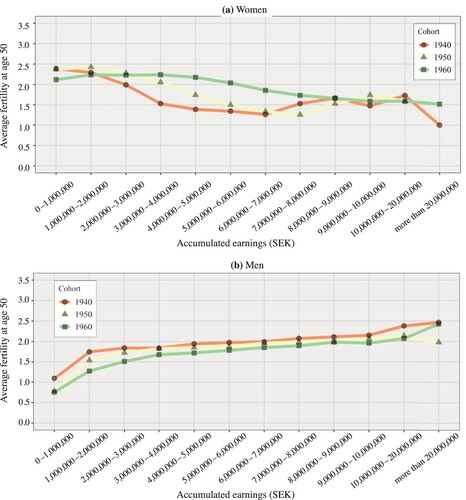
Figure 7 Mean completed fertility by age 50, by accumulated earning categories: cohorts of (a) women and (b) men born in Sweden in 1940, 1950, and 1960
Note: In some cases, points are omitted for the top income groups due to very few individuals.
Source:As for .
(a) shows women’s mean fertility by category of accumulated disposable income at age 50 and illustrates a change from a negative to a positive gradient across cohorts. For the 1940 cohort, fertility is highest at very low levels of disposable income and shows a decrease at the highest percentiles of accumulated disposable income (i.e. ignoring the small group with very high income). For the 1950 and 1960 cohorts, the group (around 5 per cent) with no or very low declared income displays the lowest fertility. For the 1950 cohort, the fertility peak is shifted rightwards and is highest around an accumulated income of about 2 million SEK, still lower than the median of the accumulated income distribution for women. Unlike in the 1940 cohort, women in the 1950 cohort in higher income brackets show only slightly lower mean fertility than those with lower incomes. The lowest fertility is found among women with very low accumulated disposable income. For the 1960 cohort, there is instead a positive gradient among women in the more common income brackets, with the highest fertility at around 5–6 million SEK, somewhat to the right of the median and the lowest fertility in the lowest income categories. Overall, there is evidence of the gradual emergence of a positive gradient across cohorts, but one that tapers off into a modest inverse ‘U’ shape at very high disposable income levels. At very high disposable incomes, fertility is still above the population mean. The peaks of the distributions of accumulated disposable income at age 50 are at 1.8 million SEK, 3.9 million SEK, and 4.6 million SEK for women born in 1940, 1950, and 1960, respectively (Figure S7-1).
(b) shows the same information (mean fertility by disposable accumulated income at age 50) for men. Unlike for women, there are relatively small differences across cohorts. In all cohorts, there is an unambiguous positive association between disposable income and fertility. The pattern is strong, with mean fertility below 1.5 in the lowest income categories and well above 2.0 in higher income categories. The trend is largely monotonic, with the highest fertility at very high levels of income (near 3.5 children for the 1940 cohort and near 2.5 children for later cohorts).
(a and b) shows the results for accumulated earnings among women and men, respectively. The overall patterns are fairly similar to those shown for accumulated disposable income. For women, there is a stronger negative gradient between earnings and fertility at high levels of earnings than with the disposable income measurement, and the (very few) women from the 1940 cohort in the top two income groups have substantially fewer children, although that is less the case in the 1960 cohort. For men, there is a robust positive relationship in all cohorts for accumulated earnings, similar to that for accumulated disposable income.
Conclusion
In this paper, I have provided robust evidence of a mostly positive relationship between income and fertility. I applied the novel measure of accumulated income, where life-course socio-economic status is operationalized in a straightforward manner. The relationship grows stronger over time and is stronger for men than for women. For women, the relationship is negative for the 1940 and 1950 cohorts but reverses in later cohorts. For women’s earnings, the positive relationship with fertility is not very strong in the 1960 and 1970 cohorts, whereas for disposable income it is nearly as strong as for men in these later cohorts. The results also have some implications for the reasons for such a gradient: they are consistent with the notion that childbearing increases with income and that children may therefore be viewed as a normal good (although only in the latest cohorts is this true for both men and women). I find higher income with increasing parity up to parity four, while the very rare parities of five and above still appear to be uncommon among the well and very well off. As such, there is an indication that having a third and fourth child (beyond the two-child norm) is more common among those with high incomes, whereas five children is seen as too many (and only found among 1 per cent of our study population). For men, mean fertility increases with income monotonically even at very high levels of accumulated income. The group with the lowest income among both men and women is the childless. Income effects appear to be strongest for the decision to have at least one or two children. This is consistent with earlier US and Swedish research (Simon Citation1975; Andersson and Scott Citation2008).
While the results clearly show that men and women with higher incomes have more children, the research design cannot be used to assess the causality of a pure income effect on childbearing. If young individuals can accurately forecast their future income trajectories and have a realistic picture of the costs and career penalties or benefits of childbearing, the finding gives some indication of the overall elasticity of the relationship between income and fertility. An alternative explanation for the observed positive income gradient is that instead of a positive income effect, we observe specific fertility preferences and behaviours that are more common among men and women with very high incomes; that is, richer men and women value a large family size more highly than those with lower incomes. Based on previous theorizing on fertility and income, it is unlikely that the ideal family size is much lower among lower-income individuals. The observed negative gradient is more likely due to the relative affordability of having a large number of children. Previous research has shown that involuntary childlessness and postponement are more common among low-income individuals as compared with high-income individuals (e.g. Testa and Toulemon Citation2006).
This study has provided clear evidence on the empirical question of whether higher-income men/women have more/fewer children and how this has changed over time. To understand living conditions for children, it is critical to understanding which children have access to more parental resources (McLanahan Citation2004). Observed associations between socio-economic status and fertility also provide the relevant perspective if we wish to understand intergenerational stratification processes (Lam Citation1986; de la Croix and Doepke Citation2003; Mare Citation2011). The study was limited to the Swedish-born population, as the life-course perspective makes it impossible to study migrants. Life-course fertility is similar across natives and the foreign born in Sweden (Statistics Sweden Citation2014), although there are some smaller immigrant groups that display both a large share of high parities and most likely also lower life-course income.
The finding of a positive income–fertility gradient in contemporary Sweden is consistent with evidence from pre-industrial periods (Lee Citation1987; Skirbekk Citation2008). One theoretical explanation for this finding is that values previously associated with lower fertility, which appeared early among higher social status groups, have now dispersed more evenly throughout the population. According to such an explanation, lifestyle choices associated with low fertility were likely adopted earlier primarily by higher socio-economic groups but might now be found in all groups in society. There is clear evidence that upper social status groups were in the vanguard of the fertility transition across Europe in the late-nineteenth and early-twentieth centuries (Livi-Bacci Citation1986; Dribe et al. Citation2014). During the twentieth century, other demographic behaviours, such as modern contraceptives and divorce, were also first adopted by high-status groups (Lin and Hingson Citation1974; Kasarda et al. Citation1986; Sandström Citation2011).
In contemporary Sweden, where such values may no longer be more common in higher-status groups, this study showed a theoretically plausible pattern in which higher income increases how many (costly) children parents can have. At least in a generous and relatively homogenous welfare state such as Sweden, it may be that such preferences are now no longer correlated with income or other dimensions of economic status, and the pure positive income effect may be responsible for the positive income–fertility gradient. The results are consistent with the positive education–fertility gradient recently observed in Sweden (Jalovaara et al. Citation2019), as well as previous literature on the positive association between current income and probability of conception (Andersson Citation2000; Duvander and Andersson Citation2003; Andersson and Scott Citation2008). Similarly, IQ is positively related to fertility for men both within and across educational groups (Kolk and Barclay Citation2019, Citation2021), and income, IQ, and education all show joint and separate positive associations with fertility for men (Kolk and Barclay Citation2021). Earlier researchers have speculated that contraceptive knowledge (Notestein Citation1936; Becker Citation1960) may be one such variable that can explain a negative gradient. In a society such as post-war Sweden, however, a negative gradient is more likely related to other lifestyle preferences that may explain lower fertility among high-status groups. One reason to expect that cultural differences in preferences for children across social groups are important for the observed negative fertility gradients in the twentieth century is that the association between income and business cycles is largely positive in developed countries (Sobotka et al. Citation2011). If the business cycle covaries positively with fertility, this may originate from a purer income (and labour market) effect, as an improved societal income can be seen as an exogenous increase in the income of most members of society.
An explanation based on changing preferences across societal groups is likely relevant primarily for interpreting the increasingly positive gradient between overall household income and fertility. The reversal of the income gradient for women’s income can likely also be understood through the diminishing structural barriers to combining work and family (e.g. the growth of subsidized day care over the period and the emergence of a generous parental leave system) and increasing women’s participation in the formal labour market (Stanfors and Goldscheider Citation2017). This has led to an increasing contribution from women to household income across the cohorts under study and thus an increasingly positive correlation between women’s income and household income. When the earliest cohorts of the study were of childbearing age, Sweden was only partially a dual-earner society and women only contributed a minor share of household income. Therefore, the negative gradient between women’s income and fertility likely reflected primarily a negative association between women’s labour force participation and fertility for the 1940 and 1950 cohorts, rather than necessarily a negative association between household income and fertility. Fertility decision-making for women in these cohorts was likely often more influenced by their partner’s income than their own. The increasing similarity between patterns for males and females over time is consistent with an increasingly less gender-differentiated dual-earner society. Homogamy of the highly educated (where high-income earners form relationships with other high-income earners) is also likely part of such a process, contributing to a positive link between income and fertility for both men and women (e.g. Dribe and Stanfors Citation2010). To conclude, it appears that the relationships between men’s and women’s life-course incomes and fertility are similar.
An important step for future research will be to examine the extent of life-course income correlations with fertility in other contexts and societies. It is plausible that fertility and the accumulated income gradient may look different outside Scandinavia, particularly for women. Future research should take a couple-level perspective on the issues examined in the current study, examining both how total couple income varies with fertility and whether the share of cumulative income by sex affects fertility. Such research designs will need to be different from the one used in this study. Because men and women change union status over the life course (and enter their first unions at different ages), different study populations and operationalizations of the life course will be necessary. The emergence of an increasingly positive income–fertility gradient is likely to be increasingly apparent in a growing number of high-income societies (Kolk Citation2021). As this phenomenon has major implications for many demographic and family sociological processes, it deserves more attention from social scientists.
Supplementary Material
Download PDF (2 MB)Disclosure statement
No potential conflict of interest was reported by the author.
Notes
1 Please direct all correspondence to Martin Kolk, Demography Unit, Department of Sociology, Stockholm University, 106 91 Stockholm, Sweden; or by E-mail: [email protected]
2 Martin Kolk is based at the Demography Unit, Department of Sociology, Stockholm University; the Centre for the Study of Cultural Evolution, Stockholm University; the Institute for Future Studies, Stockholm; and Åbo Akademi University, Vasa, Finland.
3 Acknowledgements: This work was supported by Riksbankens Jubileumsfond under grant (P17–0330:1), as well as Forte [2016-07115 and 2020-00639]. While writing the manuscript I received helpful feedback from Gunnar Andersson, Linus Andersson, Kieron Barclay, and Diederik Boertien, as well as constructive input from several reviewers.
4 Compliance with ethical standards: The author declares no conflicts of interest. The research has been approved by the Stockholm Ethical Review Board. The micro-level data are accessible following an application to the Swedish ethical review board.
References
- Andersson, G. 2000. The impact of labour-force participation on childbearing behaviour: Pro-cyclical fertility in Sweden during the 1980s and the 1990s, European Journal of Population 16(4): 293–333. https://doi.org/10.1023/A:1006454909642
- Andersson, G. and K. Scott. 2008. Childbearing dynamics of couples in a universalistic welfare state: The role of labor-market status, country of origin, and gender, Demographic Research 17(30): 897–938. https://dx.doi.org/10.4054/DemRes.2007.17.30
- Andersson, G. and M. Kolk. 2016. Trends in childbearing, marriage and divorce in Sweden: An update with data up to 2012, Finnish Yearbook of Population Research 50: 21–30. https://doi.org/10.23979/fypr.52483
- Becker, G. 1960. An economic analysis of fertility, in George B. Roberts (ed.), Demographic and Economic Change in Developed Countries. Cambridge, MA: Columbia University Press, pp. 209–240.
- Becker, G. and H. G. Lewis. 1974. Interaction between quantity and quality of children, in T. W. Schultz (ed.), Economics of the Family: Marriage, Children, and Human Capital. Cambridge, MA: National Bureau of Economic Research, pp. 81–90.
- Becker, G. 1991. A Treatise on the Family. Cambridge, MA: Harvard University press.
- Bengtsson, T., C. Campbell, and J. Z. Lee. 2003. Life Under Pressure: Mortality and Living Standards in Europe and Asia, 1700-1900. Cambridge, MA: The MIT Press.
- Bernhardt, E. M. 1972. Fertility and economic status – Some recent findings on differentials in Sweden, Population Studies 26(2): 175–184. https://doi.org/10.2307/2173576
- Bhuller, M., M. Mogstad, and K. G. Salvanes. 2011. Life-cycle bias and the returns to schooling in current and lifetime earnings, IZA DP No. 5788. https://doi.org/10.2139/ssrn.1872736
- Bjorklund, A. 1993. A comparison between actual distributions of annual and lifetime income: Sweden 1951–89, Review of Income and Wealth 39(4): 377–386. https://doi.org/10.1111/j.1475-4991.1993.tb00468.x
- Blake, J. 1968. Are babies consumer durables? A critique of the economic theory of reproductive motivation, Population Studies 22(1): 5–25. https://doi.org/10.2307/2173350
- Böhlmark, A. and M. J. Lindquist. 2006. Life-cycle variations in the association between current and lifetime income: Replication and extension for Sweden, Journal of Labor Economics 24(4): 879–896. https://doi.org/10.1086/506489
- Bollen, K. A., J. L. Glanville, and G. Stecklov. 2007. Socio-economic status, permanent income, and fertility: A latent-variable approach, Population Studies 61(1): 15–34. https://doi.org/10.1080/00324720601103866
- Borg, M. O. M. 1989. The income-fertility relationship: Effect of the net price of a child, Demography 26(2): 301–310. https://doi.org/10.2307/2061527
- Budig, M. J. and P. England. 2001. The wage penalty for motherhood, American Sociological Review 66: 204–225. https://doi.org/10.2307/2657415
- Cohen, A., R. Dehejia, and D. Romanov. 2013. Financial incentives and fertility, Review of Economics and Statistics 95(1): 1–20. https://doi.org/10.1162/REST_a_00342
- de la Croix, D. and M. Doepke. 2003. Inequality and growth: Why differential fertility matters, American Economic Review 93(4): 1091–1113. https://doi.org/10.1257/000282803769206214
- Dribe, M. and M. Stanfors. 2010. Family life in power couples. Continued childbearing and union stability among the educational elite in Sweden, 1991–2005, Demographic Research 23: 847–878. https://doi.org/10.4054/DemRes.2010.23.30
- Dribe, M., M. Oris, and L. Pozzi. 2014. Socioeconomic status and fertility before, during, and after the demographic transition: An introduction, Demographic Research 31(7): 161–182. https://doi.org/10.4054/DemRes.2014.31.7
- Dribe, M. and C. D. Smith. 2021. Social class and fertility: A long-run analysis of Southern Sweden, 1922–2015, Population Studies 75(3): 305–323. https://doi.org/10.1080/00324728.2020.1810746
- Duvander, A. Z. and G. Andersson. 2003. När har vi råd att skaffa fler barn? En studie om hur inkomst påverkar fortsatt barnafödande [When can we afford more children? A study on how income affects continued childbearing], RFV analyserar 8.
- Duvander, A.-Z. and M. Johansson. 2012. What are the effects of reforms promoting fathers’ parental leave use?, Journal of European Social Policy 22(3): 319–330. https://doi.org/10.1177/0958928712440201
- Easterlin, R. 1969. Toward a socio-economic theory of fertility, in S. J. Behrman, L. Corsa, and R. Freedman (eds), Fertility and Family Planning: A World View. Ann Arbor: University of Michigan press, pp. 127–156.
- Edin, K. A. and E. P. Hutchinson. 1935. Studies of Differential Fertility in Sweden. Stockholm: PS King & Son.
- Ewer, P. A. and E. Crimmins-Gardner. 1978. Income in the income and fertility relationship, Journal of Marriage and the Family 40(2): 291–299. https://doi.org/10.2307/350760
- Fox, J., S. Klüsener, and M. Myrskylä. 2019. Is a positive relationship between fertility and economic development emerging at the sub-national regional level? Theoretical considerations and evidence from Europe, European Journal of Population 35(3): 487–518. https://doi.org/10.1007/s10680-018-9485-1
- Freedman, D. S. and A. Thornton. 1982. Income and fertility: The elusive relationship, Demography 19(1): 65–78. https://doi.org/10.2307/2061129
- Friedman, M. 1957. A Theory of the Consumption Function. Princeton: Princeton University Press.
- Galloway, P. R. 1988. Basic patterns in annual variations in fertility, nuptiality, mortality, and prices in pre-industrial Europe, Population Studies 42(2): 275–303. https://doi.org/10.1080/0032472031000143366
- Grätz, M. and M. Kolk. 2022. Sibling similarity in income: A life course perspective, Research in Social Stratification and Mobility 78: 100688. https://doi.org/10.1016/j.rssm.2022.100688
- Hoem, J. 1993. Public policy as the fuel of fertility: Effects of a policy reform on the pace of childbearing in Sweden in the 1980s, Acta Sociologica 36(1): 19–31. https://doi.org/10.1177/000169939303600102
- Jalovaara, M. and A. Miettinen. 2013. Does his paycheck also matter?: The socioeconomic resources of co-residential partners and entry into parenthood in Finland, Demographic Research 28: 881–916. https://doi.org/10.4054/DemRes.2013.28.31
- Jalovaara, M., G. Neyer, G. Andersson, J. Dahlberg, L. Dommermuth, P. Fallesen, and T. Lappegård. 2019. Education, gender, and cohort fertility in the Nordic countries, European Journal of Population 35: 563–586. https://doi.org/10.1007/s10680-018-9492-2
- Jones, L. E. and M. Tertilt. 2008. An economic history of fertility in the US: 1826-1960, in P. Rupert (ed.), Frontiers of Family Economics. Bingley, UK: Emerald, pp. 165–230.
- Jones, L. E., A. Schoonbroodt, and M. Tertilt. 2010. Fertility theories: Can they explain the negative fertility-income relationship?, in J. B. Shoven (ed.), Demography and the Economy. Chicago: University of Chicago Press, pp. 43–100.
- Kasarda, J. D., J. O. G. Billy, and K. West. 1986. Status Enhancement and Fertility. Orlando, FL: Academic Press.
- Kolk, M. and K. Barclay. 2019. Cognitive ability and fertility among Swedish men born 1951–1967: Evidence from military conscription registers, Proceedings of the Royal Society B: Biological Sciences 286: 20190359. https://doi.org/10.1098/rspb.2019.0359
- Kolk, M. 2021. Government transfers to parents and population policy in a global perspective: An economic demographic perspective, The Journal of Development Studies 57(9): 1483–1498. https://doi.org/10.1080/00220388.2021.1915480
- Kolk, M. and K. Barclay. 2021. Do income and marriage mediate the relationship between cognitive ability and fertility? Data from Swedish taxation and conscriptions registers for men born 1951–1967, Intelligence 84: 101514. https://doi.org/10.1016/j.intell.2020.101514
- Lam, D. 1986. The dynamics of population-growth, differential fertility, and inequality, American Economic Review 76(5): 1103–1116.
- Lee, R. 1987. Population dynamics of humans and other animals, Demography 24(4): 443–465. https://doi.org/10.2307/2061385
- Lee, R. and M. Anderson. 2002. Malthus in state space: Macro economic-demographic relations in English history, 1540 to 1870, Journal of Population Economics 15(2): 195–220. https://doi.org/10.1007/s001480100091
- Lin, N. and R. Hingson. 1974. Diffusion of family planning innovations: Theoretical and practical issues, Studies in Family Planning 5(6): 189–194. https://doi.org/10.2307/1965369
- Livi-Bacci, M. 1986. Social-group forerunners of fertility control in Europe, in A. J. Coale and S. C. Watkins (eds), The Decline of Fertility in Europe: The Revised Proceedings of a Conference on the Princeton European Fertility Project. Princeton, NJ: Princeton University Press, pp. 182–200.
- Malthus, T. R. 1798. An Essay on the Principle of Population, as It Affects the Future Improvement of Society. With Remarks on the Speculations of Mr. Godwin, M. Condorcet, and Other Writers. London: J. Johnson.
- Mare, R. D. 2011. A multigenerational view of inequality, Demography 48(1): 1–23. https://doi.org/10.1007/s13524-011-0014-7
- McLanahan, S. 2004. Diverging destinies: How children are faring under the second demographic transition, Demography 41(4): 607–627. https://doi.org/10.1353/dem.2004.0033
- Milligan, K. 2005. Subsidizing the stork: New evidence on tax incentives and fertility, Review of Economics and Statistics 87(3): 539–555. https://doi.org/10.1162/0034653054638382
- Myrskylä, M., H.-P. Kohler, and F. C. Billari. 2009. Advances in development reverse fertility declines, Nature 460(7256): 741–743. https://doi.org/10.1038/nature08230
- Notestein, F. W. 1936. Class differences in fertility, The Annals of the American Academy of Political and Social Science 188(1): 26–36. https://doi.org/10.1177/000271623618800104
- Preston, S. H. and C. S. Hartnett. 2010. The future of American fertility, in J. B. Shoven (ed.), Demography and the Economy. Chicago: University of Chicago Press, pp. 11–36.
- Sandström, G. 2011. Socio-economic determinants of divorce in early twentieth-century Sweden, The History of the Family 16(3): 292–307. https://doi.org/10.1016/j.hisfam.2011.06.003
- Sandström, G. and E. Marklund. 2019. A prelude to the dual provider family – The changing role of female labor force participation and occupational field on fertility outcomes during the baby boom in Sweden 1900–60, The History of the Family 24(1): 149–173. https://doi.org/10.1080/1081602X.2018.1556721
- Schaller, J. 2016. Booms, busts, and fertility: Testing the Becker model using gender-specific labor demand, Journal of Human Resources 51(1): 1–29. https://doi.org/10.3368/jhr.51.1.1
- Sigle-Rushton, W. and J. Waldfogel. 2007. Motherhood and women’s earnings in Anglo-American, Continental European, and Nordic countries, Feminist Economics 13(2): 55–91. https://doi.org/10.1080/13545700601184849
- Silva, E. 2014. Essays on Income and Fertility: Sweden 1968-2009. Lund: Lund University.
- Simon, J. L. 1975. The mixed effects of income upon successive births may explain the convergence phenomenon, Population Studies 29(1): 109–122. https://doi.org/10.1080/00324728.1975.10410188
- Skirbekk, V. 2008. Fertility trends by social status, Demographic Research 18(5): 145–180. https://doi.org/10.4054/DemRes.2008.18.5
- Sobotka, T., V. Skirbekk, and D. Philipov. 2011. Economic recession and fertility in the developed world, Population and Development Review 37(2): 267–306. https://doi.org/10.1111/j.1728-4457.2011.00411.x
- Stanfors, M. and F. Goldscheider. 2017. The forest and the trees: Industrialization, demographic change, and the ongoing gender revolution in Sweden and the United States, 1870-2010, Demographic Research 36: 173–226. https://doi.org/10.4054/DemRes.2017.36.6
- Statistics Sweden. 2014. Utrikes föddas barnafödande – före och efter invandring [Childbearing of the foreign-born – Before and after migration], Demografiska rapporter 2014: 4.
- Testa, M. R. and L. Toulemon. 2006. Family formation in France: Individual preferences and subsequent outcomes, Vienna Yearbook of Population Research 2006(4): 41–75. https://doi.org/10.1553/populationyearbook2006s41
- Thornton, A. 2005. Reading History Sideways: The Fallacy and Enduring Impact of the Developmental Paradigm on Family Life. Chicago: University of Chicago Press.