
ABSTRACT
It is well known that type 2 diabetes mellitus (T2D) is a globally increasing health burden. Despite recent therapeutic advances and the availability of many different classes of antihyperglycemic therapy, a large proportion of people do not achieve glycemic control. A decline in pancreatic beta-cell function has been defined as a key contributing factor to progression of T2D. In fact, a significant proportion of beta-cell secretory capacity is thought to be lost well before the diagnosis of T2D is made. Several models have been proposed to explain the reduction in beta-cell function, including reduced beta-cell number, beta-cell exhaustion, and dedifferentiation or transdifferentiation into other cell types. However, there have been reports that suggest remission of T2D is possible, and it is believed that beta-cell dysfunction may be, in part, reversible. As such, the question of whether beta cells are committed to failure in people with T2D is complex. It is now widely accepted that early restoration of normoglycemia may protect beta-cell function. Key to the successful implementation of this approach in clinical practice is the appropriate assessment of individuals at risk of beta-cell failure, and the early implementation of appropriate treatment options. In this review, we discuss the progression of T2D in the context of beta-cell failure and describe how C-peptide testing can be used to assess beta-cell function in primary care practice.
In conclusion, significant beta-cell dysfunction is likely in individuals with certain clinical characteristics of T2D, such as long duration of disease, high glycated hemoglobin (≥9%), and/or long-term use of therapies that continuously stimulate the beta cell. In these people, measurement of beta-cell status could assist with choice of appropriate therapy to delay or potentially reverse beta-cell dysfunction and the progression of T2D.
1. Introduction
The pathogenesis of classic type 2 diabetes mellitus (T2D) typically begins with insulin resistance, which gradually increases the demand on beta cells to secrete insulin [Citation1]. In the majority of people, normoglycemia is successfully maintained by a compensatory increase in insulin secretion. However, in individuals who are susceptible to developing T2D [Citation2], beta cells eventually fail to compensate for insulin resistance, resulting in glucose intolerance, and ultimately, fasting hyperglycemia and overt diabetes () [Citation3]. However, not all individuals progress to T2D at the same rate [Citation4]. The results of a recent data-driven analysis have provided a new substratification of five replicable clusters of individuals with diabetes (), each with different characteristics. The authors concluded that this approach ‘might eventually help to tailor and target early treatment to those who would benefit most, thereby representing a first step towards precision medicine in diabetes’ [Citation5].
Figure 1. Natural history of type 2 diabetes. IFG, impaired fasting glycemia; IGT, impaired glucose tolerance. Mazze R, et al., Staged diabetes management: a systematic approach. 2nd Ed. John Wiley & Sons. Copyright © 2006 Matrex
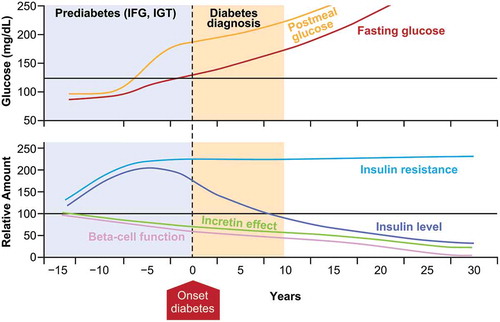
Table 1. Novel substratification of five replicable clusters of people with adult-onset diabetes developed by a data-driven cluster analysis [Citation5]
At present, despite the availability of a wide range of classes of antihyperglycemic therapy, the failure to adopt the timely use of optimal therapy contributes to the large numbers of people who do not achieve glycemic control [Citation6], which has the consequence of high risk for the development of the complications of T2D [Citation7]. In the NHANES study, the proportion of people achieving glycated hemoglobin (A1C) <7% declined slightly from 52.2% between 2007 and 2010 to 50.9% between 2011 and 2014 [Citation8]. Furthermore, over the same time period, the percentage of individuals with A1C > 9% increased from 12.6% to 15.5% [Citation8]. Estimates from the Healthcare Effectiveness Data and Information Set (HEDIS) suggest that in 2017, between 22.3% and 41.2% of people had an A1C > 9%, which is defined as ‘poor control’ [Citation9]. Thus, individuals with A1C ≥9% represent a significant proportion of people with T2D for whom effective treatment is urgently needed.
The first stage in the development of T2D is insulin resistance. During this time beta cells are stimulated to increase insulin secretion in order to maintain normal glucose levels [Citation10]. By the time T2D is diagnosed, around 40–50% of beta-cell function is already lost, with a further loss of 4–5% expected each year thereafter [Citation11–13]. As such, a better understanding of the pathophysiology of T2D has important therapeutic implications for the timely use of treatments that address insulin resistance and progressive beta-cell failure. For example, rather than relying solely on measurement of A1C, monitoring beta-cell function has the potential to provide invaluable information about disease status.
In this review, we discuss T2D disease progression in the context of beta-cell failure, and describe the impact of hyperglycemia, duration of disease, and mechanisms of action of different treatments on beta-cell status. We also review how beta-cell status can be assessed in the clinic to facilitate appropriate and effective early treatment decisions.
1.1. Beta-cell dysfunction and progression of T2D
The pancreas is estimated to comprise ~1 million islets of Langerhans, each of which contains ~1000 beta cells, comprising a total weight of ~0.9 g [Citation14]. The amount of insulin released depends on both the absolute number of beta cells in the islets of Langerhans (beta-cell mass) and the output of each of these cells (beta-cell function). As such, individuals with normal glucose tolerance can have wide variation in insulin sensitivity [Citation15]. The transition from impaired glucose tolerance to T2D occurs when the progressive loss of beta-cell function results in the inability to compensate for insulin resistance [Citation14,Citation16,Citation17], but the exact mechanism by which beta-cell failure occurs is not fully understood.
2. Models for beta-cell failure
The possible mechanisms leading to beta-cell failure can be broadly divided into three, not mutually exclusive, categories (), as reviewed by Swisa et al. (2017) [Citation18].
Figure 2. Models for beta-cell failure in T2D. Different colors indicate different islet cell type. ε, ghrelin; G, gastrin; E, endocrine cell with empty granules (no hormone produced). ‘Metabolic Stress and Compromised Identity of Pancreatic Beta Cells’ by Swisa A et al. is licensed under CC BY 4.0
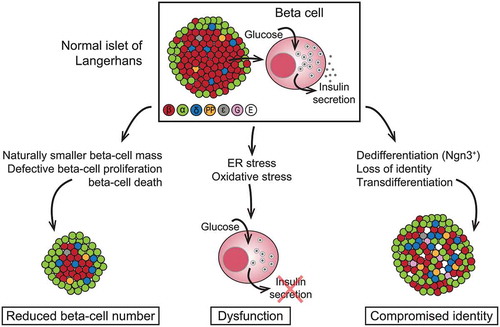
The first model is reduced beta-cell number, which can occur because of genetic or environmental factors, or cell death. Histological analysis in autopsy studies has confirmed that beta-cell mass can be reduced by up to 60% in people with T2D compared with healthy individuals with the same body mass index [Citation19–21]. Beta cells are most vulnerable to apoptosis during the period of persistent hyperglycemia around the time of the clinical onset of T2D [Citation22]. It is postulated that individuals with low beta-cell mass because of genetic or environmental factors may lack the ability to increase beta-cell capacity upon increased demand later in life, and therefore, have a higher risk for developing T2D [Citation23–25].
The second model is beta-cell exhaustion arising from oxidative stress because of altered glucose metabolism [Citation26–32]. The overall pancreatic islet response may vary according to individual genetics, but common pathogenetic factors likely include inflammatory stress, stress on the endoplasmic reticulum, or metabolic stress [Citation33]. It has been suggested that an increased metabolic load (e.g., from insulin resistance, hyperglycemia, or hyperlipidemia) can place beta cells under severe endoplasmic reticulum stress, resulting in beta-cell exhaustion, where although histologically normal, beta cells fail to secrete insulin [Citation34,Citation35]. It is postulated that this phenomenon can be reversed by achieving normal glucose and lipid levels [Citation36,Citation37]. For example, studies in people with early T2D have shown that calorie restriction can restore normal glucose control [Citation38,Citation39]. The outcome of one of these studies suggested that restoration of beta-cell function can be achieved as early as 4 weeks after commencing a very low-calorie diet, with the first-phase insulin response being within the normal range by 8 weeks [Citation38]. Results from both longitudinal and interventional studies suggest that beta-cell glucose insensitivity (also known as beta-cell ‘stunning’) is closely related to the development of hyperglycemia, and that furthermore, this phenomenon is at least partially reversible [Citation14].
The third model is one of compromised identity of the beta cell, by dedifferentiation or transdifferentiation into other cell types. Results from a recently published preclinical study in mice with Foxo1-deficient beta cells suggested that high metabolic load causes loss of beta-cell gene expression, and subsequent dedifferentiation and reprogramming that results in a phenotype similar to other islet cell types, resulting in loss of beta-cell function without cell death [Citation40]. However, results from further studies suggest that dedifferentiated beta cells revert to their original identity when exposed to normal glucose levels [Citation41–44].
Reductions in both beta-cell mass [Citation20] and beta‐cell function [Citation45] have been reported in people with T2D. Although beta-cell dysfunction is sufficient to cause hyperglycemia, beta-cell loss per se is not necessarily a prerequisite for hyperglycemia, because other functioning beta cells may overcompensate for such loss. As such, beta-cell loss may not cause hyperglycemia until it reaches a level that is severe enough to be accompanied by intrinsic beta-cell dysfunction [Citation14]. Although it is possible to differentiate between beta-cell capacity and beta-cell glucose sensitivity using clinical testing, the relative contribution of each to the progression of T2D is not well understood ( and ) [Citation14].
Figure 3. Change in beta-cell function and mass during development of abnormal glucose tolerance. IGT, impaired glucose tolerance; NGT, normal glucose tolerance; T2D, type 2 diabetes. ‘Obesity, Type 2 Diabetes, and Beta-Cell Failure: An Asian Perspective’ by Yoshifumi Saisho is licensed under CC BY 4.0
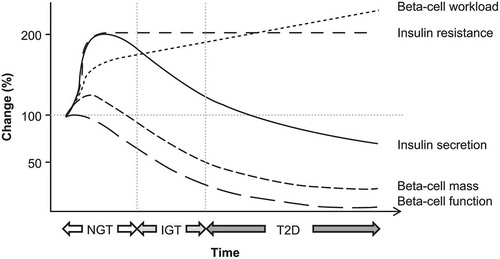
Figure 4. Schematic of beta-cell function versus beta-cell mass in normal, non-diabetic obese individuals and diabetic individuals. Stippled areas represent the range of changes in beta-cell function observed with weight loss and improved glycemic control; the corresponding changes in beta-cell mass are hypothetical. The dotted blue lines represent the associated changes in glucose tolerance and insulin resistance. Reprinted from Cell Metabolism, 11(5), Ferrannini E, The stunned beta cell: a brief history, 349–52, Copyright 2010, with permission from Elsevier
3. Clinical predictors of beta-cell dysfunction
Beta-cell status is assessed in clinical trials using several commonly used methods including measurement of proinsulin/insulin (PI/I) ratio and the homeostasis model assessment (HOMA) model. The PI/I ratio estimates the capacity of beta cells to convert proinsulin to insulin, and in the HOMA model, beta-cell function is measured through calculation of the ratio of fasting insulin to fasting glucose. Further information on these methods is provided in [Citation46,Citation47,Citation48].
Table 2. Assessments of beta-cell function used in clinical practice
The BETADECLINE study was an Italian multicenter prospective study conducted to describe clinical predictors of beta-cell dysfunction in 507 individuals with T2D who had received stable treatment with oral antihyperglycemic drugs or diet for more than 1 year. The results revealed that the risk of beta-cell stress (as assessed by tertiles of PI/I ratio) was 3.8 times higher for each 1% (10.9 mmol/mol) increase in baseline A1C, and 2.25 times higher for each 1% increment in A1C during the study [Citation49]. The study also determined that use of insulin secretagogues was associated with a more than four-fold higher risk of beta-cell dysfunction (odds ratio, 4.20; 95% CI, 2.55–6.91) [Citation50]. Similarly, the U.K. Prospective Diabetes Study (UKPDS), using a HOMA model, revealed that there was a progressive loss of beta-cell function after treatment with sulfonylureas [Citation51]. Hou and colleagues [Citation52] used HOMA-B to evaluate beta-cell function in 818 individuals with newly diagnosed T2D who were naive to treatment and were recruited from the Shandong province between January and April 2012. Participants were divided into five groups based on A1C level (<6.5%, 6.5–7%, 7–8%, 8–9%, and ≥9%). Individuals with A1C of 6.5–7% exhibited an increased HOMA-B index compared with those with A1C<6.5%, indicating that a slight increase in A1C may induce increases in insulin secretion, which occur to compensate for rising insulin resistance. However, the HOMA-B index was significantly decreased in people with A1C≥7%, with decreases of 9.3% and 23.7% in those with A1C 7–8% and 8–9%, respectively. In individuals with A1C≥9%, a 62% reduction in beta-cell function was observed [Citation52]. Similar results confirming the association between A1C, glycemic variability, and beta-cell functionality were reported by Fang et al. (2014) [Citation53]. These findings concur with those of other groups, who have reported that cellular changes appear to be irreversible in individuals with T2D duration of longer than 10 years [Citation54].
As such, the question of whether beta cells are committed to failure in people with T2D is complex, and as such, early treatment is essential to achieve the best outcomes. Restoration of normoglycemia as early as possible, and not exhausting the beta cell by continued overstimulation may protect beta-cell function, rendering the reversal of beta-cell dysfunction a viable therapeutic target. Key to this is the appropriate assessment of individuals at risk of beta-cell failure.
4. Assessment of beta-cell failure in clinical practice
A number of methods can be used to provide an assessment of beta-cell failure [Citation48]. Although the gold standard for assessment of beta-cell function is the acute insulin response, measurement requires use of a hyperglycemic clamp technique and as such, its use is primarily limited to the research setting. Furthermore, it is not possible to accurately measure insulin secretion using plasma insulin concentrations because of increased hepatic clearance and reduced circulating insulin concentrations [Citation55]. The strengths and weaknesses of alternative assessments that can be used in clinical practice are summarized in . PI/I ratio has been shown to correlate directly with maximum beta-cell secretory capacity [Citation56]. Measurement of C-peptide, which does not undergo hepatic degradation, is a simple alternative to assess beta-cell function, and indeed, study results suggest that proinsulin/C-peptide ratio is a stronger predictor of T2D than PI/I ratio [Citation57].
4.1. C-peptide: a surrogate marker for beta-cell function
When beta cells produce insulin, it is first secreted as proinsulin. C-peptide is a 31-amino acid polypeptide that connects the alpha and beta chains of proinsulin [Citation58]. Upon removal of C-peptide from the proinsulin molecule, the alpha and beta chains become linked, and proinsulin turns into insulin. Thus, C-peptide and insulin are present in beta cells in equal amounts and are co-secreted into the portal vein in equimolar amounts. In contrast to insulin, C-peptide does not undergo hepatic degradation and is cleared entirely in peripheral tissues at a relatively constant rate. C-peptide has a substantially longer half-life than insulin (approximately 35 min vs. 3–5 min) [Citation59,Citation60]. Furthermore, in individuals who are receiving insulin therapy, insulin assays cannot distinguish endogenous and exogenous insulin, but the differential kinetics of C-peptide mean that peripheral plasma C-peptide concentrations can be used to accurately estimate insulin secretion.
4.2 Measurement of C-peptide in clinical practice
The American Diabetes Association (ADA) 2020 Standards of Care state that ‘a biomarker screening pathway such as the combination of urinary C-peptide/creatinine ratio and antibody screening may aid in determining who should get genetic testing for [maturity-onset diabetes of the young]’ [Citation61], but do not specifically mention the routine clinical use of C-peptide measurements. However, as far back as 2001, the report from an ADA workshop concluded that ‘C-peptide is the appropriate outcome measure for type 1 diabetes clinical trials to preserve beta-cell function’ [Citation62]. The report states, ‘Endogenous insulin secretion is assessed best by measurement of C-peptide, which is cosecreted with insulin in a one-to-one molar ratio but unlike insulin experiences little first-pass clearance by the liver. Measurement of C-peptide under standardized conditions provides a sensitive, well accepted, and clinically validated assessment of beta-cell function. C-peptide measurement is the most suitable primary outcome for clinical trials of therapies aimed at preserving or improving endogenous insulin secretion in type 1 diabetes patients’ [Citation62].
Advances in assay methodology mean that C-peptide measurement is now a reliable and inexpensive assessment by which beta-cell status can be determined. Its applicability in routine clinical practice is supported by the results of recent studies demonstrating that C-peptide in blood samples is more stable than previously suggested. For example, study results suggest that frozen storage of blood-derived C-peptide samples may not be required. If whole blood is collected in potassium ethylenediaminetetraacetic acid and measured using modern immunoassay methodology, C-peptide is stable at room temperature for at least 24 hours, whereas if blood is collected into serum gel or plain sample tubes, C-peptide is stable for only 6 hours [Citation63–65].
In healthy individuals, the plasma concentration of C-peptide in the fasting state is 0.3–0.6 nmol/L (0.9–1.8 ng/mL), which increases to 1–3 nmol/L (3–9 ng/mL) in the postprandial state [Citation66]. Thus, C-peptide levels can be measured in the fasting, random non-fasting, or stimulated states [Citation58]. Whereas a fasting C-peptide test is performed after an overnight fast of at least 8 hours, and before any food or non-water beverages are consumed, a stimulated C-peptide test can be conducted in three ways. These are (1) after drinking a ‘mixed meal shake,’ which is a standardized liquid meal; (2) after an injection of glucagon; (3) after eating a high-carbohydrate meal or drink containing at least 75 g of carbohydrate energy. In the postprandial state, increased plasma glucose levels and incretin effects result in further increases in insulin secretion. Therefore, postprandial C-peptide more likely reflects the maximal insulin secretory capacity as opposed to fasting C-peptide level. Furthermore, because glucose itself is a major stimulus of beta cells, insulin secretion is augmented by the higher glucose level seen in people with T2D. As such, for the most accurate assessment of beta-cell function, C-peptide levels should be adjusted for plasma glucose levels [Citation67].
Alternatively, C-peptide levels can be reliably measured via ‘spot’ urine sample by calculating the urine C-peptide:creatinine ratio, thus adjusting urine C-peptide concentration for variation in urine concentration. The concentration of C-peptide in urine is 10–20 times higher than in plasma, and when the urine sample is collected in boric acid, C-peptide is stable for at least 72 hours [Citation68,Citation69]. The 2-h urine C-peptide:creatinine ratio has been demonstrated to be highly correlated with serum C-peptide measurements both in individuals with insulin-treated [Citation70] and non-insulin-treated diabetes [Citation71]. It is important to note that C-peptide levels in individuals with renal impairment must be interpreted with caution as approximately half of C-peptide is removed by the kidneys, with only about 5% being excreted unchanged in the urine [Citation69]. Consequently, blood levels of C-peptide can be artificially high in people with renal impairment [Citation72].
In a study that measured fasting, postprandial and 24-h urinary C-peptide levels, although low C-peptide levels as measured by any of these methods were significantly associated with the need for insulin therapy, a receiver operating characteristic analysis revealed that postprandial C-peptide:glucose ratio (area under the curve, 0.779) was the best predictive marker for the need for insulin therapy. The best cutoff value for predicting insulin therapy was 2.02 [Citation73]. Similar results were observed in a cohort of insulin-naive people with T2D [Citation74]. A practical approach for assessment of C-peptide in clinical practice is measurement of non-fasting ‘random’ C-peptide with concurrent measurement of glucose levels to exclude hypoglycemia, using a cutoff of >140 mg/dL (8 mmol/L) for consideration as a stimulated value [Citation69]. The effectiveness of this approach has been validated in a large study [Citation75]. Measurement of random C-peptide and concomitant glucose levels along with anti-glutamic acid decarboxylase (GAD) antibodies can be used to assess for the possibility of type 1 diabetes and latent autoimmune diabetes. Random C-peptide and concomitant glucose measurements are also of particular use in individuals on multiple-dose injections of insulin to determine potential for simplifying their regimen (e.g., to basal insulin plus glucagon-like peptide-1 receptor agonist [GLP-1 RA]), and to determine the relative safety of adding a sodium-glucose co-transporter-2 inhibitor to multiple-dose injection therapy in people with T2D. Fasting C-peptide and glucose levels are often used to document eligibility for insulin pump therapy. However, C-peptide measurement during hyperglycemic emergencies may not be accurate as levels can be suppressed during glucose toxicity, neither is it a reliable test for insulin production in hypoglycemic individuals as C-peptide levels will be low when glucose concentration is low. When evaluating a person for an insulinoma, C-peptide levels are inappropriately raised even in the presence of hypoglycemia.
5. The importance of knowing beta-cell reserve in individuals with T2D
Currently, the most commonly used method for assessing glycemic control is measurement of A1C, which provides an indication of average blood sugar level for the previous 2–3 months. Although targets for A1C control should be individualized, it is generally agreed that most people with diabetes should target an A1C level of <7% [Citation76]. However, maintenance of adequate beta-cell function is important in facilitating glycemic control, and as such is an important indicator of disease status and the need for additional or alternative treatment. This was demonstrated over a 6-year period in the UKPDS study, which showed that 62% of participants with baseline beta-cell function below 27% required additional therapy to maintain glycemic targets, whereas only 28% of those with beta-cell function above 55% required additional therapy [Citation51]. An analysis of the Veterans Affairs Diabetes Trial cohort revealed that C-peptide levels decreased with the duration of diabetes. In individuals with T2D duration of 0–3 years, mean baseline C-peptide was ~1.1 pmol/mL (0.0033 ng/mL), which decreased to ~0.6 pmol/mL (0.0018 ng/mL) in those with disease duration of 16–18 years. There was no further decline in those with T2D duration of ≥21 years, which suggests that there is a point at which beta-cell loss becomes stable [Citation77].
As the change over time in the treatment requirements of people with T2D occurs primarily because of the progressive loss of beta-cell function, knowledge of the beta-cell reserve may be useful for informing treatment decisions. As demonstrated in the UKPDS [Citation51], the use of sulfonylurea therapy was associated with loss of glycemic control over time, particularly in individuals with lower beta-cell function. In contrast, thiazolidinediones, which do not act via increasing insulin secretion, provide durable A1C lowering, as illustrated by A Diabetes Outcome Progression Trial (ADOPT) () [Citation78]. This double-blind, randomized study compared rosiglitazone, metformin, and glyburide as initial treatment in 4360 individuals with recently diagnosed T2D. The cumulative incidence of monotherapy failure at 5 years was lower with rosiglitazone (15%) versus metformin (21%) or glyburide (34%) [Citation78]. Further examination of beta-cell function and insulin sensitivity by oral glucose tolerance test in ADOPT suggested that the combined improvement in beta-cell function and insulin sensitivity was greater for rosiglitazone than metformin or glyburide, and appeared to be responsible for its superior glycemic durability [Citation79]. Similarly, results from the Liraglutide Effect and Action in Diabetes-3 (LEAD-3) study, which enrolled obese individuals with early T2D and a baseline A1C level of 8.2%, revealed that after 2 years of treatment, compared with glimepiride (−0.6%), glycemic control was significantly greater with the GLP-1 RA liraglutide (−0.9% with 1.2 mg and −1.1% with 1.8 mg) [Citation80]. In an analysis of 2-year completers, HOMA-IR decreased by 1.1% with liraglutide 1.2 mg, 0.8% with liraglutide 1.8 mg and increased by 0.8% with glimepiride (p = 0.0451 for liraglutide 1.2 mg vs. glimepiride). The increase in PI/I was significantly less for liraglutide 1.8 mg versus glimepiride (0.018 vs. 0.141; p = 0.0394). Increases in HOMA-B and fasting C-peptide occurred in all groups but were not significantly different [Citation80]. Also, the EUREXA study showed a significant benefit of the twice-daily GLP-1 RA exenatide over glimepiride in preventing treatment failure in people with T2D that was inadequately controlled on metformin (failure rate: exenatide 41%; glimepiride 54%; risk difference 12.4; hazard ratio 0.748; p = 0.002) [Citation81].
Figure 5. Loss of glycemic control differs according to class of treatment. A1C, glycated hemoglobin; SU, sulfonylurea; TZD, thiazolidinedione. van Raalte DH, Verchere CB, Diabetes, Obesity, and Metabolism, John Wiley & Sons Ltd. Copyright © 2017 John Wiley & Sons Ltd
5.1. Benefit of insulin therapy for individuals with beta-cell dysfunction
There is evidence to suggest that providing insulin therapy early in the course of T2D will prevent beta-cell exhaustion. Evidence supporting this concept was published in 2009 when results from a study of 84 individuals with newly diagnosed T2D who were treated with a 2-week continuous subcutaneous insulin infusion demonstrated that a shorter time interval between diagnosis and intensive insulin therapy was associated with improved glycemic outcomes [Citation82]. Further support for the use of early insulin therapy was provided by results of a systematic review and meta-analysis of interventional studies conducted to assess the effect of short-term intensive insulin therapy on pancreatic beta-cell dysfunction and insulin resistance, in which the authors reported that ‘short-term intensive insulin therapy can improve the underlying pathophysiology in early T2D’ [Citation83]. The author of one review suggests that people newly diagnosed with T2D and A1C >9% should receive early transient intensive insulin therapy to achieve normoglycemia within weeks, having written that ‘insulin use earlier in the treatment pathway should be considered, as it reduces the risk of hypoglycemia as well as allows beta-cell rest, which can help preserve beta-cell function’ [Citation84]. This approach is similar to that of the ADA Standards of Care, which recommend that people with very high A1C (>10%) should receive insulin [Citation85].
5.2. Beta-cell function and glycemic response to GLP-1 RA therapy
GLP-1 RAs are effective therapies with a well-established ability to reduce mean glucose levels, improve fasting plasma glucose levels, reduce appetite, and delay gastric emptying, thus reducing postprandial glucose excursions. Within the therapy class, GLP-1 RAs are sub-classified as short- or long-acting. Short-acting GLP-1 RAs such as exenatide twice-daily (half-life: ~2.4 h) and lixisenatide (half-life: 3–4 h) activate GLP-1 receptors intermittently, whereas long-acting GLP-1 RAs such as once-daily liraglutide, and once-weekly dulaglutide, exenatide and semaglutide have long half-lives (12 h up to 7 days) and continuously activate GLP-1 receptors. The differing pharmacokinetic characteristics of long- versus short-acting GLP-1 RA therapies result in pharmacodynamic differences between the two sub-classes. Whereas long-acting GLP-1 RAs can maintain high GLP-1 levels and stimulate secretion of insulin for extended periods even during fasting, the persistent stimulation of GLP-1 receptors results in receptor desensitization, internalization, and a consequent tachyphylaxis of the gastric emptying effect [Citation86]. By contrast, short-acting GLP-1 RAs, which cause only intermittent GLP-1 receptor activation, have a less pronounced effect on insulin secretion during fasting and do not cause tachyphylaxis of the gastric emptying effect [Citation87]. Thus, the mechanism of action of short-acting agents tends more toward effecting a delay in gastric emptying, whereas the primary mechanism of action of long-acting GLP-1 RAs is via stimulation of beta cells to increase insulin secretion [Citation88,Citation89]. Another consideration is that, by virtue of their primary mechanism of action of stimulating insulin secretion, long-acting GLP-1 RAs may have reduced efficacy in people with more progressive beta-cell dysfunction. Results of a prospective study in which the majority of participants received a long-acting GLP-1 RA (64% liraglutide, 9% exenatide once-weekly, 27% exenatide twice-daily) suggested that the effectiveness of GLP-1 RA therapy was diminished in those with longer disease duration and also, that markers of beta-cell failure (lower fasting C-peptide, lower post-meal urine C-peptide:creatinine ratio and positive GAD or islet autoantibodies) predicted poor glycemic response to GLP-1 RA therapy [Citation90]. Similarly, the results of an observational study showed that people with a low urinary C‐peptide/creatinine ratio had a reduced glycemic response to the long-acting GLP-1 RA, liraglutide [Citation91]. Results from a meta-analysis of seven phase 3 trials showed that duration of T2D impacts the efficacy of liraglutide, with people with a shorter duration of T2D having significantly greater decreases in A1C and fasting plasma glucose, although these were described as not clinically relevant [Citation92]. In contrast, treatment with the short-acting GLP-1 RA, lixisenatide, improved glycemic control irrespective of beta‐cell function, as measured either using the secretory units of islets in transplantation index or HOMA‐B [Citation93,Citation94].
The Restoring Insulin Secretion (RISE) study was conducted in adults with impaired glucose tolerance or recently diagnosed (<12 months) T2D, for which no treatment had been received. Participants were randomized to 12 months of treatment with metformin, insulin glargine plus metformin, or liraglutide. Although beta-cell function was improved during active treatment with all three treatments, with the largest improvement observed for liraglutide, the benefits were not maintained after treatment was stopped [Citation95]. Results from other studies suggest that if started early, treatment with the short-acting GLP-1 RA, exenatide, may preserve beta-cell function. In a 1-year on-treatment study of beta-cell function in people with T2D who received exenatide twice-daily compared with glargine, the C-peptide response to arginine during hyperglycemia increased 3.19-fold in the exenatide group compared with 1.31-fold in the insulin glargine group [Citation96]. Similar results were observed in a long-term study that compared treatment with exenatide twice-daily versus insulin glargine in individuals receiving metformin. Improvement in meal-related beta-cell glucose sensitivity was sustained at 3 years in people who received exenatide twice-daily, but not in those who received insulin glargine [Citation97,Citation98]. The ADA Standards of Care recommend use of dual therapy as initial therapy in people with A1C ≥1.5% above target [Citation85]. Similarly, the joint American Association of Clinical Endocrinologists and American College of Endocrinology consensus recommends the use of dual or triple therapy (GLP-1 RAs and sodium-glucose cotransporter-2 inhibitor therapies are strongly recommended) in people with A1C >9% at presentation, with the addition of insulin in symptomatic individuals [Citation99].
The results of the ongoing Future Glycemia Reduction Approaches in Diabetes: a Comparative Effectiveness Study (GRADE) will be released in 2021, and may provide clarity on the long-term effects of long-acting GLP-1 RAs such as liraglutide on human beta-cell function. However, the effect of shorter-acting GLP-1 RAs has not been assessed in this study [Citation100].
6. Conclusions
The progression of T2D is caused by the continuous loss of beta-cell function, with higher A1C levels and longer duration of T2D being associated with a declining beta-cell function. A T2D duration of 10 years appears to be the point at which beta-cell loss becomes irreversible and cannot be restored through the achievement of normoglycemia [Citation54]. As such, deterioration of beta-cell function is an important cause of failure of many antihyperglycemic therapies. Therapies that rely on beta-cell function to stimulate insulin secretion may have reduced effectiveness in people with progressive beta-cell dysfunction and could actually increase the workload of islet cells, and may, over time, cause beta-cell exhaustion. Furthermore, continued stimulation of GLP-1 receptors may result in tachyphylaxis. Measurement of beta-cell function is particularly important in people experiencing treatment failure, or in those with high A1C or long duration of T2D, as it can inform on appropriate treatment choices. A fasting C-peptide is a useful indicator of beta-cell function and has been shown to correlate with diabetes type, duration of T2D, and age of diagnosis [Citation58]. Measurement of fasting C-peptide in people with T2D duration >10 years and/or A1C >9%, who likely have significant beta-cell failure, can avoid use of unnecessary diabetes medications that will not achieve glycemic control, and its measurement, therefore also has clinical utility in people with marked hyperglycemia to inform the decision on the most appropriate, and consequently, effective, initial therapy.
Contribution statement
All authors contributed to the conceptualization, critical review, revision, and approval of the final version of this manuscript.
Declaration of interest
CW: Acted as advisor/consultant for Abbott, AstraZeneca, Janssen, Novo Nordisk, and Sanofi. Received research funding from Abbott, Allergan, Eli Lilly, Gilead, Mylan, and Novo Nordisk. Attended speakers’ bureau for AstraZeneca, Boehringer Ingelheim Dexcom, Eli Lilly, Janssen, Novo Nordisk, and Sanofi.
JS: Acted as consultant/attended advisory boards for Bayer, Eli Lilly, Intarcia, Novo Nordisk, and Sanofi.
Declaration of financial/other relationships
CW: Payment for advisor/consultant services to Abbott, AstraZeneca, Janssen, Novo Nordisk, and Sanofi, and attendance of speakers’ bureau for AstraZeneca, Boehringer Ingelheim, Dexcom, Eli Lilly, Janssen, Novo Nordisk, and Sanofi. Received research funding from Abbott, Allergan, Eli Lilly, Gilead, Mylan, and Novo Nordisk.
JS: Payment for consulting services/attendance of advisory boards for Bayer, Eli Lilly, Intarcia, Novo Nordisk, and Sanofi.
Peer reviewers on this manuscript have no relevant financial or other relationships to disclose.
Acknowledgments
The authors received medical writing support for the preparation of this manuscript provided by Helen Jones, PhD, CMPP, of Evidence Scientific Solutions, funded by Sanofi US, Inc.
Additional information
Funding
References
- Cerf ME. Beta cell dysfunction and insulin resistance. Front Endocrinol (Lausanne). 2013;4:37.
- Zheng Y, Ley SH, Hu FB. Global aetiology and epidemiology of type 2 diabetes mellitus and its complications. Nat Rev Endocrinol. 2018 Feb;14(2):88–98.
- Kendall DM, Cuddihy RM, Bergenstal RM. Clinical application of incretin-based therapy: therapeutic potential, patient selection and clinical use. Am J Med. 2009 Jun;122(6 Suppl):S37–50.
- Ferrannini E, Nannipieri M, Williams K, et al. Mode of onset of type 2 diabetes from normal or impaired glucose tolerance. Diabetes. 2004 Jan;53(1):160–165.
- Ahlqvist E, Storm P, Käräjämäki A, et al. Novel subgroups of adult-onset diabetes and their association with outcomes: a data-driven cluster analysis of six variables. Lancet Diabetes Endocrinol. 2018 May;6(5):361–369.
- Khunti S, Khunti K, Seidu S. Therapeutic inertia in type 2 diabetes: prevalence, causes, consequences and methods to overcome inertia. Ther Adv Endocrinol Metab. 2019;10:2042018819844694.
- Stratton IM, Adler AI, Neil HA, et al. Association of glycaemia with macrovascular and microvascular complications of type 2 diabetes (UKPDS 35): prospective observational study. BMJ. 2000 Aug 12;321(7258):405–412.
- Carls G, Huynh J, Tuttle E, et al. Achievement of glycated hemoglobin goals in the US remains unchanged through 2014. Diabetes Ther. 2017 8;Aug(4):863–873.
- NCQA. Comprehensive diabetes care (CDC); [ cited 2019 Oct 2]. Available from: https://www.ncqa.org/hedis/measures/comprehensive-diabetes-care/.
- Kahn SE. Clinical review 135: the importance of beta-cell failure in the development and progression of type 2 diabetes. J Clin Endocrinol Metab. 2001 Sep;86(9):4047–4058.
- UKPDS. U.K. Prospective diabetes study 16. Overview of 6 years’ therapy of type II diabetes: a progressive disease. U.K. Prospective diabetes study group. Diabetes. 1995 Nov;44(11):1249–1258.
- Holman RR. Assessing the potential for alpha-glucosidase inhibitors in prediabetic states. Diabetes Res Clin Pract. 1998 Jul;40(Suppl):S21–25.
- Bretzel RG, Eckhard M, Landgraf W, et al. Initiating insulin therapy in type 2 diabetic patients failing on oral hypoglycemic agents: basal or prandial insulin? The APOLLO trial and beyond. Diabetes Care. 2009 Nov;32(Suppl 2):S260–265.
- Ferrannini E. The stunned beta cell: a brief history. Cell Metab. 2010 May 5;11(5):349–352.
- Ferrannini E, Natali A, Bell P, et al. Insulin resistance and hypersecretion in obesity. European Group for the Study of Insulin Resistance (EGIR). J Clin Invest. 1997 Sep 1;100(5):1166–1173.
- Fonseca VA. Defining and characterizing the progression of type 2 diabetes. Diabetes Care. 2009 Nov;32(Suppl 2):S151–156.
- Weyer C, Bogardus C, Mott DM, et al. The natural history of insulin secretory dysfunction and insulin resistance in the pathogenesis of type 2 diabetes mellitus. J Clin Invest. 1999 Sep;104(6):787–794.
- Swisa A, Glaser B, Dor Y. Metabolic stress and compromised identity of pancreatic beta cells. Front Genet. 2017;8:21.
- Clark A, Wells CA, Buley ID, et al. Islet amyloid, increased A-cells, reduced B-cells and exocrine fibrosis: quantitative changes in the pancreas in type 2 diabetes. Diabetes Res. 1988 Dec;9(4):151–159.
- Butler AE, Janson J, Bonner-Weir S, et al. Beta-cell deficit and increased beta-cell apoptosis in humans with type 2 diabetes. Diabetes. 2003 Jan;52(1):102–110.
- Rahier J, Guiot Y, Goebbels RM, et al. Pancreatic beta-cell mass in European subjects with type 2 diabetes. Diabetes Obes Metab. 2008 Nov;10(Suppl 4):32–42.
- Tabák AG, Jokela M, Akbaraly TN, et al. Trajectories of glycaemia, insulin sensitivity, and insulin secretion before diagnosis of type 2 diabetes: an analysis from the Whitehall II study. Lancet. 2009 Jun 27;373(9682):2215–2221.
- Garofano A, Czernichow P, Bréant B. In utero undernutrition impairs rat beta-cell development. Diabetologia. 1997 Oct;40(10):1231–1234.
- Petrik J, Reusens B, Arany E, et al. A low protein diet alters the balance of islet cell replication and apoptosis in the fetal and neonatal rat and is associated with a reduced pancreatic expression of insulin-like growth factor-II. Endocrinology. 1999 Oct;140(10):4861–4873.
- Meier JJ. Linking the genetics of type 2 diabetes with low birth weight: a role for prenatal islet maldevelopment? Diabetes. 2009 Jun;58(6):1255–1256.
- Kaneto H, Kajimoto Y, Miyagawa J, et al. Beneficial effects of antioxidants in diabetes: possible protection of pancreatic beta-cells against glucose toxicity. Diabetes. 1999 Dec;48(12):2398–2406.
- Kaneto H, Xu G, Fujii N, et al. Involvement of c-Jun N-terminal kinase in oxidative stress-mediated suppression of insulin gene expression. J Biol Chem. 2002 Aug 16;277(33):30010–30018.
- Krauss S, Zhang CY, Scorrano L, et al. Superoxide-mediated activation of uncoupling protein 2 causes pancreatic beta cell dysfunction. J Clin Invest. 2003 Dec;112(12):1831–1842.
- Robertson R, Zhou H, Zhang T, et al. Chronic oxidative stress as a mechanism for glucose toxicity of the beta cell in type 2 diabetes. Cell Biochem Biophys. 2007;48(2–3):139–146.
- Robertson RP, Harmon J, Tran PO, et al. Glucose toxicity in beta-cells: type 2 diabetes, good radicals gone bad, and the glutathione connection. Diabetes. 2003 Mar;52(3):581–587.
- Poitout V, Robertson RP. Glucolipotoxicity: fuel excess and beta-cell dysfunction. Endocr Rev. 2008 May;29(3):351–366.
- Lenzen S. Oxidative stress: the vulnerable beta-cell. Biochem Soc Trans. 2008 Jun;36(Pt 3):343–347.
- Halban PA, Polonsky KS, Bowden DW, et al. Beta-cell failure in type 2 diabetes: postulated mechanisms and prospects for prevention and treatment. Diabetes Care. 2014 Jun;37(6):1751–1758.
- Back SH, Kaufman RJ. Endoplasmic reticulum stress and type 2 diabetes. Annu Rev Biochem. 2012;81:767–793.
- Evans-Molina C, Hatanaka M, Mirmira RG. Lost in translation: endoplasmic reticulum stress and the decline of beta-cell health in diabetes mellitus. Diabetes Obes Metab. 2013 Sep;15(Suppl 3):159–169.
- Pinnick K, Neville M, Clark A, et al. Reversibility of metabolic and morphological changes associated with chronic exposure of pancreatic islet beta-cells to fatty acids. J Cell Biochem. 2010 Mar 1;109(4):683–692.
- Cruzat VF, Keane KN, Scheinpflug AL, et al. Alanyl-glutamine improves pancreatic beta-cell function following ex vivo inflammatory challenge. J Endocrinol. 2015 Mar;224(3):261–271.
- Lim EL, Hollingsworth KG, Aribisala BS, et al. Reversal of type 2 diabetes: normalisation of beta cell function in association with decreased pancreas and liver triacylglycerol. Diabetologia. 2011 Oct;54(10):2506–2514.
- Steven S, Hollingsworth KG, Al-Mrabeh A, et al. Very low-calorie diet and 6 months of weight stability in type 2 diabetes: pathophysiological changes in responders and nonresponders. Diabetes Care. 2016 May;39(5):808–815.
- Talchai C, Xuan S, Lin HV, et al. Pancreatic beta cell dedifferentiation as a mechanism of diabetic beta cell failure. Cell. 2012 Sep 14;150(6):1223–1234.
- Laybutt DR, Hawkins YC, Lock J, et al. Influence of diabetes on the loss of beta cell differentiation after islet transplantation in rats. Diabetologia. 2007 Oct;50(10):2117–2125.
- Blum B, Roose AN, Barrandon O, et al. Reversal of beta cell de-differentiation by a small molecule inhibitor of the TGFbeta pathway. Elife. 2014 Sep;16(3):e02809.
- Brereton MF, Iberl M, Shimomura K, et al. Reversible changes in pancreatic islet structure and function produced by elevated blood glucose. Nat Commun. 2014 Aug;22(5):4639.
- Wang Z, York NW, Nichols CG, et al. Pancreatic beta cell dedifferentiation in diabetes and redifferentiation following insulin therapy. Cell Metab. 2014 May 6;19(5):872–882.
- Kahn SE. The relative contributions of insulin resistance and beta-cell dysfunction to the pathophysiology of type 2 diabetes. Diabetologia. 2003 Jan;46(1):3–19.
- Cernea S, Dobreanu M. Diabetes and beta cell function: from mechanisms to evaluation and clinical implications. Biochem Med (Zagreb). 2013;23(3):266–280.
- Wallace TM, Levy JC, Matthews DR. Use and abuse of HOMA modeling. Diabetes Care. 2004 Jun;27(6):1487–1495.
- Cersosimo E, Solis-Herrera C, Trautmann ME, et al. Assessment of pancreatic beta-cell function: review of methods and clinical applications. Curr Diabetes Rev. 2014 Jan;10(1):2–42.
- Russo GT, Giorda CB, Cercone S, et al. Beta cell stress in a 4-year follow-up of patients with type 2 diabetes: a longitudinal analysis of the BetaDecline Study. Diabetes Metab Res Rev. 2018 Sep;34(6):e3016.
- Russo GT, Giorda CB, Cercone S, et al. Factors associated with beta-cell dysfunction in type 2 diabetes: the BETADECLINE study. PLoS One. 2014;9(10):e109702.
- Matthews DR, Cull CA, Stratton IM, et al. UKPDS 26: sulphonylurea failure in non-insulin-dependent diabetic patients over six years. UK prospective diabetes study (UKPDS) group. Diabet Med. 1998 Apr;15(4):297–303.
- Hou X, Liu J, Song J, et al. Relationship of hemoglobin A1c with beta cell function and insulin resistance in newly diagnosed and drug naive type 2 diabetes patients. J Diabetes Res. 2016;2016:8797316.
- Fang FS, Cheng XL, Gong YP, et al. Association between glycemic indices and beta cell function in patients with newly diagnosed type 2 diabetes. Curr Med Res Opin. 2014 Aug;30(8):1437–1440.
- White MG, Shaw JA, Taylor R. Type 2 diabetes: the pathologic basis of reversible beta-cell dysfunction. Diabetes Care. 2016 Nov;39(11):2080–2088.
- Ohashi K, Fujii M, Uda S, et al. Increase in hepatic and decrease in peripheral insulin clearance characterize abnormal temporal patterns of serum insulin in diabetic subjects. NPJ Syst Biol Appl. 2018;4:14.
- Røder ME, Porte D Jr., Schwartz RS, et al. Disproportionately elevated proinsulin levels reflect the degree of impaired B cell secretory capacity in patients with noninsulin-dependent diabetes mellitus. J Clin Endocrinol Metab. 1998 Feb;83(2):604–608.
- Loopstra-Masters RC, Haffner SM, Lorenzo C, et al. Proinsulin-to-C-peptide ratio versus proinsulin-to-insulin ratio in the prediction of incident diabetes: the Insulin Resistance Atherosclerosis Study (IRAS). Diabetologia. 2011 Dec;54(12):3047–3054.
- Leighton E, Sainsbury CA, Jones GC. A practical review of C-peptide testing in diabetes. Diabetes Ther. 2017 Jun;8(3):475–487.
- Polonsky KS, Licinio-Paixao J, Given BD, et al. Use of biosynthetic human C-peptide in the measurement of insulin secretion rates in normal volunteers and type I diabetic patients. J Clin Invest. 1986 Jan;77(1):98–105.
- Luzi L, Zerbini G, Caumo A. C-peptide: a redundant relative of insulin? Diabetologia. 2007 Mar;50(3):500–502.
- American Diabetes Association. 2. Classification and diagnosis of diabetes: standards of medical care in diabetes-2020. Diabetes Care. 2020 Jan;43(Suppl1):S14–S31.
- Palmer JP, Fleming GA, Greenbaum CJ, et al. C-peptide is the appropriate outcome measure for type 1 diabetes clinical trials to preserve beta-cell function: report of an ADA workshop, 21-22 October 2001. Diabetes. 2004 Jan;53(1):250–264.
- McDonald TJ, Perry MH, Peake RW, et al. EDTA improves stability of whole blood C-peptide and insulin to over 24 hours at room temperature. PLoS One. 2012;7(7):e42084.
- Oddoze C, Lombard E, Portugal H. Stability study of 81 analytes in human whole blood, in serum and in plasma. Clin Biochem. 2012 Apr;45(6):464–469.
- Jane Ellis M, Livesey JH, Evans MJ. Hormone stability in human whole blood. Clin Biochem. 2003 Mar;36(2):109–112.
- Yosten GL, Maric-Bilkan C, Luppi P, et al. Physiological effects and therapeutic potential of proinsulin C-peptide. Am J Physiol Endocrinol Metab. 2014 Dec 1;307(11):E955–968.
- Saisho Y. Postprandial C-peptide to glucose ratio as a marker of beta cell function: implication for the management of type 2 diabetes. Int J Mol Sci. 2016 May 17;17(5):E744.
- McDonald TJ, Knight BA, Shields BM, et al. Stability and reproducibility of a single-sample urinary C-peptide/creatinine ratio and its correlation with 24-h urinary C-peptide. Clin Chem. 2009 Nov;55(11):2035–2039.
- Jones AG, Hattersley AT. The clinical utility of C-peptide measurement in the care of patients with diabetes. Diabet Med. 2013 Jul;30(7):803–817.
- Besser RE, Ludvigsson J, Jones AG, et al. Urine C-peptide creatinine ratio is a noninvasive alternative to the mixed-meal tolerance test in children and adults with type 1 diabetes. Diabetes Care. 2011 Mar;34(3):607–609.
- Bowman P, McDonald TJ, Shields BM, et al. Validation of a single-sample urinary C-peptide creatinine ratio as a reproducible alternative to serum C-peptide in patients with type 2 diabetes. Diabet Med. 2012 Jan;29(1):90–93.
- Covic AM, Schelling JR, Constantiner M, et al. Serum C-peptide concentrations poorly phenotype type 2 diabetic end-stage renal disease patients. Kidney Int. 2000 Oct;58(4):1742–1750.
- Saisho Y, Kou K, Tanaka K, et al. Postprandial serum C-peptide to plasma glucose ratio as a predictor of subsequent insulin treatment in patients with type 2 diabetes. Endocr J. 2011;58(4):315–322.
- Saisho Y, Kou K, Tanaka K, et al. Postprandial serum C-peptide to plasma glucose ratio predicts future insulin therapy in Japanese patients with type 2 diabetes. Acta Diabetol. 2013 Dec;50(6):987–988.
- Berger B, Stenström G, Sundkvist G. Random C-peptide in the classification of diabetes. Scand J Clin Lab Invest. 2000 Dec;60(8):687–693.
- American Diabetes Association [Internet]. Understanding A1C; [ cited 2019 Sep 12]. Available from: https://www.diabetes.org/a1c
- Duckworth WC, Abraira C, Moritz TE, et al. The duration of diabetes affects the response to intensive glucose control in type 2 subjects: the VA Diabetes Trial. J Diabetes Complications. 2011 Nov-Dec;25(6):355–361.
- Kahn SE, Haffner SM, Heise MA, et al. Glycemic durability of rosiglitazone, metformin, or glyburide monotherapy. N Engl J Med. 2006 Dec 7;355(23):2427–2443.
- Kahn SE, Lachin JM, Zinman B, et al. Effects of rosiglitazone, glyburide, and metformin on beta-cell function and insulin sensitivity in ADOPT. Diabetes. 2011 May;60(5):1552–1560.
- Garber A, Henry RR, Ratner R, et al. Liraglutide, a once-daily human glucagon-like peptide 1 analogue, provides sustained improvements in glycaemic control and weight for 2 years as monotherapy compared with glimepiride in patients with type 2 diabetes. Diabetes Obes Metab. 2011 Apr;13(4):348–356.
- Gallwitz B, Guzman J, Dotta F, et al. Exenatide twice daily versus glimepiride for prevention of glycaemic deterioration in patients with type 2 diabetes with metformin failure (EUREXA): an open-label, randomised controlled trial. Lancet. 2012 Jun 16;379(9833):2270–2278.
- Xu W, Li YB, Deng WP, et al. Remission of hyperglycemia following intensive insulin therapy in newly diagnosed type 2 diabetic patients: a long-term follow-up study. Chin Med J (Engl). 2009 Nov 5;122(21):2554–2559.
- Kramer CK, Zinman B, Retnakaran R. Short-term intensive insulin therapy in type 2 diabetes mellitus: a systematic review and meta-analysis. Lancet Diabetes Endocrinol. 2013 Sep;1(1):28–34.
- Hanefeld M. Use of insulin in type 2 diabetes: what we learned from recent clinical trials on the benefits of early insulin initiation. Diabetes Metab. 2014 Dec;40(6):391–399.
- American DiabetesAssociation. 9. Pharmacologic approaches to glycemic treatment: standards of medical care in diabetes-2020. Diabetes Care. 2020 Jan;43(Suppl 1)):S98–S110.
- Nauck MA, Kemmeries G, Holst JJ, et al. Rapid tachyphylaxis of the glucagon-like peptide 1-induced deceleration of gastric emptying in humans. Diabetes. 2011 May;60(5):1561–1565.
- Marathe CS, Rayner CK, Jones KL, et al. Relationships between gastric emptying, postprandial glycemia, and incretin hormones. Diabetes Care. 2013 May;36(5):1396–1405.
- Guo XH. The value of short- and long-acting glucagon-like peptide-1 agonists in the management of type 2 diabetes mellitus: experience with exenatide. Curr Med Res Opin. 2016;32(1):61–76.
- Meier JJ. GLP-1 receptor agonists for individualized treatment of type 2 diabetes mellitus. Nat Rev Endocrinol. 2012 Dec;8(12):728–742.
- Jones AG, McDonald TJ, Shields BM, et al. Markers of beta-cell failure predict poor glycemic response to GLP-1 receptor agonist therapy in type 2 diabetes. Diabetes Care. 2016 Feb;39(2):250–257.
- Thong KY, McDonald TJ, Hattersley AT, et al. The association between postprandial urinary C-peptide creatinine ratio and the treatment response to liraglutide: a multi-centre observational study. Diabet Med. 2014 Apr;31(4):403–411.
- Seufert J, Bailey T, Barkholt Christensen S, et al. Impact of diabetes duration on achieved reductions in glycated haemoglobin, fasting plasma glucose and body weight with liraglutide treatment for up to 28 weeks: a meta-analysis of seven phase III trials. Diabetes Obes Metab. 2016 Jul;18(7):721–724.
- Yabe D, Ambos A, Cariou B, et al. Efficacy of lixisenatide in patients with type 2 diabetes: a post hoc analysis of patients with diverse beta-cell function in the GetGoal-M and GetGoal-S trials. J Diabetes Complications. 2016 Sep-Oct;30(7):1385–1392.
- Bonadonna RC, Blonde L, Antsiferov M, et al. Lixisenatide as add-on treatment among patients with different β-cell function levels as assessed by HOMA-β index. Diabetes Metab Res Rev. 2017 Sep;33(6):e2897.
- RISE Consortium. Lack of durable improvements in beta-cell function following withdrawal of pharmacological interventions in adults with impaired glucose tolerance or recently diagnosed type 2 diabetes. Diabetes Care. 2019 Jun 9;42(9):1742–1751.
- Bunck MC, Diamant M, Cornér A, et al. One-year treatment with exenatide improves beta-cell function, compared with insulin glargine, in metformin-treated type 2 diabetic patients: a randomized, controlled trial. Diabetes Care. 2009 May;32(5):762–768.
- van Raalte DH, Bunck MC, Smits MM, et al. Exenatide improves beta-cell function up to 3 years of treatment in patients with type 2 diabetes: a randomised controlled trial. Eur J Endocrinol. 2016 Oct;175(4):345–352.
- van Raalte DH, Verchere CB. Improving glycaemic control in type 2 diabetes: stimulate insulin secretion or provide beta-cell rest? Diabetes Obes Metab. 2017 Sep;19(9):1205–1213.
- Garber AJ, Abrahamson MJ, Barzilay JI, et al. Consensus statement by the American Association of Clinical Endocrinologists and American College of Endocrinology on the comprehensive type 2 diabetes management algorithm - 2019 Executive summary. Endocr Pract. 2019 Jan;25(1):69–100.
- Nathan DM, Buse JB, Kahn SE, et al. Rationale and design of the glycemia reduction approaches in diabetes: a comparative effectiveness study (GRADE). Diabetes Care. 2013 Aug;36(8):2254–2261.