
ABSTRACT
Introduction and objectives
Artificial intelligence (AI) made it achievable that aortic dilation could be measured in CT images indirectly, while aortic diameter (AD) has the certain relationship with blood pressure. It was potential that the blood pressure condition be determined by AD measurement using the data obtained from a CT scanning especially in identifying masked hypertension and predicting the risk of poor control of blood pressure (BP) which was easy to elude diagnosis in clinic. We aimed to evaluate the possibility of utilizing AD by AI for predicting the risk of adverse BP status (including masked hypertension or poor BP control) and the optimal thoracic aortic position in measurement as well as the cutoff value for predicting the risk.
Methods
Eight hundred and one patients were enrolled in our study. AI-Rad Companion Cardiovascular (K183268 FDA approved) was used to perform automatic aorta measurement in thoracic CT images at nine key positions based on AHA guidelines. Data was post processed by software from AI-Rad Companion undergone rigorous clinical validation by both FDA and CE as verification of its efficacy and usability. The AD’s risk and diagnostic value was assessed in identifying hypertension in the general population, in identifying the poor BP controlled in the hypertension population, and in screening masked hypertension in the general population respectively by multiple regression analysis and receiver operating curve analysis.
Results
AD measured by AI was a risk factor for adverse BP status after clinical covariates adjustment (OR = 1.02 ~ 1.26). The AD at mid descending aorta was mostly affected by BP particularly, which is optimal indicator in identifying hypertension in the general population (AUC = 0.73) and for screening masked hypertension (AUC = 0.78).
Conclusion
Using AI to measure the AD of the aorta, particularly at the position of mid descending aorta, is greatly valuable for identifying people with poor BP status. It will be possible to reveal more clinical information reflected by ordinary CT images and enrich the screening methods for hypertension, especially masked hypertension.
PLAIN LANGUAGE SUMMARY
HTN has a significant adverse effect on arterial deformation. BP and arterial dilation promote each other in a vicious circle. Arterial dilation may not be restricted by apparent fluctuations in BP and is objective evidence of an undesirable BP state. The accuracy of AD measurements by AI on chest CT images has been verified. There has not been the application of AD measurement by AI in the scene of poor BP status in clinical practice.
In this study, we applied AI to measure the diameter of the aorta in nine consecutive positions. We explored the association between AD at various positions and BP levels and the possibility that AD in identifying poor BP status in different populations. We found that the AD at the MD is of great value in screening MH and evaluating the control state of BP in HTN. It will be possible to significantly expand the clinical information reflected by ordinary CT images and enrich the screening methods for HTN, especially MH.
Introduction
The significant influence of hypertension (HTN) on the diameter of arteries has been widely demonstrated [Citation1]. Abnormal blood pressure (BP) leads to changes in arteries from adaptive expansion to pathological expansion. Aortic expansion is considered a manifestation of poor cardiovascular remodeling, a part of vascular aging, and an independent risk factor of acute aortic syndromes such as aortic dissection2 moreover aneurysm [Citation2].
Previous studies have confirmed that there was an association between the expansion from the left ventricular outflow tract to the proximal aorta and the risk of cardiovascular diseases, including HTN [Citation3]. And the two-dimensional echocardiography was the main method to measure the aorta diameter in these studies [Citation4,Citation5]. In patients with HTN, the incidence of aortic root (AoR) dilation is approximately 10% [Citation6]. At the same time, it has been shown that HTN is positively correlated with the AD of Aortic sinuses of Valsalva (SV), Sinotubular junction (STJ), Mid ascending aorta (MAs), and Mid aortic arch (MAr), particularly significant at STJ and Mar [Citation4]. So, the expansion of the AoR means the expansion of the arteries both in the thoracic and abdominal segments simultaneously [Citation7], but the degree of expansion at each arterial level may vary under the same BP. Even the same increasing diameter at different arterial positions may have a different value in identifying the risk of poor BP status. In addition, as a special type of HTN, MH has been proved to be a risk factor to the non-fatal/fatal cardiac/cerebrovascular events, and the risk is similar, even exceed, to sustained hypertension [Citation8,Citation9]. Furthermore, a diagnosis based on separated clinic BP measurements limited screening out some MH. For screening out MH, we need to further develop an objective indicator, which is best not affected by the current BP level measured situation, BP fluctuation rhythm, or the effect of antihypertensive drugs. Otherwise, the effect of controlling BP below the target level on the remodeling process of the large arteries in different anatomic regions in HTN is still unclear. Therefore, we assume that the AD can be regarded as objective evidence which was not affected by the apparent BP fluctuation, and it may play a unique role in screening for MH and evaluating the efficacy of anti-HTN treatment.
Limited by inspection methods, previous studies could only research the relationship between BP and AD on two to three anatomic levels, but too limited vascular segments mean that the local hemodynamic status is similar, and it is similarly affected by BP. Trained on massive datasets based on chest CT, the AI-Rad Companion research prototype (Siemens Healthineers) was able to automate the process of aortic measurement. Normally, quantitative assessment of aortic measurement consisted of identifying the contour of the aortic landmark first and then locating the segments of the aortic root, aortic arch center, important bifurcations, aorta at digraph, etc. The algorithm was able to identify the aortic landmark for non-enhanced mediastinum scans correctly and quickly generate visionary insights within 1–2 minutes for one patient [Citation10]. We applied the Siemens AI-Rad system to measure the thoracic AD from SV to abdominal aorta at the celiac axis origin (Ab) at nine positions, and to analyze the association between the thoracic AD and BP levels or to explore the possibility of applying this method to screen MH, in order to find a new detect method which could show the actual BP status of the patient by calculating the anatomical structure parameters of the thoracic aorta collected on the lung CT plain scan image through artificial intelligence (AI).
Materials and Methods
The research proposal was reviewed and approved by the Clinical Research Institute of Wuhan Union Hospital (UHCT21651). The study was reviewed and approved by Union Hospital Medical Ethics Committee ([2021]0853). All the procedures performed were carried out by the Declaration of Helsinki, and all information/images have been anonymized to guarantee the protection of personal data.
1. Population
The study continuity included 1152 inpatients in the General Medical and Geriatrics Department of Wuhan Union Hospital from November 2018 to November 2019. Excluded: 1) 229 cases without chest CT scan images; 2) 22 cases of thick or thin lung window segmentation failure; 3) 81 cases of failure to mark the third segment; 4) 2 cases of hypotension (SBP <90 mmHg or DBP <60 mmHg); 5) 17 cases lack clinical laboratory data; 6) 0 case meets the exclusion criteria (Supplementary Materials). Ultimately, AI analysis was performed on the chest CT scan images of 801 cases with complete materials, which include age, gender, BMI, clinical diagnosis (diabetes, coronary heart disease, osteoporosis), serum biochemical indices, smoking, and drinking history.
2. Measurement of BP and Identification of BP status
Applied the standard BP measurement methods in 2018 ESC/ESH Guidelines for the management of arterial hypertension [Citation11]. The BP status of patients was monitored and diagnosed according to the procedures (Supplementary Material).
3. Grouping of BMI could be seen in the supplementary material
4. Methodology for AI
AI-Rad Companion Cardiovascular (K183268 FDA approved) (Siemens Healthineers) was used to perform automatic aorta measurements on thoracic CT images at nine key positions based on AHA guidelines. The AI-Rad Companion (Siemens Healthineers) is a family of automatic post-processing software tools that utilized deep-learning techniques having undergone rigorous clinical validation by both FDA and CE as verification of its efficacy and usability.
The aortic algorithm consists of three components: aorta segmentation, aortic landmark detection, and aorta measurement. Firstly, the segmentation masks of the aorta were computed with an Adversarial Image-to-Image Deep Network (DI2IN). The model uses a conventional encoder and decoder network to investigate the mapping between the input image and the targeted segmentation. The input volume was resampled to a uniform distribution of 2 mm, whilst the optimization algorithm used the stochastic gradient descent algorithm (SGD) to find the optimal convergence result. The network structure was analyzed and compared against prevailing methods in our previous work [Citation12]. The AI algorithm previously used for liver segmentation was extended and shown similar performance results for aortic applications.
Secondly, the aortic landmarks were automatically computed by the software to find out the relevant aortic structures (including aortic root, aortic arch center, brachiocephalic artery bifurcation, etc.) located within the CT images. The algorithms used for landmark detection were discussed in profound detail in previous work [Citation13]. The algorithm was trained against clinical ground truth validated by annotators and has been tested to reliably detect the nine specific aortic levels based on AHA standards [Citation10].
Finally, based on the segmentation mask and detected aortic landmarks, the algorithm then computed the corresponding aortic diameter based on the nine detected aortic levels. Given a specific aortic mask, a centerline model is used to generate an aortic centerline. Multiple detection points are computed by interpreting the centerline of the aortic landmark and determine suitable aortic diameters which are automatically represented in the report. Details of algorithmic technique including training/validation dataset, hyperparameters, network structure, training details, performance tests for all three segments can be found in the algorithmic discussion in Supplementary Materials.
5. The CT image and the landmarks of aortic measurement
All 801 participants’ were carried out by CT scanners from Siemens, Toshiba, and General Electric. The Scanning range was from the entrance of the thorax to the lower boundary of the lung. Applied scanning parameters: tube voltage 120 kV, tube current automatically adjusted, layer thickness 0.625–1.5 mm.
The chest plain CT images of all participants were uploaded from the PACS system (picture archiving and communication system) to the AI-Rad Companion research algorithm provided by Siemens Medical for automatic processing. The deep Reinforcement Learning algorithm [Citation13,Citation14] could identify measurement planes through the thoracic aortic centerline and the 9 horizontal positions of the aorta defined in the AHA guidelines [Citation10], and calculate the AD based on the square root of the maximum and minimum two-dimensional line segments in each measurement plane. The specific marking positions are as following ()):
Figure 1. Schematic diagram of segmentation of 9 consecutive levels of the aorta.
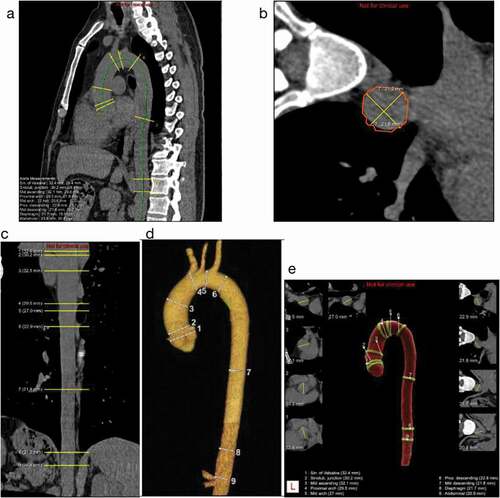
(1) SV: Aortic sinuses of Valsalva
(2) STJ: Sinotubular junction
(3) MAs: Mid ascending aorta (midpoint in length between Nos. 2 and 4)
(4) PAr: Proximal aortic arch (aorta at the origin of the innominate artery)
(5) MAr: Mid aortic arch (between left common carotid and subclavian arteries)
(6) PD: Proximal descending thoracic aorta (begins at the isthmus, approximately 2 cm distal to the left subclavian artery)
(7) MD: Mid descending aorta (midpoint in length between Nos. 6 and 8)
(8) DP: Aorta at the diaphragm (2 cm above the celiac axis origin)
(9) Ab: Abdominal aorta at the celiac axis origin
6. Statistical analysis
Quantitative data of non-normal and normal distribution and categorical data were expressed as medians with interquartile range (IQR), mean ± SD, and amounts with percentages, respectively. Differences among groups were respectively analyzed by Kruskal–Wallis test and ANOVA test for continuous variables in line with non-normal and normal distribution. The Chi-square test was used to compare the difference of categorical data between groups. The correlation analysis between the two variables was performed on AD and the variables related to AD (age, BP, and BMI). Calculate the Pearson’s and Spearman’s correlation coefficients and draw the matrix diagram. Scatter plot diagrams were constructed to describe the association between ADs and age, ADs, and SBP/DBP. The locally weighted regression scatter smoothing method (LOESS) and linear regression were performed curve fitting, then calculate the correlation coefficient of the linear regression equation.
Logistic regression was used to calculate the odds ratios (ORs) and 95% confidence intervals (CI) of each level of AD in the total population for hypertension, the ORs (95% CI) for poor BP control in the hypertensive population, and the ORs (95% CI) for MH, and all the models were adjusted for covariates. Finally, the receiver operating characteristic curves (ROCs) were used to evaluate the value of each level of ADs in identifying poor BP status in these different populations. P < 0.05 was considered statistically significant. All calculations and graphs were done using R (version 3.6.3-Mac OS X 10.11).
Results
1. Basic information distribution
1.1 Distribution of basic information of the overall population (grouped by HTN classification)
The AD at each position is significantly different among the groups of the HTN classification, generally, the AD increased combined with high level in the HTN grade (, )). The AD was significantly different between adjacent anatomy positions. From SV to Ab, the AD showed a process of widening first and then narrowing. The AD at the MAs was the widest, and the AD at the Ab was the narrowest ()).
Figure 2. The distribution of ADs at nine positions among groups.
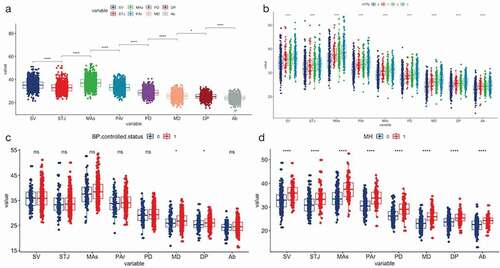
Table 1. The distribution of basic population materials in the graded diagnosis of HTN
1.2 Material distribution of HTN people and people with a regular clinic BP
We carried out a different test intragroup for people with HTN based on their BP control status and performed a different test intragroup for people with a regular clinic BP according to whether they were MH or not ().
Table 2. The distribution of basic materials between groups of BP well-controlled and BP poor-controlled in HTN and the distribution of basic materials between groups of MH and non-HTN in people with normal clinic BP
The average value of the AD at each level in the poorly controlled BP group was greater than that in the well-controlled BP group, but only the three positions of MD, DP, and Ab had significant differences between the two groups ()).
In the people with a regular clinic BP, the AD at all levels was significantly larger in the MH than in the Non-HTN ()).
2. Correlation analysis between various positions of AD and BP, age and BMI
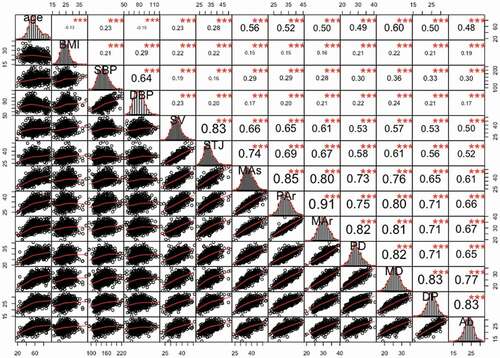
There was a significant positive correlation between each AD and age or BMI, and a significant positive correlation between the AD and BP (both SBP and DBP). For the same position of AD, the correlation coefficients between the AD at the aortic origin (SV, STJ) and DBP (R = 0.20 ~ 0.23) were higher than the correlation coefficients between that position of AD and SBP (R = 0.16 ~ 0.19); however, at subsequent positions (from MAs to Ab), the correlation coefficients between AD and SBP is higher. Besides, there is also a significant correlation between the AD of different positions at any two positions (R = 0.50 ~ 0.91) ()
Figure 3. The Correlation matrix of age, BMI, SBP, DBP and ADs at 9 positions.
The relationship between BP and AD did not show a uniform and stable growth trend. When the SBP was in the range of 110 to 180, the AD was expanded accompanied with the BP increase, however when SBP is lower than 110 or higher than 180, the AD reduced accompanied with the BP increase ()). In conclusion, the AD presented an ‘S’-shaped growth pattern with the increase of BP. Furthermore, the AD showed synchronous increasing with the DBP in the range of 65 to 85 ()).
Figure 4. Scatter plot and fitting curve/plane between BP, age and ADs.
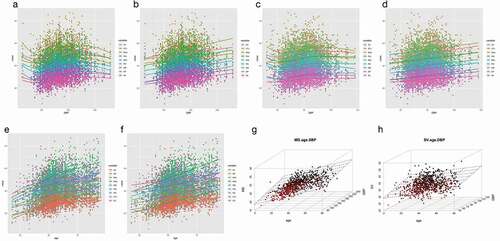
Under the linear regression equation fitting, according to the regression coefficients, the AD was most affected by the SBP variety at the position of MD: every 10 mmHg increasing in the SBP was accompanied with 0.56 mm increased in AD. Furthermore, the AD was most affected by the DBP variety at the position of SV: every 10 mmHg increasing in DBP was accompanied with 0.94 mm increased in AD (, ), )). This may also explain why only AD at the position of MD or DP showed significant difference between the groups of BP well-controlled and the poorly controlled in HTN (, )).
Table 3. Univariate linear regression analysis between BP (SBP, DBP) and AD, age and AD
The expansion of the AD also showed age-related changes. The AD at the MAs increased faster than other positions with age significantly (), ), ). The three-dimensional scatter plots presented the interaction between age, SBP, and AD at the level of MD ()), and displayed the relationship between age, DBP, and the AD at the SV ()), respectively.
3. Logistic regression analysis of the prediction risk of AD at each position on MH or poor BP controlled status
The AD expansion at the MD has the highest risk of adverse BP status in different populations. Every increase of 3.19 mm in the diameter of the artery at this position increased the risk of hypertension in the total population by 24.0% and the risk of poor BP control by 24.4% in the HTN. Moreover, it increased the risk of MH by 25.8% ().
Table 4. The OR value and 95% CI of the ADs in the population with different characteristics to the adverse BP states obtained by logistic regression analysis
4. Utilize ROC to evaluate the predictive effectiveness of various positions of AD on adverse BP status in different characteristic population
In the ROCs of different positions of AD to diagnose poor BP status in different populations, the effect of AD in HTN to identify poor BP controlled status was less effective (AUC = 0.475 ~ 0.578), while it showed strong effectiveness in diagnosing MH (AUC = 0.688 ~ 0.784). The AUC of AD at MD for identifying HTN in the total population was 0.74, the AUC for identifying poor BP control in the HTN was 0.58, and the AUC for identifying MH was 0.78. The identification thresholds are 24.35 mm, 26.05 mm, 24.35 mm, respectively (, ).
Figure 5. The ROCs of ADs at nine positions to identify poor BP status.
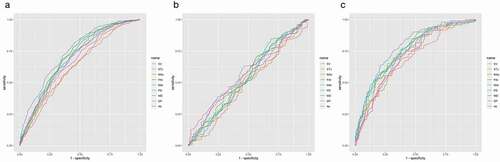
Table 5. The ROCs of ADs to identify poor BP states among people with different BP characteristics
Discussion
We used the AI-Rad system to measure the diameter of nine thoracic aorta levels from SV to Ab on chest CT scan images and analyzed the relationship between AD and BP, age, and poor BP status, and found that the dilation of the thoracic aorta at each level was a risk factor of poor BP status (HTN, poor BP controlled or MH). The thoracic ADs measured by AI in identifying HTN in the general population, identifying patients with poor BP control in the HTN, and identifying MH were valuable. Especially the AD at the MD which was the position most affected by the SBP among all the ADs measure position, and which value was the best in identify adverse BP status.
Previous studies have measured the ADs at different locations by two-dimensional echocardiography, magnetic resonance imaging, or enhanced CT. However, few studies have shown the distribution of ADs in the entire aorta simultaneously. Our analysis of nine locations of AD displays that the maximum diameter of the aorta appears in MAs. The results were roughly consistent with the conclusions of Alfred Hager [Citation15]. They measured the seven locations of the global aorta in that study. The obvious difference in the AD at different locations is the basis of its different relevance to HTN. We found that there was a significant positive correlation between any two of the nine locations of ADs, which was in line with the spot of Alegret JM et al. [Citation7]. This correlation suggested that the clinical value of any location of the aorta may be reasonably extended to other locations.
In our description of the relationship between BP and the AD, the true change did not show a single linear growth relationship: at a lower BP level, the AD decreases as the BP level increases, which may be the arterial lumen adapt to the performance of blood perfusion. The blood vessels function well, and the arteries contract to maintain or reach the optimal BP state, which is in line with the best Windkessel effect, under excessively high BP levels, blood vessels are remodeled significantly during the process of increasing BP, and the arteries are adaptively expanded, and the arterial stiffness has reached its peak. The reduction of AD at this time was the result of the balance of the increasing pulse pressure under the increase of the arterial stiffness, and it is also the performance of coping with BP decompensation [Citation16].
The relationship between BP and AD can be illustrated by basic physical principles and Laplace’s law that the tangential stress is proportional to the applied pressure and the radius of the container, and inversely proportional to the wall thickness [Citation1]. The increase in pressure leads to the adaptive expansion of the aorta, which leads to degeneration of the aortic wall in the long term. An increase in mechanical wall stress mediated by increased BP leads to elastin breakage [Citation4]. One study analyzing the influence of clinic-pathological factors on the external mechanical properties of the dilated aorta found that aging and hypertension are the most important factors that make the arterial tissue more fragile and difficult to stretch [Citation17]. Other related mechanisms between hypertension and arterial expansion also involve destructive cell remodeling, transmural infiltration, mechanical stretching, family susceptibility, hemodynamic changes, and oxidative stress, etc. [Citation18].
With the continuous development and update of AI technology, AI algorithms based on deep learning have been applied increasingly in medical image analysis. Deep reinforcement learning is to use deep learning to represent the state and policy in reinforcement learning [Citation19]. Classical reinforcement learning used to represent the current state and policy in the form of tables, not a vector. Currently, there are many deep learning methods such as CNN, 3D UNET, etc. [Citation20]. Considering the input of the model, an adversarial Image-to-Image network [Citation12] was applied to our study. The AI-Rad algorithm is based on the training of a large chest enhanced and non-enhanced CT dataset automatically measured nine horizontal diameters of the thoracic aorta and calculated from the square root of the maximum and minimum values of the two-dimensional line segments, which effectively avoids the effect of the aorta morphology on the accuracy of diameter measurement. Compared with the traditional manual measurement method, this algorithm can be able to measure the diameter of the whole thoracic aorta in a batch, which provides convenience for us to study the aorta in a large sample, thus helping us to have a deeper understanding of the morphology of the whole thoracic aorta and its evolution with the disease. Previous studies on the thoracic aorta were mostly limited to the thoracic aorta due to the limitation of measurement methods, and the diameter of the first three levels was an early indicator of aortic dilatation and cardiovascular risk. Our research shows that all nine levels of diameter were positively associated with the risk of hypertension. The growth of AD at MD (rather than the dilation of the aortic root or aortic arch) presented the greatest risk for adverse BP state. The AD at this level was most affected by BP, which was the risk of poor BP control for vascular events such as aneurysms and dissections in this segment.
We analyzed the risk of nine levels of ADs to adverse BP and calculated the corresponding threshold, which has a practical guiding role in evaluating the relationship between the degree of vascular deformation and BP in clinical practice. The cutoff value of the AD at ascending aorta calculated by Eunkyung Suh [Citation21] for indicating HTN was 35.9 mm, while this value was 36.35 mm in our research. This may be because the sample population of Eunkyung Suh was relatively young. From the perspective of the entire thoracic aorta, we should focus on the relationship between people whose AD at the level of MD was greater than 24.35 mm and HTN.
Currently, there are still practical difficulties in screening for MH [Citation22]. Physicians are often not vigilant enough about the potential risk of MH in people with regular clinic BP. And the diagnosis method of MH mainly relies on ambulatory BP monitoring and home BP monitoring, which has rigorous requirements in application scenarios, cost, or patient compliance. This study identified HTN from people with regular clinic BP, which reproduced the most common clinical discovery process of MH. The ADs calculated by AI, which is independent of clinic BP, stable, and reproducible, describe the vascular deformation degree of people with MH. And that might contribute to play its auxiliary value in screening people with MH.
However, this study also had some limitations. The diagnosis of MH is not rigorous enough. Patients have not been screened through home BP monitoring, which may lead to the proportion of people with MH being relatively low. The performance of the algorithm is also contingent on good scanning protocols and imaging quality. We have found in some cases where the algorithm was failed to detect the landmark due to defects in the CT images. Furthermore, the algorithm was trained on largely patients with normal physiology. It will need to be trained and optimized in subjects with different geographical backgrounds and ethnicities in the future. And for patients with extreme conditions or exocentric aortic anatomy, the results should be judged carefully.
Conclusion
AI provides us with a convenient and intuitive way to visualize the deformation of the aorta. For people with regular clinic BP, assessing the degree of dilation of their AD may be objective evidence to evaluate whether they are suffering from MH; for people who have been diagnosed with HTN and received antihypertensive treatment, measuring the ADs at the level of MD, DP and Ab could assist the doctor judging the damage of the blood vessel and whether the antihypertensive treatment is adequate. Whether BP was well controlled or not in HTN patients has a significant impact on the AD at the MD, which emphasizes the importance of strict BP control to alleviate the mechanical deformation of the arteries at this position.
Author contributions
Yaoling Wang and Lijuan Bai contribute equally to the article. Fan Yang and Benling Qi are both the corresponding authors, and Benling Qi takes primary responsibility for the entire paper.
Disclosure of financial/other conflicts of interest
Author Yichen Lu is employed by Siemens Healthineers Digital Technology (Shanghai). Author Li Chen is employed by Novartis pharmaceuticals corporation. The remaining authors declare that the research was conducted in the absence of any commercial, financial or other relationships that could be construed as a potential conflict of interest. Peer reviewers on this manuscript have no relevant financial or other relationships to disclose.
Supplemental Material
Download PDF (395.6 KB)Data availability statement
Data is openly available in a public repository that issues datasets with DOIs
Supplementary material
Supplemental data for this article can be accessed here
Additional information
Funding
References
- O’Rourke MF, Nichols WW. Aortic diameter, aortic stiffness, and wave reflection increase with age and isolated systolic hypertension. Hypertension. 2005;45(4):652–658.
- Elefteriades JA. Natural history of thoracic aortic aneurysms: indications for surgery, and surgical versus nonsurgical risks. Ann Thorac Surg. 2002;74(5):S1877–1880. discussion S1892-1898
- Milan A, Tosello F, Naso D, et al. Ascending aortic dilatation, arterial stiffness and cardiac organ damage in essential hypertension. J Hypertens. 2013;31(1):109–116.
- Vizzardi E, Maffessanti F, Lorusso R, et al. Ascending Aortic Dimensions in Hypertensive Subjects: reference Values for Two-Dimensional Echocardiography. J Am Soc Echocardiogr. 2016;29(9):827–837.
- Cuspidi C, Negri F, Salvetti M, et al. Aortic root dilatation in hypertensive patients: a multicenter survey in echocardiographic practice. Blood Press. 2011;20(5):267–273.
- Covella M, Milan A, Totaro S, et al. Echocardiographic aortic root dilatation in hypertensive patients: a systematic review and meta-analysis. J Hypertens. 2014;32(10):1928–1935. discussion 1935.
- Alegret JM, Calvo N, Ligero C, et al. Dilated aortic root is related to a global aortic dilating diathesis. J Vasc Surg. 2010;52(4):867–871.
- Franklin SS, O’Brien E, Thijs L, et al. Masked hypertension: a phenomenon of measurement. Hypertension. 2015;65(1):16–20.
- Thakkar HV, Pope A, Anpalahan M. Masked Hypertension: a Systematic Review. Heart Lung Circ. 2020;29(1):102–111.
- Hiratzka LF, Bakris GL, Beckman JA, et al. ACCF/AHA/AATS/ACR/ASA/SCA/SCAI/SIR/STS/SVM guidelines for the diagnosis and management of patients with Thoracic Aortic Disease: a report of the American College of Cardiology Foundation/American Heart Association Task Force on Practice Guidelines, American Association for Thoracic Surgery, American College of Radiology, American Stroke Association, Society of Cardiovascular Anesthesiologists, Society for Cardiovascular Angiography and Interventions, Society of Interventional Radiology, Society of Thoracic Surgeons, and Society for Vascular Medicine. Circulation. 2010;121(13):e266–369.
- Williams B, Mancia G, Spiering W, et al. ESC/ESH Guidelines for the management of arterial hypertension. Eur Heart J. 2018;39(33):3021–3104.
- Yang D, Xu D, Zhou SK, et al. Automatic Liver Segmentation Using an Adversarial Image-to-Image Network. In: Descoteaux M, Maier-Hein L, Franz A, et al., editors. Medical Image Computing and Computer Assisted Intervention − MICCAI 2017. Springer International Publishing; 2017. p. 507–515.
- Ghesu F-C, Georgescu B, Zheng Y, et al. Multi-Scale Deep Reinforcement Learning for Real-Time 3D-Landmark Detection in CT Scans. IEEE Trans Pattern Anal Mach Intell. 2019;41(1):176–189.
- Zheng Y, John M, Liao R, et al. Automatic aorta segmentation and valve landmark detection in C-arm CT for transcatheter aortic valve implantation. IEEE Trans Med Imaging. 2012;31(12):2307–2321.
- Hager A, Kaemmerer H, Rapp-Bernhardt U, et al. Diameters of the thoracic aorta throughout life as measured with helical computed tomography. J Thorac Cardiovasc Surg. 2002;123(6):1060–1066.
- The Conundrum of Arterial Stiffness, Elevated blood pressure, and Aging. Accessed 2020 Dec 26. https://www.ncbi.nlm.nih.gov/pmc/articles/PMC4524667/
- Ferrara A, Totaro P, Morganti S, et al. Effects of clinico-pathological risk factors on in-vitro mechanical properties of human dilated ascending aorta. J Mech Behav Biomed Mater. 2018;77:1–11.
- Roman MJ, Devereux RB, Niles NW, et al. Aortic root dilatation as a cause of isolated, severe aortic regurgitation. Prevalence, clinical and echocardiographic patterns, and relation to left ventricular hypertrophy and function. Ann Intern Med. 1987;106(6):800–807.
- Codari M, Pepe A, Mistelbauer G, et al. Deep Reinforcement Learning for Localization of the Aortic Annulus in Patients with Aortic Dissection. In: Petersen J, San José Estépar R, Schmidt-Richberg A, et al. editors. Thoracic Image Analysis. Springer International Publishing; 2020. p. 94–105.
- Pepe A, Li J, Rolf-Pissarczyk M, et al. Detection, segmentation, simulation and visualization of aortic dissections: a review. Med Image Anal. 2020;65:101773.
- Suh E, Ryoo J-H, Doo M, et al. Ascending aortic diameter is associated with hypertension in Korean men. Clin Invest Med. 2017;40(4):E158–E166.
- Anstey DE, Moise N, Kronish I, et al. Masked Hypertension: whom and How to Screen? Curr Hypertens Rep. 2019;21(4):26.