
ABSTRACT
Objectives
Although inter-arm blood pressure difference (IAD) and inter-ankle blood pressure difference (IAND) have been shown to be associated with cardiovascular disease, controversy remains. In this study, we investigated the prevalence of IAD and IAND as well as the correlation with arterial stiffness and systolic blood pressure in a large number of the Chinese population.
Methods
The four-limb blood pressure, IAD, IAND, brachial-ankle pulse wave velocity (baPWV) and ankle-brachial index (ABI) of 12,176 participants have been measured. Multivariate logistic regression analysis was used to analyze the relationship of the increase in IAD/IAND with arterial stiffness and blood pressure. Reporting adheres to the STROBE guidelines.
Results
In 12,176 participants, 1832 (15%) subjects had an IAD≥10 mmHg, 663 (5%) had an IAD≥15 mmHg, and 291 (2%) had an IAD≥20 mmHg. Correspondingly, 4548 (37%) had an IAND≥10 mmHg, 2706 (22%) had an IAND≥15 mmHg, and 1706 (14%) had an IAND≥20 mmHg. baPWV was significantly higher in those with an IAD≥10 mmHg (1881 ± 487 cm/s vs. 1943 ± 508 cm/s, P = 0.036) and IAND≥10 mmHg (1850 ± 476 cm/s vs. 1955 ± 509 cm/s, P = 0.000). Compared to others, those with IAD or IAND≥10 mmHg had higher systolic blood pressure (SBP), higher prevalence of hypertension, larger male gender ratio, bigger body mass index, higher pulse rate and lower ABI (P < 0.001 for all). A significant association with baPWV was observed for IAND≥10 mmHg (OR = 1.117; 95%CI: 1.039–1.201; P = 0.003) not for IAD≥10 mmHg (OR = 0.771; 95%CI: 0.699–0.851; P = 0.000) in multivariate logistic regression analysis.
Conclusions
Limb blood pressure differences were closely related to arterial stiffness and systolic blood pressure, allowing for a more comprehensive assessment of cardiovascular risk.
Introduction
The prevalence of hypertension is escalating rapidly [Citation1]. For early detection and diagnosis of hypertension, four-limb blood pressure might be measured during the initial assessment [Citation2]. More clinical data could be calculated through the difference and ratio of blood pressure in four limbs: inter-arm blood pressure difference (IAD), inter-ankle blood pressure difference (IAND), brachial-ankle pulse wave velocity (baPWV) and ankle-brachial index (ABI) [Citation2]. However, the current understanding of the distribution and normal range of IAD and IAND are not comprehensive.
Increased IAD and IAND were thought to be associated with atherosclerotic vascular damage in the systemic arterial tree [Citation3], and have been attempted as potential tools to detect peripheral artery disease (PAD) and individuals at high cardiovascular risk [Citation4]. Not only that, IAD above 5 mmHg could predict all-cause mortality, cardiovascular mortality and cardiovascular events [Citation5,Citation6]. Nonetheless, the pathological basis of IAD and IAND are not fully understood.
It is worth noting that the PWV-related researches have put forward the emerging ‘stiffness hypothesis,’ attributing IAD and IAND to asymmetric or local changes in arterial stiffness [Citation7,Citation8]. Blood pressure levels and arterial stiffness increase with aging. Some studies suggested that arterial stiffening led to higher BP because of the alteration in the buffering function of conduit arteries [Citation9]. In contrast, others shown that chronic elevation in BP resulted in arterial stiffness through its unfavorable effects on structural and functional alterations in the walls of central elastic arteries [Citation10]. Current hypertension guidelines advocate the recognition of increased arterial stiffness (carotid-femoral artery PWV, cfPWV) as hypertension-mediated organ damage (HMOD). The routine use of cfPWV measurement is impractical and not recommended, because additional testing for HMOD is unlikely to change the treatment of patients who have been identified as high-risk [Citation11,Citation12]. cfPWV is considered to be the gold standard for assessing arterial stiffness status, while baPWV also reflects the structural and functional stiffness of the arterial wall and can be used to assess arterial stiffness accurately, reproducibly, and noninvasively [Citation13,Citation14]. Recent study has found that arterial stiffness mediated the positive association between aging and BP, and arterial stiffness might precede elevated BP [Citation15]. Artery stiffness evaluated by baPWV independently predicted the risk of hypertension and the SBP level in community population [Citation16]. Meanwhile, IAD has been implicated with delayed diagnosis of hypertension and a higher prevalence of poorly controlled hypertension [Citation2]. However, the relationship between the differences in blood pressure of bilateral limbs (IAD and IAND) and arterial stiffness is still controversial. Thus, we conducted a cross-sectional retrospective study to validate the prevalence of IAD and IAND categories and investigate their correlation with arterial stiffness in a large number of Chinese population including 12,176 adults.
Methods
Study population
This research was a cross-sectional study in a single center. A group of rural and urban community residents from Kunming, Yunan, China, were recruited from August 1, 2013 to April 30, 2018. 12,625 participants were outpatients and inpatients who underwent noninvasive Vascular Examination in Yan’an Affiliated Hospital of Kunming Medical University. Participants were included following the inclusion criteria: aged 18 years or more and blood pressure measurement in four limbs. Those with incomplete blood pressure measurements and missing information were excluded. Finally, a total of 12,176 participants were included in analysis. Informed consents were obtained from all participants. The Ethics Committee of Yan’an affiliated hospital of Kunming medical university approved the study protocol.
Four-limb blood pressure measurements
The values of four-limb blood pressure were measured by a Vascular Profiler-1000 device (Omron, Kyoto, Japan), which automatically and simultaneously measures blood pressures in both arms and ankles using an oscillometric method. Appropriate-sized cuffs had been around arms and ankles and performed the measurements after at least 5 minutes rest in supine position. The accuracy of this measurement device has been validated using other well-established noninvasive BP monitoring equipment [Citation17,Citation18].
IAD and IAND measurements
IAD and IAND were defined as the systolic blood pressure difference between arms and ankles respectively. IAD was calculated as the absolute value of the left arm SBP minus the right arm SBP measured by VP1000, as was IAND. The IAD increasing group was defined as IAD≥10 mmHg, and IAND≥10 mmHg was defined as the IAND increasing group [Citation6].
baPWV and ABI measurements
baPWV value was automatically computed as the transmission distance divided by the transmission time. The transmission distance from the arm to each ankle was calculated according to body height [Citation19]. The ABI of each leg was calculated by dividing the higher of the dorsalis pedis or posterior tibial pressure by the higher of the right or left arm blood pressure [Citation20,Citation21]. baPWV and ABI were calculated for both sides simultaneously. The baPWV value on the higher side and the ABI value on the lower side were used for statistical analysis.
Clinical variables
Demographics and medical data including age, gender and medical history were collected from medical records or patient interviews by the same observer. BMI was calculated as weight divided by squared height (kg/m2). Hypertension was defined as office SBP values ≥ 140 mmHg and/or diastolic BP (DBP) values ≥ 90 mmHg [Citation11]. The researchers also recorded a history of hypertension or the use of antihypertensive drugs. Heart rate was recorded at the same time of BP measurement.
Statistics
Statistical analysis was performed using the SPSS 17.0 for windows (SPSS Inc. Chicago, USA). Continuous data are presented as mean ± standard deviation and categorical data as percentages. The differences between groups were compared by chi-square tests for categorical variables or by Independent-Samples t-Test for continuous variables, respectively. Multivariate logistic regression analysis was used to analyze the relationship between IAD and IAND increase with age, gender, BMI, pulse rate, SBP, ABI and baPWV. We defined the statistical variable assignments of ABI (≤0.9, ≤1.3, or >1.3), baPWV (≤1400 cm/s, ≤1800 cm/s, or >1800 cm/s), IAD and IAND (≤10 mm Hg or >10 mm Hg). A P value of <0.05 was considered statistically significant according to the two-tailed analysis.
Results
General characteristics of research objects
A total of 12,625 subjects were consecutively enrolled including outpatients and inpatients. Four hundred and forty-nine cases were excluded from the overall population because of their incomplete blood pressure measurements (n = 182) or missing information (n = 267). Finally, 12,176 subjects (mean age 68.31 ± 15.58 years) were included (). For 7334 (61%) male and 4842 (39%) female subjects, the mean BMI were 24.10 ± 3.09 kg/m2 vs. 23.97 ± 3.32 kg/m2 respectively. Among them, 6765 (56%) subjects were diagnosed with hypertension, 1751 (14%) subjects with type 2 diabetes mellitus and 1875 (15%) subjects with dyslipidemia. Descriptive characteristics of the cross-sectional samples are shown in .
Figure 1. The flow diagram of study participants.
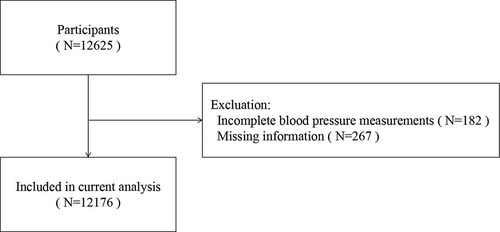
Table 1. Comparison of the general characteristics of the two groups
The prevalence of IAD and IAND
In the total sample, left arm SBP (132 ± 19 vs. 131 ± 19 mmHg, P = 0.021) and DBP (76 ± 13 vs. 75 ± 13 mmHg, P = 0.000) were higher than those in the right arm (). Among them, 51% (n = 6167) subjects had higher systolic BP in the left arm than in the right arm, 7% (n = 898) subjects had the same upper limb blood pressure, and 42% (n = 5110) subjects had higher systolic BP in the right arm than in the left arm. The Frequency distribution data of IAD and IAND were observed in the histograms (). Of 12,176 participants, 1832 (15%) had an IAD≥10 mmHg at baseline, 663 (5%) had an IAD≥15 mmHg, and 291 (2%) had an IAD≥20 mmHg. Correspondingly, 4548 (37%) had an IAND≥10 mmHg, 2706 (22%) had an IAND≥15 mmHg, and 1706 (14%) had an IAND≥20 mmHg. The number of subjects in each stratified subgroup of IAND was significantly more than that in each stratified subgroup of IAD (P = 0.000) ().
Figure 2. The Frequency distribution data of inter-arm and inter-ankle systolic blood pressure differences. A positive value means that the blood pressure on the left is higher than that on the right, and a negative value means that the blood pressure on the right is higher than that on the left.
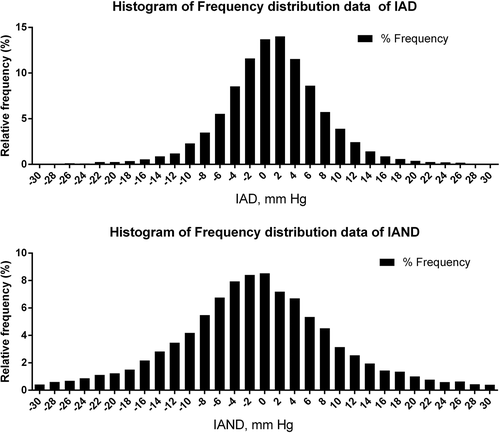
Table 2. Blood pressure difference between the bilateral limbs
Comparison between participants with different IAD and IAND
The proportion of male in the high IAD group (IAD≥10 mmHg) was higher than those in the low IAD group (IAD<10 mmHg) (66% vs. 60%, P < 0.01). Compared with the low IAD group, the mean values of BMI and pulse rate were higher in the high IAD group (P < 0.01). SBP and DBP in left arm of the high IAD group were higher than those of the low IAD group, as well as the results of SBP and DBP in the right arm. Accordingly, ABI (1.02 ± 0.14 vs. 1.07 ± 0.13, P < 0.01) was lower whereas baPWV (1942 ± 510 cm/s vs. 1881 ± 488 cm/s, P < 0.01) was higher in the high IAD group. The prevalence of hypertension in high IAD group was higher than that in the low IAD group (77.% vs. 66%, P < 0.01) ().
In the comparative observation of the IAND group, male gender ratio, age, BMI and pulse rate in the high IAND group were higher than those in the low IAND group (P < 0.01). Compared with the low IAND group, bilateral ankle SBP in the high IAND group were higher. Similarly, the ABI (1.03 ± 0.16 vs. 1.10 ± 0.10, P < 0.01) of the high IAND group was lower, while the baPWV (1955 ± 509 cm/s vs. 1850 ± 476 cm/s, P < 0.01) was higher. The prevalence rates of hypertension (57% vs. 54%, P < 0.01) in the high IAND group were significantly increased ().
The associations of clinical variables with IAD and IAND
Multivariate logistic regression analysis (Backward: Wald) showed that IAD≥10 mmHg was positively associated with age, male gender, BMI, pulse rate, SBP and ABI, but negatively associated with baPWV (). Correspondingly, IAND≥10 mmHg was positively associated with baPWV, SPB, age, male gender, BMI, pulse rate and ABI ().
Table 3. Relationship between IAD increasing (≥10 mmHg) and other cardiovascular disease risk factors by multivariate logistic regression model
Table 4. Relationship between IAND increasing (≥10 mmHg) and other cardiovascular disease risk factors by multivariate logistic regression model
Discussion
The blood pressure difference between arms in the general population is still controversial. One study of 484 Finnish participants showed that BP was 2.3/0.2 mmHg higher on right than on left arm [Citation22]. In a study involving 1426 Chinese subjects, SBP on the left arm was higher than the right, while DBP on the left arm was lower than the right [Citation23]. In our study of 12,176 Chinese subjects, the average SBP and DBP of the left arm were slightly higher than those of the right arm. Ethnic diversity, research sample size and differences in hand dominance may affect the results of different studies. However, large differences in blood pressure between arms can sometimes be a warning sign of cardiovascular disease. A systolic IAD of 10 mm Hg was taken as the upper limit of normal [Citation5]. High IAD (IAD≥10 mmHg) is associated with increased all-cause mortality, cardiovascular mortality and cardiovascular events in people with [Citation5,Citation24] or without [Citation25] vascular disease. In previous small sample studies, the incidence of high IAD were varies greatly from 4% to 19.6% [Citation7,Citation26,Citation27]. In our study with outpatients and inpatients, the prevalence of IAD≥10 mmHg was 15%, which was higher than some studies. One possible reason is that the proportion of hypertensive patients in this study (56%) was higher than the previous studies. Another reason is that the population in this study included inpatients and outpatients. The incidence of IAD abnormalities in such population is usually higher than that in community population studies [Citation28].
Currently there is no diagnostic standard for the normal value of IAND, but most researchers consider IAND≥10 mmHg or ≥15 mmHg as abnormal [Citation29]. IAND≥ 15 mmHg was a strong predictor of left ventricular hypertrophy [Citation30]. IAND was also associated with rapid progression to renal end points in patients with stage 3–5 chronic kidney disease (CKD) [Citation31]. The reported incidence of IAND≥10 mmHg in population was between 18.4% and 30.98%, while the incidence of IAND≥15 mmHg was between 7.9% and 18.6% [Citation18,Citation29,Citation30,Citation32,Citation33]. In our study, the prevalence of IAND≥10 mmHg was 37%. The prevalence of IAND≥15 mmHg and IAND≥20 mmHg were 22% and 14%, respectively. People with IAND≥10 mmHg are older and have higher SPB levels, higher baPWV and lower ABI levels than those with IAND<10 mmHg.
Studies reported that arterial stiffness represented by baPWV has correlation with IAND [Citation30,Citation32]. Our research found that the increase of baPWV was positively correlated with IAND, but negatively correlated with IAD. Blood pressure difference between both sides of upper and lower limbs depends both on stiffness and sclerotic changes of measured artery. In upper limbs, arterial stiffening is much less than lower limb because blood pressure is lower in the former than in the latter [Citation7,Citation8]. So IAD>10 mmHg is often associated with asymmetric arterial sclerotic changes in the one side of upper arm circulation. Previous report showed that IAD>15 mmHg is associated with significantly higher risk of ABI<0.9 [Citation3]. So the negative correlation between IAD>10 mmHg and baPWV may be explained partly by the presence of peripheral arterial disease.
Although the results of the study shown that there was no positive correlation between IAD and baPWV, the effect of asymmetric arteriosclerosis on the difference in blood pressure between the upper limbs cannot be ruled out [Citation34]. We found that the SBP and DBP of the high IAD and IAND groups were significantly higher than those of the low IAD and IAND groups. And the increase in SBP was also closely related to the increase in IAD and IAND. The causality between increased arterial stiffness and hypertension is complex because of many confounding factors (e.g. aging, diet, concurrent disease, life style, etc.), but recent experimental and population studies suggest that arterial stiffening precedes development of high blood pressure, and can be used to predict future hypertension and cardiovascular events [Citation13,Citation35,Citation36]. Although arterial stiffness exhibits systemic change, the occurrence and development of early arterial stiffness is usually asymmetric and uneven [Citation37], which can be manifested as an abnormal increase in IAD and IAND [Citation38,Citation39].
IAD and IAND are well correlated with arterial stiffness, and can be used as a measure of vascular function and structural characteristics to assess the preclinical stage of vascular diseases. Moreover, the increase of IAD and IAND value is accompanied by the occurrence and development of hypertension, which may be the clinical manifestations of the early development stage of hypertension. The timely detection of prehypertensive clinical manifestations is important to prevent disease progression. Brachial artery blood pressure of the upper extremity has always been the only indicator of the diagnosis, treatment and prognosis of hypertension. However, it is now possible to comprehensively assess the hazards and risks of hypertension based on the blood pressure levels of the extremities and the corresponding derived indicators [Citation6]. In conclusion, our results demonstrated that four-limb blood pressure differences were closely correlated with arterial stiffness and systolic blood pressure. The simultaneous measurement of four-limb BP can more accurately assess the blood pressure level, detect abnormal inter-limb BP difference as early as possible, and assess cardiovascular risk more comprehensively.
Limitations
There were some limitations in this study. First, the study was cross-sectional, so causality and long-term clinical outcomes could not be determined. Future prospective studies will be considered to address this issue. Second, the subjects included in this study were older, most of whom were hypertensive, and those with high baPWV levels, so the results may not be fully applicable to the younger healthy population. Third, because it is included in the hospital for noninvasive arteriosclerosis detection as a research object, it is susceptible to selection bias, thereby reducing the universality of the discovery. Fourth, Further history of cardiovascular disease (myocardial infarction, stroke, medication for hypertension, atrial fibrillation, etc.) was not included in this study, so a more in-depth analysis could not be performed.
Perspectives
More large-scale prospective studies based on four-limb BP interventions are needed to find out the relationship of abnormal arterial stiffness, blood pressure changes and increased IAD or IAND. Future studies are warranted to address whether earlier assessment of arterial stiffness and wave reflections can lead to earlier initiation of antihypertensive treatment and result in more effective prevention of cardiovascular complications.
Author contributions
YWH conceived the study, made the design, performed the statistical analyses, and drafted the manuscript. HY and GLL participated in the design and statistic work. GLL and XXC collected data. GT and YL revised the paper. All authors gave final approval and agree to be accountable for all aspects of work ensuring integrity and accuracy.
Declaration of funding
The present study was financially supported by the National Natural Science Foundation of China [grant number 81,860,055]; and the Department of Science and Technology of Yunnan Province-Kunming Medical University Joint Research Project [grant number 2019FE001(−100)]; and the High-level scientific and technological talent project in Yunnan Province [grant number 202005AC160070]. The funders had no role in the study design, data collection and analysis and preparation of the manuscript.
Declaration of conflicting interests
The authors have no relevant conflicts of interest to disclose. Peer reviewers on this manuscript have no relevant financial or other relationships to disclose.
Acknowledgments
The authors would like to thank all the participants and medical staff who contributed to this study.
References
- Mills KT, Stefanescu A, He J. The global epidemiology of hypertension. Nat Rev Nephrol. 2020;16(4):223–237.
- Clark CE. Four-limb blood pressure measurement: a research tool looking for clinical use. Hypertension. 2013;61(6):1146–1147.
- Tomiyama H, Ohkuma T, Ninomiya T, et al. Collaborative group for J-BAVEL-IAD (Japan Brachial-Ankle pulse wave velocity individual participant data meta-analysis of prospective studies to examine the significance of inter-arm blood pressure difference). Simultaneously measured interarm blood pressure difference and stroke: an individual participants data meta-analysis. Hypertension. 2018;71(6):1030–1038.
- Liu S, Li P, Su H. Four-limb blood pressure measurement with an oscillometric device: a tool for diagnosing peripheral vascular disease. Curr Hypertens Rep. 2019;21(2):15.
- Verberk WJ, Kessels AGH, Thien T. Blood pressure measurement method and inter-armdifferences: a meta-analysis. Am J Hypertens. 2011;24(11):1201–1208.
- Clark CE, Warren FC, Boddy K, et al. Associations between systolic interarm differences in blood pressure and cardiovascular disease outcomes and mortality: individual participant data meta-analysis, development and validation of a prognostic algorithm: the INTERPRESS-IPD collaboration. Hypertension. 2021;77(2):650–661.
- Canepa M, Milaneschi Y, Ameri P, et al. Relationship between inter-arm difference in systolic blood pressure and arterial stiffness in community-dwelling older adults. J Clin Hypertens. 2013;15(12):880–887.
- Giles TD. Inter-arm difference in systolic blood pressure-”the plot stiffens”. J Clin Hypertens (Greenwich). 2013;15(12):878–879.
- Takase H, Dohi Y, Toriyama T, et al. Brachial-ankle pulse wave velocity predicts increase in blood pressure and onset of hypertension. Am J Hypertens. 2011;24(6):667–673.
- Mitchell GF. Arterial stiffness and hypertension. Hypertension. 2014;64(1):13–18.
- Williams B, Mancia G, Spiering W, et al. 2018 ESC/ESH guidelines for the management of arterial hypertension. Eur Heart J. 2018;39(33):3021–3104.
- Unger T, Borghi C, Charchar F, et al. 2020 international society of hypertension global hypertension practice guidelines. J Hypertens. 2020;38(6):982–1004.
- Tanaka H, Munakata M, Kawano Y, et al. Comparison between carotid-femoral and brachial-ankle pulse wave velocity as measures of arterial stiffness. J Hypertens. 2009;27(10):2022–2027.
- Tsuchikura S, Shoji T, Kimoto E, et al. Brachial-ankle pulse wave velocity as an index of central arterial stiffness. J Atheroscler Thromb. 2010;17(6):658–665.
- Wu S, Jin C, Li S, et al. Aging, arterial stiffness, and blood pressure association in Chinese adults. Hypertension. 2019;73(4):893–899.
- Jiang Y, Fan F, Jia J, et al. Brachial-ankle pulse wave velocity predicts new-onset hypertension and the modifying effect of blood pressure in a chinese community-based population. Int J Hypertens. 2020;2020:9075636.
- Pan CR, Staessen JA, Li Y, et al. Comparison of three measures of the ankle-brachial blood pressure index in a general population. Hypertens Res. 2007;30(6):555–561.
- Sheng CS, Liu M, Zeng WF, et al. Four-limb blood pressure as predictors of mortality in elderly Chinese. Hypertension. 2013;61(6):1155–1160.
- Munakata M. Brachial-ankle pulse wave velocity in the measurement of arterial stiffness: recent evidence and clinical applications. Curr Hypertens Rev. 2014;10(1):49–57.
- Aboyans V, Criqui MH, Abraham P, et al. American Heart Association Council on peripheral vascular disease; council on epidemiology and prevention; council on clinical cardiology; council on cardiovascular nursing; council on cardiovascular radiology and intervention, and council on cardiovascular surgery and anesthesia. Measurement and interpretation of the ankle-brachial index: a scientific statement from the American Heart Association. Circulation. 2012;126(24):2890–2909.
- Whelton PK, Carey RM, Aronow WS, et al. 2017 ACC/AHA/AAPA/ABC/ACPM/AGS/APhA/ASH/ASPC/NMA/PCNA guideline for the prevention, detection, evaluation, and management of high blood pressure in adults: a report of the American College of Cardiology/American heart association task force on clinical practice guidelines. Hypertension. 2018;71(6):e13–e115.
- Johansson JK, Puukka PJ, Jula AM. Interarm blood pressure difference and target orga-n damage in the general population. J Hypertens. 2014;32(2):260–266.
- Ma W, Zhang B, Yang Y, et al. Correlating the relationship between interarm systolic blood pressure and cardiovascular disease risk factors. J Clin Hypertens. 2017;19(5):466–471.
- Clark CE, Taylor RS, Shore AC, et al. Association of a difference in systolic blood pressure between arms with vascular disease and mortality: a s-ystematic review and meta-analysis. Lancet. 2012;379(9819):905–914.
- Clark CE, Taylor RS, Butcher I, et al. Inter-arm blood pressure difference and mortality: a cohort study in an asymptomatic primary care population at elevated cardiovascular risk. Br J Gen Pract. 2016;66(646):e297–e308.
- Grossman A, Prokupetz A, Gordon B, et al. Inter-arm blood pressure differences in young, healthy patients. J Clin Hypertens (Greenwich). 2013;15(8):575–578.
- Clark CE, Taylor RS, Shore AC, et al. Prevalence of systolic inter-arm differences in blood pressure for different primary care populations: systematic review and meta-analysis. Br J Gen Pract. 2016;66(652):e838–e847.
- Singh S, Sethi A, Singh M, et al. Simultaneously measured inter-arm and inter-leg systolic blood pressure differences and cardiovascular risk stratification: a systemic review and meta-analysis. J Am Soc Hypertens. 2015;9(8):640–650.e612.
- Chen S-C, Chang J-M, Tsai Y-C, et al. Association of interleg bp difference with overall and cardiovascular mortality in hemodialysis. Clin J Am Soc Nephrol. 2012;7(10):1646–1653.
- Su HM, Lin TH, Hsu PC, et al. Association of interankle systolic blood pressure difference with peripheral v-ascular disease and left ventricular mass index. Am J Hypertens. 2014;27(1):32–37.
- Chen SC, Tsai YC, Huang JC, et al. Interankle systolic blood pressure difference and renal outcomes in patients with chronic kidney disease. Nephrology. 2016;21(5):379–386.
- Guo H, Sun F, Dong L, et al. The association of four-limb blood pressure with history of stroke in Chinese adults: a cross-sectional study. PloS One. 2015;10(10):e0139925–e0139925.
- Zhang Z, Ma J, Tao X, et al. The prevalence and influence factors of inter-ankle systolic blood pressure difference in community population. PloS One. 2013;8(8):e70777.
- Clark CE. The interarm blood pressure difference: do we know enough yet? J Clin Hypertens. 2017;19(5):462–465.
- Oh YS, Berkowitz DE, Cohen RA, et al. A special report on the nhlbi initiative to study cellular and molecular mechanisms of arterial stiffness and its association with hypertension. Circ Res. 2017;121(11):1216–1218.
- Kaess BM, Rong J, Larson MG, et al. Aortic stiffness, blood pressure progression, and incident hypertension. JAMA. 2012;308(9):875–881.
- Dumor K, Shoemaker-Moyle M, Nistala R, et al. Arterial stiffness in hy-pertension: an update. Curr Hypertens Rep. 2018;20(8):72.
- Mitchell GF, Hwang SJ, Vasan RS, et al. Arterial stiffness and cardiovascular events: the framingham heart study. Circulation. 2010;121(4):505–511.
- Niiranen TJ, Kalesan B, Larson MG, et al. Aortic-brachial arterial stiffness gradient and cardiovascular risk in the community: the framingham heart study. Hypertension. 2017;69(6):1022–1028.