
ABSTRACT
Density variations in pressed powder materials are of substantial importance and will affect shrinkage and geometry after sintering. It is therefore important to accurately measure this quantity in green bodies. This is emphasised by the fact that the density variation can be used for determining material properties in constitutive mechanical models of compaction. An obvious method to determine the density variation is X-ray tomography. For cemented carbides this is not a possible alternative due to the very high X-ray absorption of tungsten making the samples impossible to penetrate. Neutron radiation has a much higher penetration and this suggests that a neutron source could be used for density distribution determination in such materials. This was investigated currently showing promising results when compared with finite element predictions. It is clear that this approach must be improved to be able to use neutron radiation as a tool for density determination. Improvements are suggested.
1. Introduction
Classic cutting inserts are manufactured by compacting hardmetal powder blends into a predefined shape followed by sintering to full density and post-treatment. When designing a new cutting insert, the shape of the pressing tool is often an issue, since the density after compaction and therefore also the shrinkage during sintering is uneven and hard to predict. It is a well-known fact that the final geometry of an insert after sintering is very much dependent on the density variation in the compacted and ejected green body, cf. [Citation1-3]. Accordingly, it is of substantial practical importance to be able to determine such density variations in an accurate manner. Determining density variations is also important when it comes to constitutive modelling of compacted powder materials. Such models are most often very complicated [Citation4-7] and include a large number of material constants (functions). Knowledge about the density variation in such materials is then very useful for constitutive characterisation through, for example, inverse modelling when standard mechanical testing is not sufficient [Citation8-11].
A possible tool for determining density variations in green bodies would be to use X-ray tomography (CT). However, when cemented carbides are at issue this is not an option though due to the very high X-ray absorption of tungsten (W). Indeed, this absorption makes it impossible to penetrate the samples unless they are single granules of millimetre size.
With this as a background, it is therefore suggested to use a neutron source for the purpose of density measurements in cemented carbide powder materials. Neutron radiation has a much higher penetration when compared to X-ray and could then possibly overcome the difficulties encountered when using CT. To the author's knowledge such an approach has not been investigated previously in the literature, at least not for industrially relevant insert geometries.
The measurements were performed using a neutron source at the Leon Brillouin laboratory in Saclay, France. In short, to be discussed in much more detail below, radiograph measurements were conducted and data was analysed and discussed in the context of density of the green bodies, the measurement accuracy and artefact reduction. The results were compared with finite element predictions and possible improvement of the approach is suggested.
2. Measurements and samples
The facility at the Leon Brillouin laboratory has a 14 MW neutron source, with a polychromatic neutron band ranging from 3 to 15 Å and a peak intensity of 4 Å. The flux of the beam (at least at the Imagine station used) is 107 neutrons cm−2 s−1. The detector roughly detected 1/10th of the neutrons hitting it.
The measurement procedure is in many regards similar to CT measurements (it should be noted though that the neutron beam is a parallel beam in contrast to the cone beam used in many CT systems). The sample is mounted between the neutron source and the detector and the intensity of the transmitted beam is measured. To correct for the inhomogeneity of the beam flux in different areas of the detector an ‘empty beam image’ is used to calibrate the detector image. Also, a known background signal is subtracted from the measured signal and time variation of the flux is corrected by continuously measuring an area outside the sample.
The system set up results in no geometric sample magnification and instead the sample can be placed as close to the detector as possible to reduce neutron scattering effects and noise. The resolution is limited by the detector pixel size, neutron scattering and the convergence of the neutron beam (i.e. how parallel it really is) and was found to be well below 100 μm.
When performing radiographs an exposure time of 30 s was used and 5–10 projections were averaged to obtain good statistics. Longer exposure time than 30 s resulted in a saturated detector signal outside the sample. Radiograph images were averaged and analysed in ImageJ [Citation12].
The powder used to produce the test specimens is a WC-Co mixture with a grain size of approximately 0.8 μm. It is spray dried and contains 2% PEG, 10% Co and 0.5% Cr (measured in weight). During compaction the powder volume is decreased to about half.
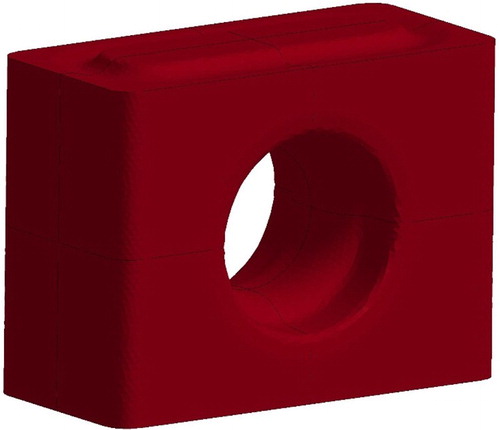
A cutting insert geometry, see , as well as calibration (reference) samples (rods) are used currently, all produced with the same powder. The reference samples are manufactured with hydrostatic compaction and have an even density. They have a diameter of 9.4 mm and are cut into different heights. The powder compact of a cutting insert is shown in and is compacted from top and bottom as standing in .
Figure 1. Cutting insert geometry.
3. Fe simulations
In order to evaluate the effectiveness of the present approach, the experimental outcome was compared to corresponding numerical results based on the finite element method (FEM). FEM-simulations of the currently used cutting insert geometry have been performed elsewhere [Citation3,Citation11] and for details about the finite element approach these studies are referred to.
Concerning the constitutive modelling it suffices to say that the material model used in this study was originally presented in Ref. [Citation7] (and utilised in for example [Citation3,Citation11]) is an elastic–plastic model with a yield surface of Drucker–Prager CAP kind. To determine the yield surface an elliptic cap part fCAP and a quadratic failure curve ffailure, as a function of relative density d (density divided by sintered density), the first invariant of the Cauchy stress tensor σI and the second invariant of the deviatoric stress tensor σII, is defined in Equations (1)–(5).
The function fCAP and ffailure yields(1)
(2) where R, L, X(d) and Y(d) are material parameters and
(3)
(4)
(5)
An offset ϕ from the associative flow direction is determined as a function of the proportion between deviatoric and volumetric stress Jϕ defined by(6) Further the material model accounts for anisotropy, described as the intensity of plastic anisotropy e and resulting in kinematic hardening. The back stress κ gives kinematic hardening by, in the yield function, replacing σ with σ−κ. A second order stretch tensor P defined in [Citation7] is coaxial with κ as shown in Equation (7), yielding an explicit expression for the back stress
(7) where P’ and P'II are the deviator and second invariant of P, respectively, h is a scaling function and e is updated based on the evolution of plastic shear strain, deviatoric plastic work and volumetric plastic work defined by the linear constants ca, cd and cv. The hyperelastic behaviour is assumed to be isotropic and described with density-dependent bulk modulus K(d) and Poisson’s ratio ν.
Explicit values on the material constants and functions described above have been presented previously in for example [Citation11]. These values are directly relevant for the currently analysed WC-Co mixture.
The finite element simulations were performed using the commercial finite element programme LS-Dyna [Citation13] utilising explicit time-integration. The material model in [Citation7] is implemented in LS-Dyna [Citation14]. The mesh describing the powder (cutting insert) consists of 150 000–250 000 one-point tetrahedron elements as shown in . Remeshing is performed during the compaction process. Pressing tools are assumed to be rigid, and modelled with shell elements, and contact is described by the Coulomb friction law(8) where p is the normal pressure, τ is the shear stress due to friction and μ is the frictional coefficient taking on the value
(9)
Figure 2. Finite element mesh before compaction. Because of symmetry only one-eighth of the insert is analysed.
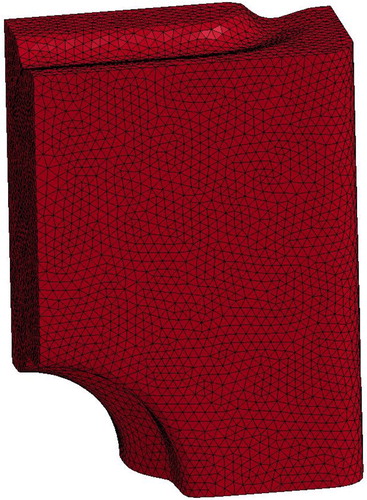
The value in (9) is chosen in order to include relevant values reported in the literature in the context of frictional effects at pressing [Citation15].
A ‘virtual radiography’ is produced from the FE-simulation result. Density after compaction is plotted in grey scale and plots from 50 evenly distributed cuts in depth are saved in picture format. Those pictures are later summarised in ImageJ [Citation12], i.e. the sum of the grey value in depth is used to produce a radiograph from the FE-simulations that can be compared to the actual measurement results. In other words, all 50 pictures are stacked on top of each other and the grey value for each pixel is summarised. The effect from varying thickness of the specimen is then also accounted for.
4. Results and discussion
The four hydrostatically pressed rods of different length were, as mentioned above, used as calibration samples to measure the transmittance of the neutron beam in the cemented carbide material. The Beer-Lamberts law is shown in Equation (10).(10) where transmitted intensity I, beam intensity I0, the material linear absorption coefficient (LAC) α and sample thickness x are related accordingly. LAC in turn is a product of mass absorption coefficient (MAC), which is a material constant, and density.
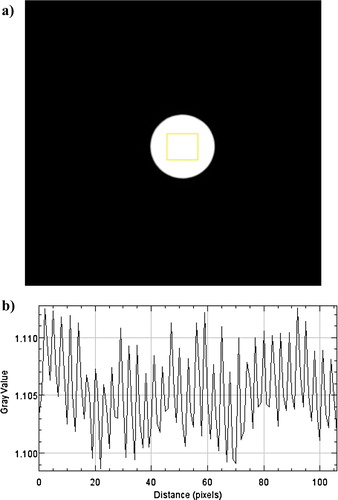
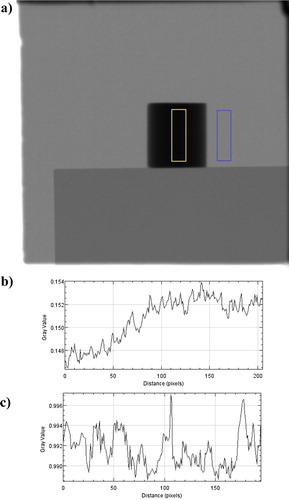
Equation (10) holds for a monochromatic radiation with no scattering or small angle scattering. For a polychromatic beam, used in these experiments, a filtering effect called ‘beam hardening’ occurs due to the different MAC of different neutron energies. This will result in deviations from Equation (10) and artefact gradients in the tomography where material in the middle of the sample will appear less dense compared to the material at the surface. By measuring the transmittance in the calibration rods this effect could be validated and corrected for. In (a) a negative log image of the 5 mm thick calibration sample is shown, i.e. the grey value in this case equals αx (compare Equation (10)). In (b) the grey value along the horizontal direction (in the yellow square indicated in (a)) is shown. Since the thickness x is known, LAC can be calculated from the graph.
Figure 3. Analysis of the calibration rod with length 5 mm. (a) Negative logarithmic image of the relative intensity I/I0, i.e. αx. Note the box indicated in the picture. (b) The quantity αx (grey value) along the horizontal direction starting from the left side of the yellow box in (a).
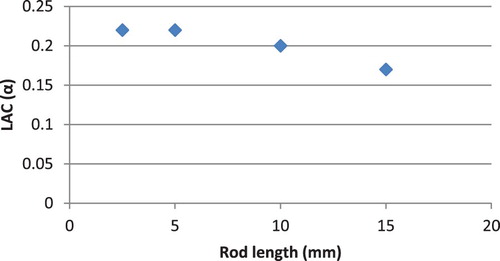
Consequently, all four calibration rods with length 2.5, 5, 10 and 15 mm were radiographed so that the neutron beam penetrated through the length of each rod and from this, α was calculated for each sample. The result is depicted in where it is clear that the LAC for the two thinner samples is the same but for the two longer rods LAC begins to decline. Clearly, there is an effect from beam hardening that has to be taken into consideration. Also it should be mentioned that the 2% PEG that is included in the powder material contains hydrogen, which could give rise to scattering. This will be subject for further investigation in coming research.
Figure 4. LAC (α) as function of calibration rod length.
In (a) radiograph of one of the calibration rods is shown. The rod is placed standing so that it is penetrated through the thickness of the rod. A blue and yellow square is indicated in (a) and then in (b), the relative intensity I/I0, inside the yellow square, starting from the top, is shown. As can be seen it appears to be a density gradient in the sample but since it is hydrostatically pressed this should not be the case. The sample was therefore flipped upside down and measured again. The same type of gradient going from top to bottom (in the detector) was then seen. This experiment was repeated for several samples, among them a copper rod, and the same error was discovered. (c) shows the relative intensity for the blue square in (a) and it can be seen that the gradient is not visible outside the sample. This indicates that the error is not due to bad detector calibration. It should be mentioned though that the levels of fluctuation inside the blue square is close to being in the same range as the gradient in (b).
Figure 5. Analysis of a calibration rod standing up. (a) Relative intensity I/I0 radiograph with two boxes indicated. (b) Relative intensity I/I0 (grey value), in the vertical direction starting from the top in the left box in (a). (c) Relative intensity I/I0 (grey value), in the vertical direction starting from the top in the right box in (a).
The size of this bias gradient was around 0.5% in relative transmitted intensity depending on sample size and length. By moving the sample around in the detector image it was also seen that this error could be minimised by placing the sample exactly in the so-called sweet spot of the neutron beam where the flux is highest. The reason for this systematic error is not fully understood but it is likely due to the very high absorption of neutron by the samples. The transmission through our samples was often 10–15%. This suggests that it would advantageous to perform further testing at a facility with a thermal neutron source. Another possible explanation is the inhomogeneity of the neutron beam in the plane perpendicular to the beam direction.
Having so discussed the results pertinent to the calibration samples, it now seems appropriate to discuss the corresponding ones for the real cross hole insert geometry described above. Accordingly, in a virtual radiograph based on the FE-simulations is shown, where the grey value corresponds to αx. These results should be compared with the experimental ones in (c) (further discussed below). It should be mentioned that the density difference is small (±10–20%) and this of course makes the measurement very challenging. Apart from the asymmetry in the measured radiograph, there is at least a qualitative agreement when comparing the measured density distribution with the corresponding FE-result.
Figure 6. ‘Virtual radiograph’ showing αx, produced from 50 cuts in depth of FE-results for the density. he darker areas above and below the hole corresponds to a high value on the density and the darker areas left and right of the hole to an equivalently low value.
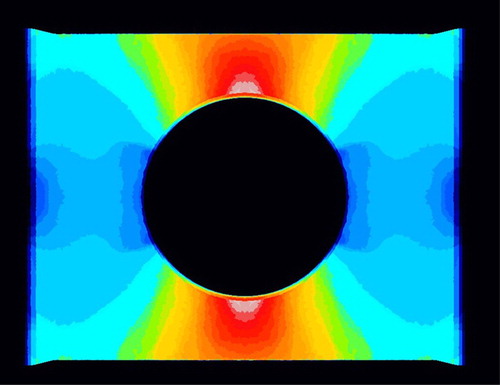
Figure 7. Analysis of a cross hole insert. (a) Relative intensity I/I0 radiograph with a box indicated. (b) Relative intensity I/I0 (grey value), in the horizontal direction starting from the left side of the box in (a). (c) Colour coded radiograph showing αx in the same manner as for . As in ,the darker areas above and below the hole corresponds to a high value on the density and the darker areas left and right of the hole to a low value.
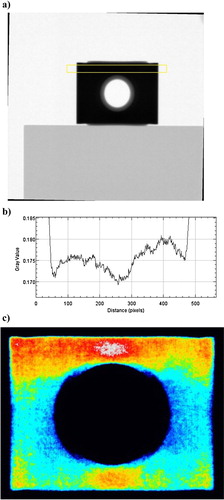
(a) shows a radiograph of a cross hole insert with a yellow box indicated. The relative intensity I/I0 along the horizontal directions inside the yellow square are then shown in (b). As can be seen in the intensity should be symmetric, which also can be confirmed by flipping the sample in the same manner as the calibration rod in . When flipping the sample and putting it in the same spot, the radiograph more or less stays the same. This is likely due to the bias error explained above. Having in mind the small density difference, this results should however be considered promising at least from a qualitative point of view.
As a final comment it should be emphasised again that this is a first attempt to determine density variations in WC-Co powder compacts. Previous efforts using X-ray has failed due to the very high X-ray absorption of tungsten (W) which of course is unfortunate remembering that knowledge of the density variation is fundamental due to many reasons. The present study establishes the important fact that neutron radiation is a possible route to determine this field variable even though it also shows that additional efforts have to be made in order to achieve accurate and reliable information about the density. For powder related applications this is a very encouraging result as, naturally, the final shape of the sintered product relies heavily on the density variation in the compacted part and in addition, knowledge about the density variation in such materials is very useful for constitutive characterisation through, for example, inverse modelling when standard mechanical testing is not sufficient [Citation8-11].
Conclusions
The present investigation deals with the usage of a neutron source to determine the density distribution in compacted cemented carbide powder compounds. The results can be briefly summarised as follows:
Neutron radiation has a higher penetration in cemented carbide compared to X-rays. This makes it possible to perform radiographs of cemented carbide samples.
Since the penetration of the neutron source currently is low, it is suggested to do further tests at a facility with a thermal neutron source.
The density variation in green body samples could be measured at least in a qualitative manner. It is believed that additional efforts can make the measurements more quantitative.
Artefacts and beam hardening affects the results and this has to be carefully accounted for when analysing the results, especially when looking for small density gradients.
Scattering from hydrogen in PEG must be analysed further as well as the influence from uneven beam intensity in the plane perpendicular to the beam direction.
Acknowledgement
The authors are grateful to SINE 2020 (funded by the European Union through the H2020 programme) for making it possible to perform the measurements at the Leon Brillouin laboratory where Dr. Frederic Ott was of invaluable assistance.
Disclosure statement
No potential conflict of interest was reported by the authors.
Notes on contributors
Hjalmar Staf is Senior Research Engineer at Sandvik Coromant and PhD Student at the Department of Solid Mechanics, Royal Institute of Technology, Stockholm. His main research area is powder pressing technology and powder compaction modelling.
Elias Forssbeck Nyrot is Development Engineer at Sandvik Coromant in Gimo, Sweden. He main area of expertise is Electron Probe Micro Analysis (EPMA), image analysis and X-ray Computed Tomography (XCT).
Per-Lennart Larsson is Professor at the Department of Solid Mechanics, Royal Institute of Technology, Stockholm, Sweden. His main research area is contact mechanics with applications to hardness testing, particle contact and powder compaction.
References
- Ågren J, Brandt J, Haglund SA, et al. Modelling solid state sintering of cemented carbides. In Sintering 1995–1996. New York: Marcel Dekker Inc.; 1996.
- Haglund SA, Ågren J, Lindskog P, et al. Solid state sintering of cemented carbides. In Sintering 1995–1996. New York: Marcel Dekker Inc.; 1996.
- Staf H, Olsson E, Lindskog P, et al. On rate-dependence of hardmetal powder pressing of cutting inserts. Powder Metall. 2017;60:7–14. doi: 10.1080/00325899.2016.1260904
- Gurson AL. Continuum theory of ductile rupture by void nucleation and growth. 1. Yield criteria and flow rules for porous ductile media. J Eng Mater Technol-Trans ASME. 1977;1:2–15. doi: 10.1115/1.3443401
- Schofield A, Wroth CP. Critical state soil mechanics. New York: McGraw-Hill; 1968.
- DiMaggio FL, Sandler IS. Material model for granular solids. J Eng Mech Div ASCE. 1971;96:935–950.
- Brandt J, Nilsson LG. A constitutive model for compaction of granular media, with account for deformation induced anisotropy. Mech Cohesive – Friction Mater. 1999;4:391–418. doi: 10.1002/(SICI)1099-1484(199907)4:4<391::AID-CFM68>3.0.CO;2-0
- Lindskog P, Andersson DC, Larsson PL. An experimental device for material characterization of powder materials. J Test Eval. 2013;41:504–516. doi: 10.1520/JTE20120107
- Andersson DC, Lindskog P, Staf H, et al. A numerical study of material parameter sensitivity in the production of hard metal components using powder compaction. J Mater Eng Perform. 2014;23:2199–2208. doi: 10.1007/s11665-014-0989-5
- Andersson DC, Lindskog P, Larsson PL. Inverse modeling applied for material characterization of powder materials. J Test Eval. 2015;43:1005–1019. doi: 10.1520/JTE20130266
- Staf H, Lindskog P, Andersson DC, et al. On the influence of material parameters in a complex material model for powder compaction. J Mater Engng Perform. 2016;25:4408–4415. doi: 10.1007/s11665-016-2294-y
- ImageJ, open source code at http://imagej.net
- Hallqvist JO. LS-Dyna theory manual. Livermore: LSTC; 2006.
- LS-Dyna Keyword User’s Manual II, material models, 1278–1284; 2016, Livermore, LSTC, 7122.
- Samuelsson P, Bolin B. Experimental studies of frictional behavior of hard metal powder sliding on cemented carbide walls. Scand J Metall. 1983;12:315–322.