
 ?Mathematical formulae have been encoded as MathML and are displayed in this HTML version using MathJax in order to improve their display. Uncheck the box to turn MathJax off. This feature requires Javascript. Click on a formula to zoom.
ABSTRACT
This study focuses on the processability of four low-alloy steels (AISI 4130, 4140, 4340 and 8620) via laser-based powder bed fusion (LB-PBF). In the as-built condition, the alloys consisted of tempered martensite that was the result of an intrinsic heat treatment (IHT) during LB-PBF. In terms of defects, a distinct transition in porosity was observed that correlated to the volumetric energy density (VED). At low VED, specimens contained a lack of fusion porosity, while at high VED, they contained keyhole porosity. Additionally, cold cracking was observed in 4140 and 4340 specimens produced at low/intermediate VEDs. This cracking could be mitigated by increasing the VED or laser power, as both enhance the IHT. This enhanced IHT lowered the material hardness below specific thresholds (<500HV 4340 and <460 4140), increasing ductility and allowing the specimens to avoid cracking. From these findings, crack-free, high-density (>99.8%) low-alloy steel specimens were produced without the requirement of build plate preheating.
Introduction
To date, the number of commercially available alloys for laser-based powder bed fusion (LB-PBF) remains limited. This is especially true for ferrous alloys, most of which are restricted to low-carbon contents (<0.05 wt-%), as this makes them easier to process with LB-PBF. However, this lack of carbon in ferrous alloys limits the use of LB-PBF components in structural applications and for functional prototyping.
In these applications, a cheap and robust material is required, providing a use case for low-alloy steels, which offer good hardness, strength, ductility, toughness and wear resistance while still maintaining a low cost [Citation1Citation2]. The higher carbon content (0.2–0.6 wt-%) of low-alloy steels noticeably improves the hardenability of the material, providing a high strength and toughness. However, this increased hardenability has proven to be a challenge during LB-PBF, as it promotes the formation of martensite due to the rapid cooling rates that occur during processing [Citation3]. This, combined with residual stresses from rapid cooling [Citation4–6] and the transformation of martensite [Citation7Citation8], can lead to cracking within the material that will significantly affect the processability of such materials when using LB-PBF.
A number of low-alloy steels have already been successfully processed with LB-PBF, including HY100 [Citation9], AF9628 [Citation10], 4130 [Citation11], 4140 [Citation12–14] and 4340 [Citation15Citation16]. These studies indicate that build plate preheating is advised to successfully minimise cold cracking within the as-built components. However, there is still a general lack of knowledge regarding the effect of LB-PBF processing parameters on crack formation and mitigation. In addition, almost no work has been done on the propensity for cracking when build plate preheating is not applied.
Understanding the types of defects, their characteristics (size, shape, location, etc.) and their formation mechanism(s) is extremely important when developing robust processing windows for additively manufactured components that achieve the desired mechanical properties [Citation17Citation18]. The present study aims to provide a basic understanding of the microstructure and defects that form during LB-PBF for a variety of low-alloy steels (AISI 4130, 4140, 4340 and 8620) when no build plate preheating is applied. This is done by investigating the types of defects formed in relation to the applied LB-PBF processing parameters. Ultimately, the study defined processing windows for each examined alloy that produced high-density (>99.8%), defect-free specimens without the requirement of build plate preheating.
Materials and methods
Materials
Low-alloy steel powder produced via open furnace metallurgy and gas atomisation, provided by Sandvik Additive Manufacturing (Osprey® powder) and Höganäs AB, was used as the feedstock material in this study. The chemical composition of each powder is listed in . Analysis of the AISI 4140 alloy involved two compositions, a high-carbon variant and a low-carbon variant, referred to as 4140HC and 4140LC, respectively. The AISI 4140LC, 4340 and 8620 powder grades had a supplied sieve fraction of 15–45 µm, while the AISI 4130 and 4140HC powder grades had a supplied sieve fraction of 20–53 µm. The corresponding D10, D50 and D90 values of each powder grade are listed in .
Table 1. Chemical composition of the examined low-alloy steel powder grades in wt-%.
Table 2. Particle size distribution of the examined low-alloy steel powder grades.
LB-PBF specimen fabrication
LB-PBF was performed with an EOS M100 machine (EOS GmbH, Germany) equipped with a Yb-fibre laser that had a maximum laser power of 200 W and a beam diameter of ∼40 µm. During processing, an Ar atmosphere was maintained within the build chamber, where the oxygen content was kept at ∼0.1%. In addition, no build plate preheating was used during processing.
Volumetric energy density (VED) was used to represent the energy input. It is a function of the laser power (P), hatch spacing (h), scan speed (v) and layer thickness (t):
(1)
(1)
Fabrication of 10 × 10 × 10 mm3 specimens was done in a VED range of 60–220 J mm−3. In this study, two parameters – the layer thickness (20 µm) and the hatch spacing (70 µm) – were fixed when altering the VED, as previous investigations with iron powder have found these values to provide adequate overlap between deposited melt tracks and layers [Citation19]. When altering the VED, three different levels of laser power were used: 110, 140 and 170 W. Using these sets of parameters, the VED was changed by adjusting the scan speed from 350 to 2000 mm s−1. The scanning strategy for the specimens involved a 5 mm stripe pattern and a scan rotation angle of 67° between each layer. In addition, no outer-skin or top-skin parameters were used during exposure.
Heat treatment of as-built specimens
Selected specimens underwent additional heat treatment following LB-PBF. This involved either (i) quenching, entailing austenisation at 900 °C for 1 h, followed by quenching in oil or (ii) quenching and tempering, entailing the same austenisation and quenching procedure used in (i), followed by tempering at 500 °C for 2 h. The aforementioned heat treatments were performed in a Carbolite CWF 1200 box furnace, where an inert atmosphere of Ar gas (99.998%) was maintained during each heat treatment.
Metallography and specimen analysis
Metallography involved sectioning the as-built specimens parallel to the build direction (XZ). Subsequently, the specimens were mounted, ground and polished down to 1 µm with diamond paste using a Struers TegraPol machine. After polishing, selected specimens were etched using nital (3%). Images of etched and unetched specimen cross-sections were collected using a Zeiss Axiovision 7 optical microscope (OM) and a Leo Gemini 1550 high-resolution scanning electron microscope (HR-SEM).
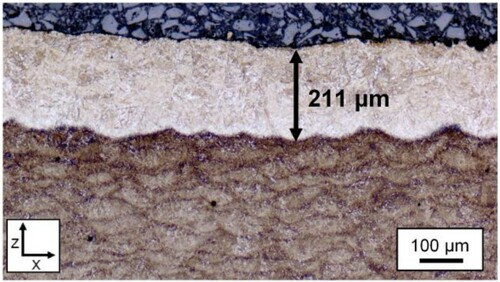
The as-built specimen density was measured via OM images of unetched XZ specimen cross-sections using ImageJ analysis software [Citation20]. The melt pool depth was estimated by measuring the top layer of etched specimens (see ). For each set of processing parameters, 10–15 melt pool depth measurements were conducted.
Figure 1. OM image of the unetched top layer found in an AISI 4140LC specimen produced at 160 J mm−3 using a 140 W laser power. Measurement of the melt pool depth was conducted by measuring the depth of this unetched top layer using ImageJ software. An example measurement of the melt depth (as well as the corresponding value) is included in the figure using a black line and text.
In select specimens () the roundness and aspect ratio of the pores was analysed to define the pore shape, while the size distribution of the pores, based on the feret diameter, was analysed to define the pore size and overall size distribution. Any pore with an area <20 µm2 was filtered out to reduce noise. Additionally, all cracks in the material were excluded during this analysis and all OM images had a resolution of at least 1.08 µm per pixel.
Table 3. VED chosen for porosity image analysis. All listed specimens were fabricated using a 140 W laser power.
Fractography analysis was conducted on select specimens that displayed cracking defects. To prepare these specimens, a 1–2 mm incision was made on the specimen surface in a direction that was parallel to a crack on the opposite specimen surface. This incision was then used to fracture the specimen to reveal said crack, which was subsequently evaluated using SEM.
Measurement of the bulk hardness was conducted on as-built and heat-treated specimens. These measurements involved 16 HV10 indentations that were spaced 2 mm apart. Measurement of the microhardness across the crack interface was conducted on select as-built AISI 4140LC, 4140HC and 4340 specimens. These measurements involved six HV0.1 indentations above and below the crack interface that were spaced 0.1 mm apart. A DuraScan 70-G5 machine was used for all hardness indentation measurements.
Results and discussion
Porosity in as-built specimens
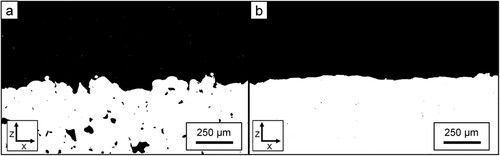
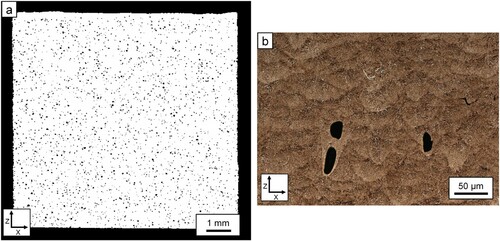
Measurement of the as-built specimen density revealed its strong dependence on the VED, where three distinct regions could be identified (see ). At low VED (Region I), irregularly shaped pores (up to 500 µm in size) could be found within the as-built specimens (see ). These characteristics, coupled with the presence of unmelted powder particles, helped identify them as lack of fusion defects [Citation21Citation22]. The formation of the lack of fusion porosity at these low VEDs was not caused by inadequate bonding between layers, as the melt pool depths were much larger than the chosen layer thickness (see ). Instead, the lack of fusion porosity formed due to inadequate overlap between deposited melt tracks. This insufficient overlap could be observed within the top surface of the specimens, as lower VED specimens had a more irregular surface that contained numerous cavities between deposited melt tracks (see a). These issues of surface irregularity and cavities went away once higher VEDs were used that allowed for adequate overlap between melt tracks (see b).
Figure 2. Relative density as a function of VED for each examined low-alloy steel. Marked areas (I, II or III) denote the defined process regions, where the segmentation of each region is marked using dashed box lines. Region II represents the ideal processing window where specimen densities of >99.8% are produced.
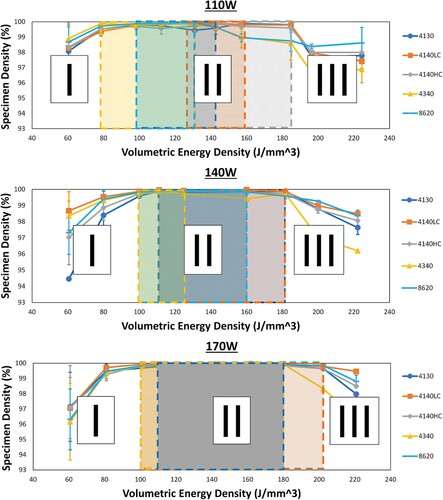
Figure 3. (a) Lack of fusion porosity in an AISI 4140HC specimen produced at 60 J mm−3 using a 170 W laser power. (b) Higher magnification of image (a). (c) Higher magnification of image (a) showing a lack of fusion porosity within a partially sintered powder particle (outlined by the black box).
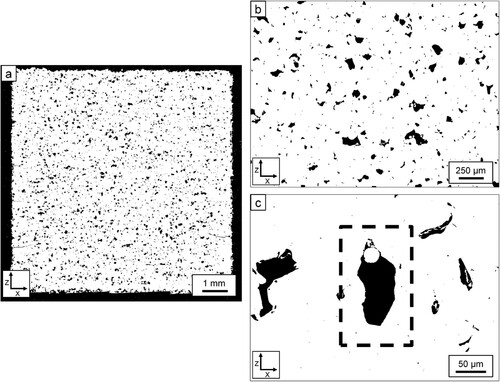
Figure 4. (a) Top surface of an AISI 4140LC specimen produced at 60 J mm−3 using a 170 W laser power. Here, the top surface is highly irregular, with many cavities and pores between deposited melt tracks. (b) Top surface in an AISI 4140LC specimen produced at 120 J mm−3 using a 170 W laser power. Here, the top surface is less irregular and is free of any large cavities or pores between deposited melt tracks.
At high VED (Region III), oval-shaped pores (up to 150 µm in size) could be found within the as-built specimens (see ). These pores formed at the bottom of the melt pool boundaries (see ) and could be identified as keyhole porosity [Citation23–25].
Figure 5. (a) Keyhole porosity in an AISI 4340 steel specimen produced at 185 J mm−3 using a 110 W laser power. (b) Example of keyhole pores at the bottom of melt pools in an AISI 4340 specimen produced at 140 J mm−3 using a 110 W laser power.
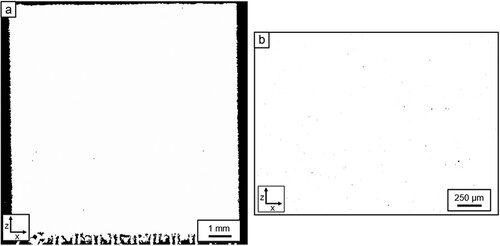
At regions of intermediate VED (Region II), high-density (>99.8%) specimens with minimal porosity could be produced (see ).
Figure 6. (a) High-density (>99.8%) AISI 8620 specimen produced at 110 J mm−3 using a 110 W laser power. (b) Higher magnification of specimen from (a) showing the presence of minimal porosity.
Quantitative image analysis of this porosity was conducted to define the size, shape and distribution of pores from each process region. The results of this evaluation (see and ) indicated that a majority of the cumulative porosity area in Region I specimens consisted of larger pores (>50 µm). Additionally, porosity in Region I was the most irregularly shaped, as evidenced by the large aspect ratio and low roundness. These characteristics indicate the presence of the lack of fusion porosity.
Figure 7. Histogram and cumulative porosity area for low-alloy steel specimens from each process region.
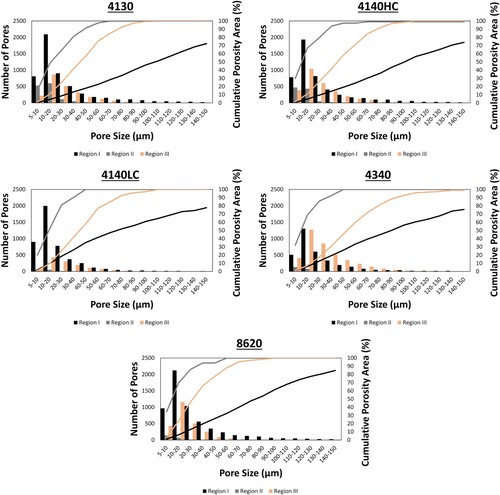
Table 4. Average pore characteristics from each process region for each examined low-alloy steel.
Region II specimens were characterised by high specimen densities (>99.8%) and contained a relatively low number of pores that were small (<20 µm) and circular in shape. The cumulative porosity area of pores found in Region III related primarily to medium-sized pores (20–100 µm) that maintained similar shape characteristics to the porosity found in Region II specimens. A comparison of the pore size distribution (see ) helped to better distinguish the porosity found in Region III from the porosity found in Region II. First, Region III specimens contained pores sized 20–100 µm, which were not present in Region II specimens. This size range is the characteristic of keyhole porosity (see ). Second, Region III specimens also had an increase in small pores (<20 µm), which helped to distinguish the transition from Region II to Region III as marking the beginning of keyhole porosity as well as an increase in small, circular pores.
As-built microstructure
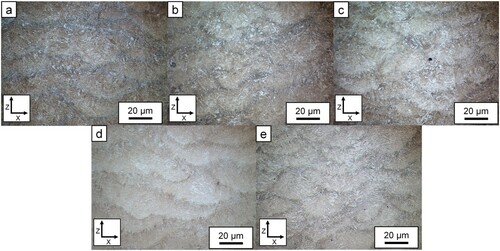
shows the as-built microstructure of each low-alloy steel. For all alloys, a martensitic microstructure was observed. In addition, these microstructures displayed numerous overlapping boundaries that related to the heat-affected regions of deposited melt tracks. These boundaries could be distinguished because they were preferentially etched in comparison to the rest of the material.
Figure 8. As-built microstructure for (a) AISI 4140LC alloy specimen produced at 110 J mm−3 using a 140 W laser power, (b) AISI 4130 alloy specimen produced at 110 J mm−3 using a 170 W laser power, (c) AISI 4140HC alloy specimen produced at 100 J mm−3 using a 110 W laser power, (d) AISI 4340 alloy specimen produced at 110 J mm−3 using a 170 W laser power and (e) AISI 8620 alloy specimen produced at 100 J mm3 using a 110 W laser power.
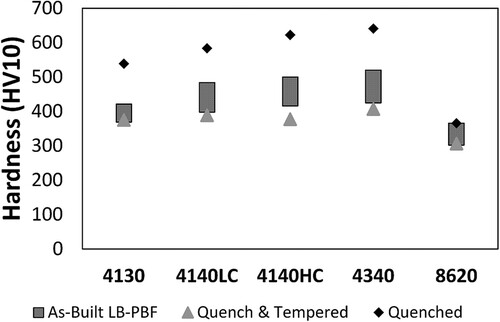
SEM analysis (see ) was used to study the as-built specimen microstructure at a higher resolution. Said analysis revealed a fine lath structure of martensite that had an abundance of nanoscale precipitates, that are likely small cementite or transitional carbides that can form during the short-time tempering of a martensitic structure [Citation26–29]. Hardness measurements (see ) provided additional evidence of tempering, as the as-built specimens had a hardness that was similar to specimens that had been quenched and tempered after processing.
Figure 9. SEM images of tempered lath martensite in (a,b) an AISI 4130 alloy specimen produced at 80 J mm−3 using a 110 W laser power, (c,d) an AISI 4140HC alloy specimen produced at 200 J mm−3 using a 140 W laser power and (e,f) an AISI 4340 alloy specimen produced at 140 J mm−3 using a 170 W laser power.
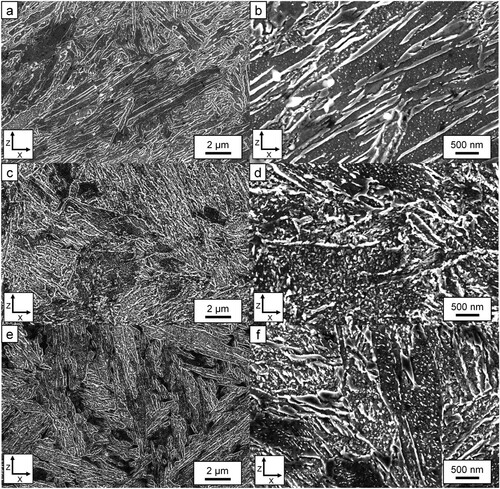
Figure 10. Bulk hardness (HV10) for each low-alloy steel in the as-built, quenched, and quenched and tempered conditions.
Cold cracking
In some AISI 4140LC, 4140HC and 4340 specimens, the presence of cracking could be observed. This cracking mainly originated at the specimen surface and grew towards the centre (see ). Microhardness measurements across the crack interface (see ) showed that the hardness in both regions was similar, indicating a comparable microstructure and suggesting that solidification had occurred before crack formation. These findings helped to distinguish these cracks as a post-solidification cold cracking phenomenon. SEM evaluation of fractography specimens (see ) revealed that transgranular fracture was the dominant micro-failure mechanism, reinforcing the notion that these cracks were related to a cold cracking phenomenon that was a result of the brittle martensitic microstructure and internal residual stresses [Citation7Citation8].
Figure 11. (a) Cracking defects in an unetched AISI 4340 specimen produced at 80 J mm−3 using a 140 W laser power. (b) Etched, higher magnification image of a crack from (a).
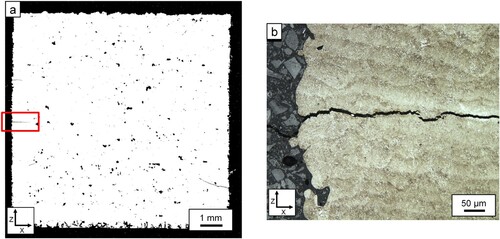
Figure 12. Fracture surface of AISI 4340 specimens produced at 80 J mm−3 using a 170 W laser power, showing transgranular decohesion facets.
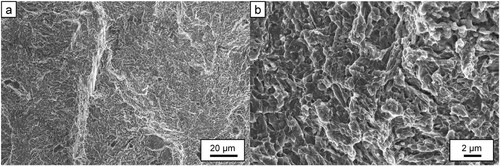
Table 5. Average microhardness (HV0.1) across the crack interface.
The occurrence of cold cracking in the AISI 4140LC, 4140HC and 4340 alloy specimens was dependent on both the VED and the laser power (see ). Increasing the VED reduced crack propensity and crack size until an upper VED threshold was reached, above which no cracking occurred (see ). While increasing the laser power would reduce the VED that was required to avoid cold cracking.
Figure 13. Evolution of cold cracking in the AISI 4140LC alloy as a function of VED for specimens produced with a laser power of 140 W.
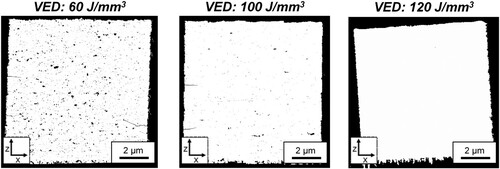
Table 6. Maximum VED at which cold cracking occurred in the AISI 4140LC, 4140HC and 4340 alloys.
To examine how increasing the VED and laser power mitigated cold cracking, the alloy hardness and melt pool depth were plotted as a function of VED (see ). This analysis showed that increasing the VED or laser power increased the depth of the melt pool and subsequently decreased the hardness of the as-built material. During LB-PBF, an intrinsic heat treatment (IHT) occurs as new layers of material are deposited on top of previously solidified layers [Citation30Citation31]. The extent of this heat treatment is influenced by the distance from the deposited layer and the number of times the material is reheated. Owing to the larger melt pool depths at higher VEDs and laser powers, there is a larger volume of melted and subsequently reheated material, providing an enhanced IHT.
Figure 14. Variation in bulk hardness and melt pool depth as a function of the VED. Hardness is displayed as a scatter plot, while melt pool depth is displayed as a bar chart. The VEDs at which cold cracking occurred are indicated with fill.
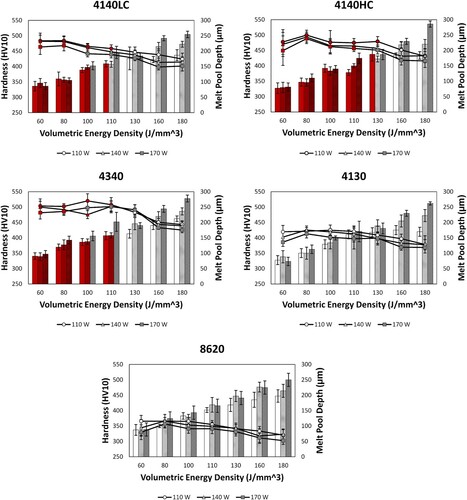
The hardness measurements from showed that cold cracking would occur at a hardness level >460HV for the AISI 4140 alloys and >500HV for the AISI 4340 alloy. This indicates that if a large enough VED or laser power is used, the IHTIHT during LB-PBF can adequately temper the material so it can avoid cold cracking defects. This hardness threshold could also explain why the AISI 4130 and 8620 alloys did not display any cold cracking, as the highest hardness for said alloys (∼425HV) was below the aforementioned thresholds.
LB-PBF processing window for crack-free, high-density specimens
From the results of this work, it was possible to establish VED-based process windows that produced crack-free, high-density (>99.8%) specimens without requiring build plate preheating. The ranges of these processing windows are displayed in .
Table 7. VED ranges that produced high-density (>99.8%), crack-free specimens.
At low VED, the noticeable presence of the lack of fusion porosity was found within the as-built specimens. Additionally, low VEDs did not allow for an adequate IHT, leading to the formation of cold cracking defects within AISI 4140 and 4340 alloy specimens. As for specimens produced at high VED, they displayed the noticeable presence of keyhole porosity.
With respect to the laser power, it was found that increasing this value, at a set layer thickness and hatch spacing, expanded the size of the processing window, as this reduced the VED that was required to avoid cold cracking defects and increased the VED that was required to induce keyhole porosity.
Regarding alloy composition, the carbon content was the most influential factor, as it strongly affected the martensite hardness and hence the brittleness of the material. Alloys with ≥0.43 wt-% C displayed cold cracking at low to intermediate VEDs, while alloys below said carbon content did not display cracking in any of the produced specimens. This is related to the increased hardness at elevated carbon contents, making the material more brittle and thus more susceptible to cold cracking.
Conclusions
In this study, LB-PBF processing was conducted on five low-alloy steels (AISI 4130, 4140LC, 4140HC, 4340 and 8620) with the resulting microstructure and defects being characterised. The conclusions can be summarised as follows:
In the as-built state, all studied low-alloy steel specimens consisted of tempered martensite. Where this tempering occurred due to the IHT that takes place during LB-PBF.
The evolution of porosity within the as-built specimens was dependent on the VED and could be categorised into three regions:
At low VED (Region I), as-built specimens contained irregularly shaped, large pores (up to 500 µm) that were related to the lack of fusion porosity.
At high VED (Region III), as-built specimens contained oval-shaped, medium-sized pores (≤150 µm) that were related to keyhole porosity.
At VEDs between these two regions (Region II), only trace amounts of porosity were found, allowing for high specimen densities (>99.8%).
Cold cracking was observed in some AISI 4140 and 4340 low-alloy steel specimens. However, these defects could be avoided by increasing the VED or laser power, as both factors enhance the IHT that occurs during LB-PBF, lowering the hardness of the as-built specimens. This indicated that the correct tailoring of the IHT to achieve certain hardness values (<460HV for AISI 4140 and <500HV for AISI 4340) will enable the as-built specimens to avoid this issue of cold cracking.
Based on these results, processing windows were established that produced crack-free, high-density (>99.8%) specimens without the requirement of build plate preheating:
o AISI 4130 (110 W: 100–140 J mm−3, 140 W: 110–180 J mm−3, 170 W: 110–180 J mm−3);
o AISI 4140LC (110 W: 110–185 J mm−3, 140 W: 110–180 J mm−3, 170 W: 110–200 J mm−3);
o AISI 4140HC (110 W: 130–160 J mm−3, 140 W: 110–160 J mm−3, 170 W: 110–180 J mm−3);
o AISI 4340 (110 W: 110–130 J mm−3, 140 W: 110–130 J mm−3, 170 W: 100–180 J mm−3);
o AISI 8620 (110 W: 110–130 J mm−3, 140 W: 100–160 J mm−3, 170 W: 100–200 J mm−3).
Acknowledgements
The authors would like to acknowledge Peter Harlin (Sandvik Additive Manufacturing) and Sven Bengtsson (Höganäs AB) for providing the powder feedstock that was used in this study and would like to thank Anton Dahl-Jendelin (RISE-IVF) for helping characterise the powder properties.
Disclosure statement
No potential conflict of interest was reported by the authors.
Additional information
Funding
Notes on contributors
William Hearn
William Hearn is currently a PhD student at the Centre for Additive Manufacturing – Metal (CAM2) hosted by the Department of Industrial and Materials Science at Chalmers University of Technology, Gothenburg, Sweden. His work focuses on powder material development for powder-based additive manufacturing technologies.
Robert Steinlechner
Robert Steinlechner is currently a PhD student at the Institute of Chemical Technologies and Analytics at Vienna University of Technology (TU Wien), Vienna, Austria. This paper is based on the work performed by Robert Steinlechner during his MSc research visit hosted by the CAM2 centre at Chalmers University of Technology.
Eduard Hryha
Eduard Hryha is a professor in Powder Metallurgy and Additive Manufacturing at the Department of Industrial and Materials Science, Chalmers University of Technology, Gothenburg, Sweden. He is also the director of the Competence Centre for Additive Manufacturing – Metal (CAM2), hosted by the same department. His research focuses on powder metallurgy and powder-based metal additive manufacturing.
References
- Dossett och J, Totten G. ASM handbook, volume 04D – heat treating of irons and steels. Materials Park, OH: ASM International; 2014.
- Committee AIH. ASM handbook, volume 01 – properties and selection: irons, steels, and high-performance alloys. Materials Park, OH: ASM International; 1990.
- DebRoy T, Wei H, Zuback J, et al. Additive manufacturing of metallic components – process, structure and properties. Prog Mater Sci. 2018;92:112–224. doi:https://doi.org/10.1016/j.pmatsci.2017.10.001.
- Narvan M, Al-Rubaie och KS, Elbestawi M. Process-structure-property reationships of AISI H13 tool steel processed with selective laser melting. Materials. 2019;12(14):1–20. doi:https://doi.org/10.3390/ma12142284.
- Kempen K, Vrancken B, Buls S, et al. Selective laser melting of crack-free high density M2 high speed steel parts by baseplate preheating. J Manuf Sci Eng. 2014;136(6):1–6. doi:https://doi.org/10.1115/1.4028513.
- Mercelis och P, Kruth J. Residual stresses in selective laser sintering and selective laser melting. Rapid Prototyp J. 2006;12(5): 254–265. doi:https://doi.org/10.1108/13552540610707013.
- Mertens R, Vrancken B, Holmstock N, et al. Influence of powder bed preheating on microstructure and mechanical properties of H13 tool steel SLM parts. Phys Procedia. 2016;83:882–890. doi:https://doi.org/10.1016/j.phpro.2016.08.092.
- Yan J, Zheng D, Li H, et al. Selective laser melting of H13: microstructure and residual stress. J Mater Sci. 2017;52(20):12476–12485. doi:https://doi.org/10.1007/s10853-017-1380-3.
- Dilip J, Janaki Ram G, Starr och T, et al. Selective laser melting of HY100 steel: process parameters, microstructure and mechanical properties. Addit Manuf. 2017;13:49–60. doi:https://doi.org/10.1016/j.addma.2016.11.003.
- Seede R, Shoukr D, Zhang B, et al. An ultra-high strength martensitic steel fabricated using selective laser melting additive manufacturing: densification, microstructure, and mechanical properties. Acta Mater. 2020;186:199–214. doi:https://doi.org/10.1016/j.actamat.2019.12.037.
- Li X, Hao Tan Y, Willy H, et al. Heterogeneously tempered martensitic high strength steel by selective laser melting and its micro-lattice: processing, microstructure, superior performance and mechanisms. Mater Des. 2019;178:1–13. doi:https://doi.org/10.1016/j.matdes.2019.107881.
- Damon J, Koch R, Kaiser D, et al. Process development and impact of intrinsic heat treatment on the mechanical performance of selective laser melted AISI 4140. Addit Manuf. 2019;28:275–284. doi:https://doi.org/10.1016/j.addma.2019.05.012.
- Wang och W, Kelly S. A metallurgical evaluation of the powder-bed laser additive manufactured 4140 steel material. JOM. 2016;68(3):869–875. doi:https://doi.org/10.1007/s11837-015-1804-y.
- Jamshidinia M, Sadek A, Wang och W, et al. Additive manufacturing of steel alloys using laser powder-bed fusion. Adv Mater Process. 2015;173:20–24.
- Jelis E, Hespos och M, Ravindra N. Process evaluation of AISI 4340 steel manufactured by laser powder bed fusion. J Mater Eng Perform. 2018;27(1):63–71. doi:https://doi.org/10.1007/s11665-017-2989-8.
- Jelis E, Hespos M, Groeschler och S, et al. L-PBF of 4340 low alloy steel: influence of feedstock powder, layer thickness, and machine maintenance. J Mater Eng Perform. 2019;28(2):693–700. doi:https://doi.org/10.1007/s11665-018-3739-2.
- Fayazfar H, Salarian M, Rogalsky A, et al. A critical review of powder-based additive manufacturing of ferrous alloys: process parameters, microstructure and mechanical properties. Mater Des. 2018;144:98–128. doi:https://doi.org/10.1016/j.matdes.2018.02.018.
- du Plessis A, Yadroitsava och I, Yadroitsev I. Effect of defects on mechanical properties in metal additive manufacturing: a review focusing on X-ray tomography insights. Mater Des. 2020;187:108385. doi:https://doi.org/10.1016/j.matdes.2019.108385.
- Hearn W, Hryha E, Bengtsson och S, et al. Processability & microstructure of Fe-C system via L-PBF. EuroPM Proceed. 2019;2019.
- Schneider C, Rasband W, Eliceiri K. NIH image to ImageJ: 25 years of image analysis. Nat Methods. 2012;9(7): 671–675. doi:https://doi.org/10.1038/nmeth.2089.
- Ronneberg T, Davies och C, Hooper P. Revealing relationships between porosity, microstructure and mechanical properties of laser powder bed fusion 316L stainless steel through heat treatment. Mater Des. 2020;189:1–14. doi:https://doi.org/10.1016/j.matdes.2020.108481.
- Tang M, Pistorius och PC, Beuth JL. Prediction of lack-of-fusion porosity for powder bed fusion. Addit Manuf. 2017;14:39–48. doi:https://doi.org/10.1016/j.addma.2016.12.001.
- Cunningham R, Narra S, Montgomery C, et al. Synchrotron-based X-ray microtomography characterization of the effect of processing variables on porosity formation in laser power-bed additive manufacturing of Ti-6Al-4V. JOM. 2017;69(3):479–484. doi:https://doi.org/10.1007/s11837-016-2234-1.
- King W, Barth H, Castillo V, et al. Observation of keyhole-mode laser melting in laser powder-bed fusion additive manufacturing. J Mater Process Technol. 2014;214(12):2915–2925. doi:https://doi.org/10.1016/j.jmatprotec.2014.06.005.
- Bobel A, Hector Jr LG, Chelladurai I, et al. In situ synchrotron X-ray imaging of 4140 steel laser powder bed fusion. Materialia. 2019;6:1–10. doi:https://doi.org/10.1016/j.mtla.2019.100306.
- Krauss G. Tempering of lath martensite in low and medium carbon steels: assessment and challenges. Steel Res Int. 2017;10(88):1–18. doi:https://doi.org/10.1002/srin.201700038.
- Revilla C, Lopez och B, Rodriguez-Ibabe J. Carbide size refinement by controlling the heating rate during induction tempering in low alloy steel. Mater Des. 2014;62:296–304. doi:https://doi.org/10.1016/j.matdes.2014.05.053.
- Kaiser D, de Graff B, Dietrich och S, et al. Investigation of the precipitation kinetics and microstructure evolution of martensitic AISI 4140 steel during tempering with high heating rates. Metall Res Technol. 2018;404(115):1–7. doi:https://doi.org/10.1051/metal/2018026.
- Furuhara T, Kobayashi och K, Maki T. Control of cementite precipitation in lath martensite by rapid heating and tempering. ISIJ Int. 2004;44(11):1937–1944. doi:https://doi.org/10.2355/isijinternational.44.1937.
- Kurnsteiner P, Wilms M, Weisheit A, et al. High-strength Damascus steel by additive manufacturing. Nature. 2020;582(7813):515–519. doi:https://doi.org/10.1038/s41586-020-2409-3.
- Kurnsteiner P, Wilms M, Weisheit A, et al. Massive nanoprecipitation in an Fe-19Ni-xAl maraging steel triggered by the intrinsic heat treatment during laser metal deposition. Acta Mater. 2017;129:52–60. doi:https://doi.org/10.1016/j.actamat.2017.02.069.