
 ?Mathematical formulae have been encoded as MathML and are displayed in this HTML version using MathJax in order to improve their display. Uncheck the box to turn MathJax off. This feature requires Javascript. Click on a formula to zoom.
ABSTRACT
In Binder Jetting (BJ) Additive Manufacturing (AM), green components are usually subjected to sintering process to reach required properties. Owing to the inherent low green density, binder jetted (BJ) parts undergo shrinkages up to 20%. In addition, anisotropic dimensional evolution during sintering is characteristic for BJ, generally caused by the specifics of the arrangement of particles during the printing process. In this study, the multi-axial dimensional evolution of 316L stainless steel cubic samples (10 × 10 × 10 mm3), manufactured using BJ, was characterised by dilatometry experiments. Dilatometry tests were conducted up to sintering temperatures of 1300°C and 1370°C, with a heating rate of 10°C/min and 5°C/min, respectively. Dilatometry results and final dimension measurements showed anisotropic shrinkage behaviour during sintering with about 15% larger shrinkage along the building direction. Shrinkages along the other two orthogonal directions were relatively similar, but a slightly larger final shrinkage along the printhead movement direction was observed. Relative density of 85.0% and 96.4% was obtained after sintering tests at 1300°C and 1370°C, respectively.
Introduction
During the last decades, extensive research has been focused on the understanding and development of additive manufacturing (AM). Powder Bed Binder Jetting (BJ) is a multi-step AM process, defined as a ‘process in which a liquid bonding agent is selectively deposited to join powder particles’ [Citation1]. AM multi-step process is based on two or more operations where the first typically provides the basic part geometric shape and the following consolidates the part to reach final geometry and intended basic material properties [Citation1]. BJ of metallic materials typically consists of the following steps: printing, curing, depowdering, debinding and sintering. First, the parts are printed by spreading a powder layer in a build-box followed by the deposition of a binder which selectively joins the particles together. This procedure is repeated layer-by-layer to consolidate the powder into a three-dimensional geometry in the resulting powder bed. After printing, the build-box is transferred to a furnace where the binder is cured, increasing the strength of the printed (green) parts. Then, green parts are extracted during depowdering. Finally, the parts are debinded and sintered using a high-temperature furnace.
Because of the process characteristics, BJ can be used for the manufacturing of a wide range of metallic alloys. But, sintering conditions (e.g. temperature, time or atmosphere) should be precisely tuned for each alloy. Other powder-metallurgy processes (e.g. spark plasma sintering, hot pressing, hot isostatic pressing, etc.) use the advantage of adding pressure during sintering to improve densification [Citation2,Citation3]. Conventional press and sinter processes typically reach higher green density by the pressure-assisted green part shaping process. The pressure applied may induce anisotropy on the green body, which potentially yields to larger shrinkages along the compaction direction [Citation4]. The inherent large open porosity and complex geometries of BJ green components typically limit the sintering step to the use of conventional sintering (free-sintering). To achieve full densification during conventional sintering, BJ samples experience anisotropic shrinkages of up to 20%, which depends on the density of green part, sintering process and hardware [Citation5].
During free-sintering processes, shrinkages anisotropy potentially comes from non-homogeneities within the green parts. Powder particles with elongated shapes or induced preferential crystallographic orientation have shown to produce anisotropic sintering shrinkages [Citation6,Citation7]. However, spherical powders are typically used in BJ manufacturing and no preferential crystallographic orientation is induced. Non-homogeneities in BJ green components are likely to be caused by the printing process. BJ printing can be considered as an inherently anisotropic process with three main directions defined by the printing actions: (1) direction of powder recoating, (2) direction of printhead movement during binder deposition and (3) direction of build plate movement or building direction. Typically, these directions are orthogonal, potentially inducing orthotropic green part properties and structure [Citation8]. Specifically, the characteristics of these printing actions may lead to periodic non-homogeneities within the powder bed and, thus, green porous structure. Therefore, producing anisotropy in the dimensional evolution during sintering.
Previous studies have shown that BJ parts experience larger final shrinkage along the building direction, while shrinkages along the two other orthogonal directions are similar [Citation5,Citation9–16]. Most of them agree that BJ green specimens present a ‘layered’ porous structure, which produce the shrinkages anisotropy. However, details on how the anisotropy is developed during sintering and the related mechanism are still ambiguous. Some studies suggested that gravity has a significant impact on the anisotropy, causing the powder layers to collapse along the vertical building direction after binder is removed [Citation11,Citation12,Citation14]. Other studies vary the powder size distribution (PSD), showing that BJ samples with smaller particle sizes typically exhibit higher level of anisotropy during sintering [Citation10,Citation11,Citation14]. A stronger layered porous structure during the initial stages of sintering is related to higher anisotropy for smaller particle size powders [Citation11]. A simulation study suggested that sandwich pattern with finer and coarser particle zones, induced by particle segregation during powder spreading, would induce larger shrinkages along the building direction [Citation14]. This study is specific for printers working with a counter-rotating roller spreading system, where powder segregation level varies depending on the roller linear and rotating velocity. [Citation9] showed that when increasing the layer thickness and binder saturation inhomogeneities in both microstructure and mechanical behaviour are observed. However, the effect on the shrinkage anisotropy remains unclear. These studies have shown that printing parameters (e.g. layer thickness, binder saturation, roller linear and rotating speed) have a direct influence on the green part porous structure heterogeneities and subsequent sintering shrinkage anisotropy.
Although the effects of printing parameters and powder characteristics on the sintered geometry and properties of BJ parts have been intensively investigated during the last years, there is a lack of detailed studies on the anisotropy of dimensional and microstructure evolution during sintering of 316L BJ samples. Therefore, in this work, dilatometry tests have been performed to characterise the multi-axial dimensional changes of 316L cubic samples along the three orthogonal axes. The cube’s orthogonal axes have been oriented in parallel to the main BJ printing directions described previously. Thus, the dilatometry results are used to calculate anisotropic factors to analyse and discuss the possible anisotropic sintering behaviour. Dilatometry test was conducted at two temperatures of 1300°C and 1370°C to study the possible effect of the δ-ferrite transformation during the isothermal sintering step. Besides, two sets of samples were sintered from as-printed and debinded state to analyse the dimensional/microstructure evolution during sintering. The debinding step was included in the dilatometry experiment, revealing the dimensional evolution during this step. In addition, sintering tests interrupted at various temperatures were performed to reveal the evolution at these specific temperatures. The second part discusses the microstructural evolution of the BJ samples used during this study [Citation17]. Pre-sintered and sintered microstructures will be characterised along three cross-sections defined by the orthogonal planes. Bulk density, porosity structure characteristics (i.e. pore size and shape distribution) and phases present after the sintering tests performed in the present study will be characterised and correlated with the sintering behaviour.
Materials and methods
Binder jetted samples were produced using the ExOne Innovent+ binder jetting printer and Sandvik Osprey® 316L stainless steel powders. The binder used was an industry standard aqueous-based organic binder. Powder chemistry and physical properties (particle size and tap density) were provided by the powder manufacturer and are summarised in and , respectively. Also, the printing parameters used are reported in .
Table 1. Chemistry of the powder used for BJ samples manufacturing (wt-%).
Table 2. Properties of the experimental powder.
Table 3 . Printing process parameters used.
Cubic samples with a size of 10 × 10 × 10 mm3 were printed (). Samples were oriented in the build space with the cube’s planes orthogonal to the main printing directions: building direction (Z-axis), printhead movement (X-axis) and recoating direction (Y-axis). Consequently, distance measurements between parallel planes allow the characterisation of the dimensional changes along the corresponding orthogonal axis. Each sample was designed with an identification number (ID) hollowed in the top surface, also used for later axis identification (see ). After printing, samples were cured at 200°C for 12 h in low vacuum achieved with a membrane pump connected to the curing furnace, followed by the depowdering step. The bulk density of the green samples was calculated by measuring weight and dimensions along the x-, y- and z-axis, and the average relative density of 56.1 ± 0.6% was obtained. A theoretical density of 7.95 mg mm−3 was assumed for the 316L alloy used in this study. Then, some selected samples were subjected to a pre-sintering treatment. Pre-sintering treatment was done in hydrogen atmosphere using an industrial batch furnace with the following thermal profile: heating step at 5°C/min from room temperature to 900°C, holding for 1 h followed by furnace cooling down to the room temperature. Hence, green and pre-sintered samples were produced for further dilatometry sintering experiments.
Figure 1. Schematic illustration of the experimental procedure followed in this study.
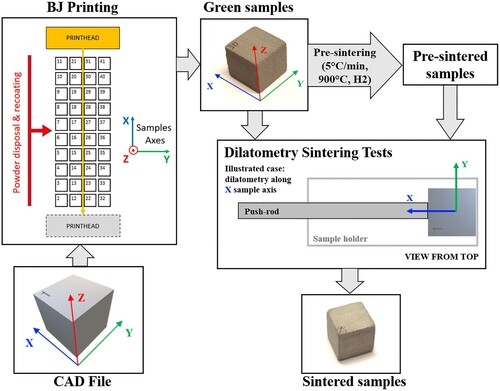
To study the multiaxial sintering behaviour, samples were subjected to dilatometry sintering tests. A vacuum-tight dilatometer Netzsch DIL 402C (Netzsch-Gerätebau GmbH) was used to sinter the samples and measure the dimensional change as a function of temperature and time. Each tested sample was placed in contact with the alumina push-rod with a contact force of 30cN and supported on the dilatometer sample holder. The dimensional change measured by the equipment corresponds to the sample’s axis parallel to the dilatometer pushrod. Consequently, each cubic sample was intentionally oriented with one of its axes aligned along the push-rod (dilatometer sample orientation in ). At least three experiments for each sintering thermal cycle are required to characterise the anisotropic behaviour (one experiment for each sample direction). For this study, two different sintering cycles were designed with different heating rate (5°C/min and 10°C/min) and isothermal temperatures (1300°C and 1370°C); a dwell time of 60 min and final cooling rate of 30°C/min. Pre-sintered samples were subjected to both sintering cycles, while green samples were only subjected to the sintering cycle up to 1370°C to compare with the pre-sintered samples. In addition, green samples were subjected to interrupted sintering tests with the heating rate of 5°C/min to capture the microstructure evolution. Sintering was interrupted at different temperatures of 1000°C, 1100°C and 1200°C with a dwell time of 2 min for temperature stabilisation. An isothermal debinding step at 460°C with a dwell time of 120 min was added on the designed dilatometry cycles when green samples were sintered. All sintering trials were performed under high-purity hydrogen atmosphere (99.9999%) flowing at 100 mL min–1 to ensure good reduction atmosphere. A summary of the samples ID and the respective dilatometry sintering parameters are depicted in .
Table 4 . Sample’s ID and sintering parameters used for the dilatometry sintering tests.
Results from dimensional changes along three orthogonal cube’s axes obtained from dilatometry were used to analyse the sintering anisotropy. For a detailed study of the multiaxial sintering behaviour [Citation7], the following anisotropy factors were calculated and evaluated:
The engineering strains were used to present the results from dilatometry and are calculated as follows: , where
is the corresponding sample axis,
the initial length and
the dimensional changes measured by dilatometry.
The cube’s weight and dimensions at the different sample states (i.e. green, pre-sintered and sintered) were measured. A manual calliper with a resolution of 0.01 mm and high precision balance with a resolution of 0.0001 g were used. These measurements were used to calculate shrinkages after sintering along each direction, and the relative density of the samples at each state. In this study, the term ‘geometry-based’ was used for results derived from manual dimensional measurements.
Results and discussion
Effect of debinding step on the dimensional evolution during sintering
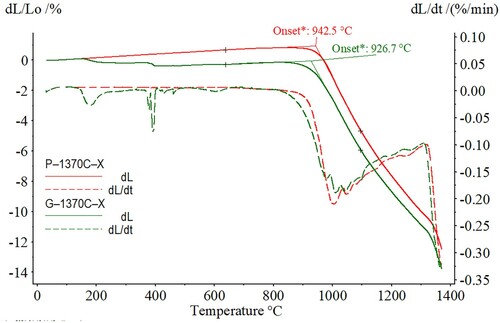
Analogous dilatometry sintering experiments set using green samples and pre-sintered samples were performed to assess its effect on the sintering behaviour. shows the comparison of the results from the heating stages before reaching a dwell temperature of 1370°C. Note that results during isothermal debinding step at 460°C are not included, since dimensional variations detected are insignificant. Pre-sintered sample (red curves) exhibited clear linear thermal expansion until the sintering onset temperature was reached, while the green sample (green curves) showed a combination of shrinkage and expansion. This could be related to rearrangement of particles occurring during the debinding process, particularly at the temperatures where the main chemical constituents of the binder are decomposed. The difference between green and pre-sintered dimensional variation values at the onset of sintering was ∼1.4%. Therefore, it is expected that green samples will have final sintering shrinkage values larger when compared to pre-sintered samples if subjected to the same sintering cycle. Also, the sintering onset temperature of the pre-sintered samples (∼943°C) was found to be slightly higher when compared with the green sample (∼927°C).
Figure 2. Sintering curves from a green (G-1370C-X) and pre-sintered (P-1370C-X) sample sintered up to 1370°C and oriented along the X axis, plotted as a function of the temperature. Note that only the results from heating steps are showed in the figure.
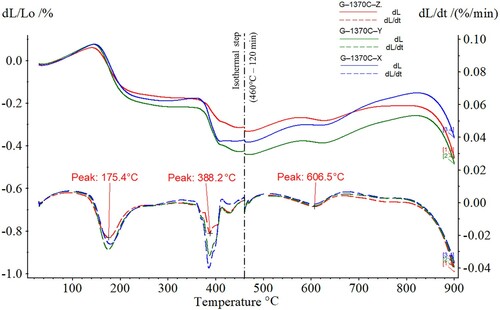
The dimensional evolution of green samples along each orthogonal sample’s directions between room temperature (RT) and 900°C is presented in . Apart from the thermal expansion contribution, the graph shows that three transition stages occur on the shrinkage’s evolution below 900°C. Each stage can be related to its shrinkage rate peak and temperature range in the graph. These stages can be directly connected with the binder burnout process, where each stage temperature range agrees with results reported previously in [Citation9]. Thus, rearrangements of particles may be caused by the debinding process along the three directions studied. In this study, shrinkages along the building direction were the lowest at the end of the debinding step. However, sintering shrinkage’s after debinding (T > 700°C) starts earlier along the building direction and anisotropy develops afterwards. However, it should be noted that shrinkages recorded during debinding (<0.5%) are insignificant compared to the final shrinkages. These results show that binder removal and the possible rearrangement of particles do not directly produce any significant shrinkage anisotropy during the debinding step. In contrast with other results from debinding of pressed samples [Citation18], no swelling was observed during the debinding step for the BJ samples in this study. This could be caused by the ability of the low binder content to flow or evaporate out through the open porosity still present during the debinding.
Figure 3. Multi-axial debinding data below 900°C, collected from dilatometry experiments along: Z axis, Y axis and X axis using green samples.
Dimensional evolution along the orthogonal printing directions
clearly shows larger sintering shrinkages along the Z-axis (building direction) than shrinkages along the X and Y-axes. This general result was obtained from both: dilatometry and geometry-based shrinkage measurements. Dilatometry results from the three sample orientations sintering tests (depicted in ) are shown together for each sample set in (a–c). For dilatometry results, a positive dimensional variation value corresponds to expansion and a negative value to shrinkage of the sample. In addition, the final shrinkages calculated from dimensional measurements are shown in (d). When comparing shrinkages measured along X and Y directions, the general trend in (d) shows that shrinkages along X direction are slightly larger (less than 0.5%). This tendency will be analysed more in detail by using the anisotropic factors in the next section. Previous studies [Citation5,Citation10,Citation11,Citation19,Citation20] have shown that BJ components usually present larger final shrinkages along the building direction. However, no evidence on how this anisotropy is developed during the sintering process was presented before.
Figure 4. Multi-axial sintering data collected from sintering experiments along: Z axis, Y axis and X axis. Sintering curves based on dilatometry tests at: (a) 5°C/min heating up to 1370°C; (b) 5°C/min heating up to 1370°C, including a debinding step at 460°C for 120 min; (c) 10°C/min heating up to 1300°C. (d) Final shrinkages calculated from manual measurements of samples dimensions.
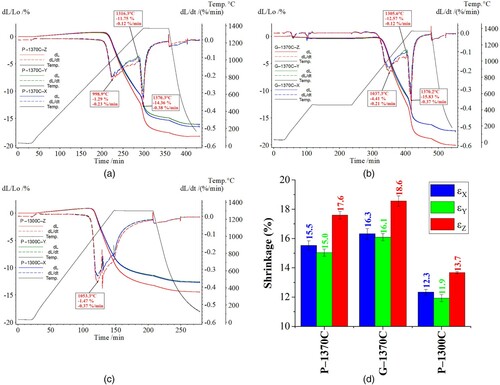
The dilatometry curve from pre-sintered sample P-1370C-Z in (a) can be used as reference to discuss the global sintering behaviour of the BJ manufactured 316L samples. In general, the dilatometry curve shows two main sintering regions, separated by the identified peak in the shrinkage rate curve with a minimum value of 0.12%/min. This sintering behaviour change can be associated with the formation of body-centered cubic (BCC) delta-ferrite (δ) phase, which has a higher self-diffusion rate than the face-centred cubic (FCC) austenite (γ) crystal structure [Citation21,Citation22]. Thus, the enhanced diffusion rate was recorded by the dilatometry as an increase on the shrinkage rate. Formerly, a region of thermal expansion was detected during the lower temperature of the heating step, followed by the sintering onset detected at ∼943°C. After the sintering onset, shrinkage rate rapidly increased up to a relative maximum value of 0.2%/min. Here, the use of relatively fine powders with high initial sintering activity could produce this pronounced increase in the shrinkage rate [Citation23]. Then, shrinkage rate decreased regularly to 0.12%/min, which defined the end of the first sintering region. Frequently, the reduction of sintering rate during intermediate sintering is related to grain growth [Citation24]. When grain growth occurs, the total pathway for grain boundary diffusion is reduced and distance for lattice diffusion increased. This combination reduces the global diffusion rate and, consequently, the sintering rate. A major part of the sintering shrinkage occurred during this first region, mainly driven by grain boundary, bulk and surface diffusion within the porous γ phase microstructure. The second region starts with an abrupt increase in the shrinkage rate, caused by the γ→δ transformation [Citation17,Citation22,Citation25]. A maximum shrinkage rate of 0.38%/min was reached just at the end of the heating step. Thus, grain growth sintering kinetics reduction was overcome by the effect of γ→δ transformation. Both lattice diffusion, with higher diffusivity within the BCC phase, and grain boundary diffusion, with the formation of new grain boundaries, are boosted by this transformation. Finally, during the isothermal step the shrinkage rate decreases and tends to zero. The decrease of sintering rate during the isothermal step may be caused by the constant temperature-dependent diffusivity, the reduction of sintering activity related to decreasing of the free surface area and isolation of pores inside grains produced by grain growth. The dilatometry results from samples sintered along the X and Y direction show analogous behaviour, with shrinkage rate curves being parallel to the Z direction with slightly lower values. Therefore, the anisotropy shows to be continuously developed during the sintering process.
Some differences can be found by doing analogous analysis with experimental results of samples set G-1370C from (b) and P-1370C from (c). When pre-sintered samples were sintered at 1300°C with a higher heating rate of 10°C/min (see (c)), two main differences were found. First, the relative maximum shrinkage rate value during the first region of sintering is 0.37%/min, nearly twice the value for samples sintered at 5°C/min (P-1370C). Second, the shrinkage rate increase caused by the γ→δ transformation could not be observed. This indicates that the dwell temperature reached was still lower than the γ→δ transition temperature for the case. When green samples were used for the dilatometry tests, the added slight shrinkages recorded during the debinding step adds up to the total sintering shrinkages. Therefore, the shrinkages curves in (b) and the final shrinkages measured in (d) are constantly larger (∼1%) when compared to pre-sintered samples set (P-1370C) results.
Anisotropic factors evolution during sintering
The shrinkage anisotropy factors and
calculated using the dimensional measurements from dilatometry tests are plotted as a function of the sintering time on (a–c). Very low shrinkages during early sintering caused stochastics fluctuations on the anisotropic factor values [Citation7]. Therefore, results for temperatures below 1000°C during the heating step were omitted. Sintering tests performed at 5°C/min (P–1370C and G–1370C sets) present a continuous evolution of the anisotropic factors during the heating step, which tends to the final factor of ∼1.15 in (a,b). This means that shrinkages after sintering along the building direction (Z-axis) are ∼15% larger when compared to the other directions. However, (a) shows larger
value during isothermal step together with a larger decrease of both
and
during the final cooling. This drop of K values was caused by a deviation of the P-1370C-Z shrinkage rate curve during the cooling step, but the related microstructural mechanisms explaining this behaviour remain unclear. During the isothermal step, both K factors increase at very low rate. For the sintering tests performed at 10°C/min (P–1300C set), after initial stochastics variations, the anisotropic factors tend to identical final value of ∼1.15 in (c). But, in this case, K values mostly remain constant during heating, and their larger increase occurs during the isothermal step. Because of the lower dwell temperature of 1300°C and faster heating, larger pores and microstructural anisotropy could be expected at the beginning of the isothermal step. Thus, microstructure anisotropy is mainly reduced during the isothermal step. Besides, sample dimensional manual measurements were used to calculate the final K values showed in (d).
Figure 5. Evolution of anisotropic factors KY and KX during sintering, calculated from dilatometry results showed in : (a) 5°C/min heating up to 1370°C; (b) 5°C/min heating up to 1370°C, including a debinding step at 460°C for 120 min; (c) 10°C/min heating up to 1300°C. (d) Final anisotropic factors calculated from shrinkages measured manually showed in (d).
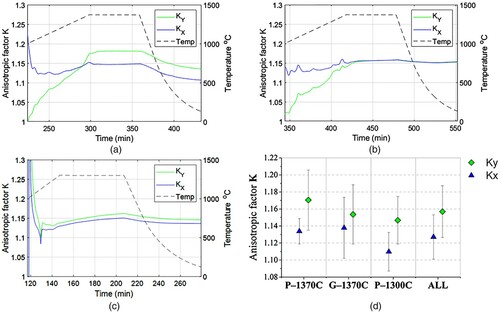
In general, all the anisotropy factors obtained from dilatometry and calliper measurements are K > 1, falling between the range 1.1–1.2. Averaged and
manually measured values are 1.16 ± 0.03 and 1.13 ± 0.03, respectively, which agree with the final values obtained from dilatometry. Similar anisotropy factors can be derived from shrinkage values reported in the literature. In [Citation9], 316L BJ cubic samples were printed with the same binder jetting system. The averaged anisotropic factors derived from shrinkage values reported are
and
. In [Citation10], both average derived factors are 1.23 with values ranging from 1.13 to 1.3 (depending on the sample’s powder size and layer thickness). In [Citation15], 17-4 PH steel samples were sintered, and the average anisotropy values derived are
and
. Last study results indicate that increasing the layer thickness leads to higher anisotropy, probably induced by a lower green density. In [Citation11], the effect of PSD on the sintering of 625 alloy BJ samples was studied. Anisotropy values derived from shrinkage measurements of
and
showed similar behaviour for samples with small particle size powders (D10 = 19.2 µm and D10 = 15.6 µm). But then, samples with larger particle sizes (D10 = 38.1 µm) showed nearly isotropic shrinkage behaviour. The shrinkage anisotropy within the XY plane is still not constant along different studies.
The anisotropic factors evolution during sintering is typically related to a non-homogeneous initial green porous structure, produced during the printing process [Citation14]. Recoating process may produce particle segregation and heterogeneities. Besides, the binder deposition process may produce periodical voids during the interaction with the powder bed. Likewise, layered binder regions could be produced if binder cannot fully infiltrate within the powder bed. In (a,b), the monotonous evolution of the factor from 1000°C to 1370°C and from 1 to 1.15 could be related with similar non-homogeneities along the X and Z direction, which are eliminated at low temperatures. However, results showed a larger final
value than
which indicate lower shrinkages along the Y direction (∼0.4%). This could be related to the anisotropic powder particles/binder distribution and particle contact number along the X and Y directions, caused by binder droplets being deposited along the X direction. However, the small difference between the shrinkages along X and Y direction and the lack of consistency with results from literature makes it difficult to reach a conclusion on this question. A comprehensive and more detailed discussion regarding the microstructural evolution during sintering is published in the companion article [Citation17].
Interrupted sintering tests and sintered density
shows results from the interrupted dilatometry sintering tests performed to freeze the microstructure at different temperatures below the γ→δ transformation temperature. Shrinkage curves in (a) demonstrate the accurate repeatability of the dilatometry measurements used during this study. Dilatometry results obtained from sample G–1370C–Z were plotted as the reference for evaluation purposes. (b) shows shrinkages obtained by dimensional measurements on each sample. All shrinkages increase when the interrupted temperature increases, thus an increased densification is expected accordingly. There is no clear trend on behaviour of the absolute difference between the Z-axis shrinkage and X/Y shrinkages as a function of the interrupted temperature.
Figure 6. Sintering data collected from interrupted sintering tests performed at different temperatures. (a) Sintering curves from dilatometery tests performed at 5°C/min heating rate and interrupted at 1000°C, 1100°C, 1200°C and reference cycle from dilatometry tests of the G–1370C–Z sample. (b) Final shrinkages calculated from manual measurements of interrupted tests samples dimensions.
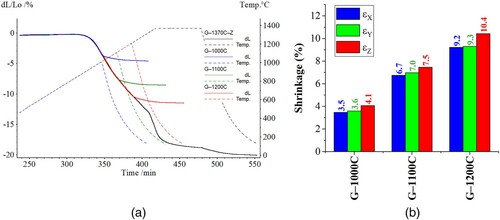
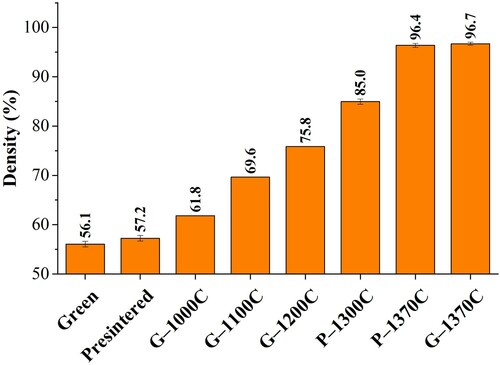
Density values obtained by dimension and weight measurements are presented in . Green and pre-sintered geometry-based relative density of 56.1 ± 0.6% and 57.2 ± 0.6% were obtained. The values represent the average value of all the green and pre-sintered samples with the corresponding standard deviation. So, after pre-sintering, minor densification of 1.2 ± 0.15% and weight loss of 0.62 ± 0.06% were obtained. The minor weight loss of 0.62% was mainly related to binder elimination. Small densification during the pre-sintering can be related to the formation of small necks between particles via short-range atomic motion [Citation26]. From the interrupted sintering tests, density values increase as the interrupted temperature increases as expected. Finally, P-1370C and G-1370C samples’ density measurements showed high densification to ∼97% relative density, while P-1300C samples sintered up to ∼85%.
Figure 7. Relative densities for the samples at the green and pre-sintered states, together with the sintered densities of each sample’s sets sintered using the corresponding thermal routes. Average and standard deviation values are presented when various samples were subjected to the same thermal route.
Summary and conclusions
The multi-axial sintering behaviour of cubic binder jetted parts from 316L stainless steel powder was characterised by sintering dilatometry experiments. For that purpose, the influence of the orientation of the part related to the BJ printing directions on the sintering behaviour was investigated. Also, different initial sample states of green and pre-sintered samples were used to validate the use of pre-sintered samples in the study of printed samples’ anisotropic behaviour during sintering. Anisotropic factors’ evolution was derived from the dilatometry results and geometry-based measurements. Finally, the density was determined by using manual dimensional and weight measurements. The following main conclusion could be drawn:
Anisotropic shrinkage behaviour was clearly observed, with larger shrinkages along the building direction (Z-axis). Shrinkages occurring along the powder recoating direction (Y-axis) and printhead movement direction (X-axis) were rather similar, but the tendency showed slightly larger shrinkages along the X-axis.
Characteristic shrinkage anisotropy factor of ∼1.15 was observed, meaning that shrinkages were ∼15% larger along the building direction. The anisotropic factors constantly increase during the heating step for samples heated at 5°C/min until its highest value. When samples are heated at 10°C/min, the anisotropy factors increase mainly during the isothermal step. Thus, the time-temperature shrinkages anisotropy evolution depends on the evolution of the microstructure anisotropy driven by the diffusion phenomena occurring during the sintering process.
The comparison of dilatometry results from green and pre-sintered samples showed the main difference in the samples’ behaviour during the sintering before the isothermal step. Pre-sintered samples showed a clear thermal expansion, while green samples showed a combination of shrinkages and expansion. This behaviour could be related to slight rearrangement of the powder particles connected to the debinding process. Also, no significant shrinkages anisotropy is developed during this step.
The analysis of the dimensional variation results from dilatometry revealed the presence of a rapid increase in shrinkage rate during the sintering test performed up to 1370°C. This behaviour is assumed to be caused by the γ→δ transformation and will be confirmed by further microstructural characterisation in the second part of this paper [Citation17]. However, no direct relation was observed with the anisotropic sintering behaviour.
Acknowledgement
This work was conducted in the framework of the Centre for Additive Manufacturing – Metal (CAM2), supported by the Swedish Governmental Agency of Innovation Systems (Vinnova).
Disclosure statement
No potential conflict of interest was reported by the author(s).
Notes of contributors
Alberto Cabo Rios is currently a Ph.D. student at the Department of Industrial and Materials Science, Chalmers University of Technology, Sweden, with focus on experimental studies of sintering of metallic components produced by binder jetting additive manufacturing. Also, he is a research visitor in the powder technology laboratory (PTL), Mechanical Engineering Department at San Diego State University (SDSU), with focus on the advanced multi-physics modelling of sintering of components produced by binder jetting.
Eduard Hryha received his Ph.D. degree in Materials Engineering in 2008 from the Institute of Materials Research of the Slovak Academy of Sciences, Slovakia. He is currently a full professor at the Department of Industrial and Materials Science, Chalmers University of Technology. His main research activity is devoted to powder metallurgy and additive manufacturing.
Eugene Olevsky received his Ph.D. from Ukraine National Academy of Sciences in 1990. Since 1998, Dr Olevsky has been a faculty member of the Mechanical Engineering Department at San Diego State University. He is Dean of the College of Engineering since March 2018. His main research activity is devoted to experimentation and computational modelling on powder processing, including novel ceramic, metallic, composite materials synthesis, field-assisted sintering techniques and sintering-assisted additive manufacturing.
Peter Harlin received his Ph.D. degree in Materials Science in 2008 from Chalmers University of Technology. He is currently a research leader at the Department of Powder R&D at Sandvik Additive Manufacturing and adjunct senior lecturer at the Department for Subtractive and Additive Manufacturing at University West. His main research activity is devoted to powder metallurgy with focus on metal additive manufacturing.
References
- ASTM International. ISO/ASTM52900-15 Standard terminology for additive manufacturing – general principles – terminology. West Conshohocken (PA): ASTM International; 2015.
- Dudina DV, Bokhonov BB, Olevsky EA. Fabrication of porous materials by spark plasma sintering: A review. Materials (Basel). 2019;12:541.
- Wendel J, Manchili SK, Hryha E, et al. Sintering behaviour of compacted water-atomised iron powder: effect of initial state and processing conditions. Powder Metall. 2020;63:338–348.
- Molinari A, Menapace C, Torresani E, et al. Working hypothesis for origin of anisotropic sintering shrinkage caused by prior uniaxial cold compaction. Powder Metall. 2013;56:189–195.
- Mostafaei A, Elliott AM, Barnes JE, et al. Binder jet 3D printing – process parameters, materials, properties, and challenges. Prog Mater Sci. 2020;119:100707.
- Zavaliangos A, Missiaen JM, Bouvard D. Anisotropy in shrinkage during sintering. Sci Sinter. 2006;38:13–25.
- Hugonnet B, Missiaen JM, Martin CL, et al. Effect of contact alignment on shrinkage anisotropy during sintering: stereological model, discrete element model and experiments on NdFeB compacts. Mater Des. 2020;191:108575.
- Oh JW, Nahm S, Kim B, et al. Anisotropy in green body bending strength due to additive direction in the binder-jetting additive manufacturing process. Korean J Met Mater. 2019;57:227–235.
- Lecis N, Mariani M, Beltrami R, et al. Effects of process parameters, debinding and sintering on the microstructure of 316L stainless steel produced by binder jetting. Mat Sci and Eng A. 2021;828:142108.
- Barthel B, Hein SB, Aumund-Kopp C, et al. Influence of particle size distribution in Metal Binder Jetting – effects on the properties of green and sintered parts. Procedia EuroPM 2019: International Powder Metallurgy Congress and Exhibition 2019.
- Mostafaei A, Rodriguez De Vecchis P, Nettleship I, et al. Effect of powder size distribution on densification and microstructural evolution of binder-jet 3D-printed alloy 625. Mater Des. 2019;162:375–383.
- Zago M, Lecis NFM, Vedani M, et al. Dimensional and geometrical precision of parts produced by binder jetting process as affected by the anisotropic shrinkage on sintering. Addit Manuf. 2021;43:102007.
- Li M, Du W, Elwany A, et al. Metal Binder Jetting additive manufacturing: a literature review. J Manuf Sci Eng. 2020;142:1–17.
- Lee Y, Nandwana P, Simunovic S. Powder spreading, densification, and part deformation in binder jetting additive manufacturing. Prog Addit Manuf. 2021.
- Huber D, Vogel L, Fischer A. The effects of sintering temperature and hold time on densification, mechanical properties and microstructural characteristics of binder jet 3D printed 17-4 PH stainless steel. Addit Manuf. 2021;46:102114.
- Ziaee M, Tridas EM, Crane NB. Binder-Jet printing of fine stainless steel powder with varied final density. JOM. 2017;69:592–596.
- Cabo Rios A, Hryha E, Olevsky E, et al. Sintering anisotropy of binder jetted 316L stainless steel: part II –microstructure evolution during sintering. Powder Metall. 2021.
- Vagnon A, Lame O, Bouvard D, et al. Deformation of steel powder compacts during sintering: correlation between macroscopic measurement and in situ microtomography analysis. Acta Mater. 2006;54:513–522.
- Zhu Y, Wu Z, Hartley WD, et al. Unraveling pore evolution in post-processing of binder jetting materials: X-ray computed tomography, computer vision, and machine learning. Addit Manuf. 2020;34:101183.
- Wheat E, Shanbhag G, Vlasea M. The master sinter curve and its application to binder jetting additive manufacturing. J Manuf Sci Eng, Trans ASME. 2020;142:30–32.
- Frykholm R, Takeda Y, Andersson BG, et al. Solid state sintered 3-D printing component by using inkjet (binder) method. J Japan Soc Powder Powder Metall. 2016;63:421–426.
- Berginc B, Kampus Z, Sustarsic B. Influence of feedstock characteristics and process parameters on properties of MIM parts made of 316L. Powder Metall. 2007;50:172–183.
- Choi JP, Lee GY, Song Ji, et al. Sintering behavior of 316L stainless steel micro-nanopowder compact fabricated by powder injection molding. Powder Tech. 2015;279:196–202.
- German RM. Sintering trajectories: description on how density, surface area, and grain size change. J Mat. 2016;68:878–884.
- Verlee B, Dormal T, Lecomte-Beckers J. Density and porosity control of sintered 316 l stainless steel parts produced by additive manufacturing. Powder Metall. 2012;55:260–267.
- German RM. Sintering: from empirical observations to scientific principles. Elsevier; 2014. 6, Geometric Trajectories during Sintering. p. 141–181.