
 ?Mathematical formulae have been encoded as MathML and are displayed in this HTML version using MathJax in order to improve their display. Uncheck the box to turn MathJax off. This feature requires Javascript. Click on a formula to zoom.
ABSTRACT
Green density of binder jetted parts are typically equal or lower than the powder tap density. Also, anisotropic green porosity distribution is expected because of the characteristics of the binder jetting (BJ) printing process. In this study, the microstructure evolution in terms of phases and porosity characteristics was studied. A transition from irregular-shape interconnected porosity in pre-sintered samples to closed quasi-spherical porosity for samples sintered at 1370°C was observed. EBSD phase map showed ∼2.73% of δ-ferrite in sample sintered at 1370°C. The anisotropic porosity distribution was revealed by a higher area fraction of aligned large pores (>35 µm), within the cross-section perpendicular to the building direction. Chemical analysis showed an increase of C, O and N on the green sample, while a strong decrease was found after sintering when compared with the powder chemistry. δ-ferrite onset, from phase equilibrium calculations, varies from ∼1250°C (sintered sample chemistry) to ∼1350°C (powder chemistry).
Introduction
Like other powder-metallurgy manufacturing processes (e.g. spark plasma sintering, press and sintering, or hot isostatic pressing), Powder Bed Binder Jetting (BJ) can be used for manufacturing a wide range of metallic alloys. However, the inherent open porosity and complex geometries of BJ green components typically limit the sintering step to the use of conventional sintering (free-sintering). Some of the conventional sintering processes are solid-state sintering (SSS), supersolidus liquid phase sintering (SLPS) and liquid phase sintering (LPS). Solid-state diffusion mechanisms (e.g. grain boundary or lattice diffusion) drive the densification during SSS. LPS typically involves the presence of two or more small powder alloys of differing compositions. SLPS occurs when pre-alloyed powders are heated to a temperature between the liquidus and solidus. In the two last cases, some portion of liquid phase is present which boosts the sintering kinetics. Usually, alloys employed in BJ usually undergo SSS or SLPS. Widely used stainless steel alloys (e.g. 316L or 17–4 PH) sinter using SSS routes where possible phase transformations enhance the sintering kinetics [Citation1–3]. Other Nickel-based alloys like 625 or 718 involve SLPS, and the parts cannot retain their shape if the liquid volume fraction increases to above 40% [Citation4,Citation5]. Sintering conditions in terms of e.g. temperature, time, atmosphere, etc. should be precisely tuned for each alloy to achieve the desired properties in the end-application [Citation6].
Densification during conventional sintering depends on the initial density distribution of the green part, sintering process, and hardware [Citation7]. Despite the frequently reported isotropy on the final part properties [Citation8], the BJ process is inherently anisotropic, with preferential directions related to the printing process which may induce anisotropy on the green part microstructure (i.e. porosity distribution). Some of the possible microstructure anisotropy sources were summarised and categorised in [Citation9] as follows: morphological texture, anisotropic contact numbers, contact flattening, crystallographic texture, and porous layers. Powder compacts attained by the application of uniaxial pressing typically develop anisotropic sintering shrinkages caused by the anisotropic green structure with elongated oriented contact pores [Citation10,Citation11]. Tape casting green parts also experience high anisotropy during debinding and sintering caused by microstructural pore orientation and anisotropic contact numbers [Citation12]. Crystallographic texture can be achieved by applying magnetic field during compaction of powder, which can produce 1.5–2 times larger sintering shrinkage rates in the direction of magnetisation [Citation9,Citation13]. In additive manufacturing (AM) processes, specifically BJ, microstructural features causing anisotropy might relate to the specifics of the manufacturing process (e.g. layer thickness, powder spreading method or binder deposition) and the powder material characteristics (e.g. particle size distribution or powder morphology). The existence of porous layers perpendicular to the building direction (Z axis) within a green powder compact manufactured layer-by-layer typically causes higher sintering shrinkages parallel to the building direction [Citation7,Citation9,Citation14–16]. This effect has been related to different mechanisms: gravity effects and lower rigidity of the powder compact along the building direction [Citation4]; particle re-arrangement under the influence of gravity during sintering [Citation17,Citation18] or density fluctuations (porous regions) in the green part caused by the BJ printing process [Citation19].
In general, carbon and nitrogen content in stainless steel alloys (e.g. 17–4 PH and 316L) plays a key role in the microstructural evolution during the sintering process. Both C and N are strong austenite phase stabilisers. When thermoplastic binders are used to produce green components, carbon contamination could be an inherent problem. Residual carbon content could have noticeable impact on the phase transformations occurring during sintering, thus, enhancing or inhibiting the related densification kinetics effect [Citation20]. Also, the atmosphere used during sintering has a potential impact on microstructural evolution. If atmosphere containing nitrogen is used (e.g. H2-N2 mixtures), δ-ferrite formation can be inhibited because of the stabilisation of austenite by the diffused nitrogen atoms [Citation3]. Besides, decarburisation can occur during H2 sintering by carbon reaction with hydrogen, excessive amount of moisture (H2O) in the atmosphere or oxygen impurities in the powder [Citation3,Citation6]. Also, this decarburisation process can lead to microstructure heterogeneities.
Hence, in order to be able to understand the sintering behaviour of binder jetted components, a detailed investigation of the anisotropic dimensional evolution and the corresponding microstructural development in relation to the alloy chemical composition is required. In the first part of this paper [Citation21], the anisotropic shrinkage of the 316L BJ parts by performing various dilatometry sintering tests along the different sample’s directions was studied. Results clearly indicated that sintering shrinkages are 15% larger along the building direction. Besides, shrinkages along the powder recoating direction (Y axis) and printhead movement direction (X axis) were rather similar, but the tendency showed slightly larger shrinkages along the X-axis. The anisotropy factors derived from the shrinkage results showed that the development of anisotropy starts after the sintering onset, thus, caused by the characteristics of the powder particles arrangement. The anisotropy factors were not a constant value during the sintering but increased with the densification, reaching a similar final value of ∼1.15 for all sintering conditions studied. No significant anisotropy was originated during the debinding step. Finally, a rapid increase in shrinkage rate on the sintering was found above 1340°C, assumed to be caused by the γ→δ transformation.
The second part of this study, summarised in this paper, provides in-depth analysis of the microstructure and chemical analysis of BJ samples, sintered at the different conditions as well as sampled during different stages of the sintering process, obtained using interrupted sintering trials, as described in the companion paper [Citation21]. Pre-sintered and sintered microstructures were characterised along three cross-sections theoretically defined by the orthogonal sample’s axis. Light optical microscopy (LOM) images were used to perform thorough statistical analysis of the porosity structure characteristics (i.e. pore size and shape distribution). Sintered microstructures of samples subjected to different thermal cycles were characterised by electron backscattered diffraction (EBSD) technique. Different results from the experiments are discussed and conclusions are drawn regarding the evolution of possible microstructure anisotropy during the sintering of the BJ manufactured components. Besides, chemical analysis was done on the material at different states during the BJ manufacturing process: raw powder, green, pre-sintered and sintered samples. Finally, these results were used to evaluate the effect of C, N and O content on the microstructure evolution during sintering by calculations of the phase equilibrium using ThermoCalc software.
Materials and methods
Binder jetted samples were produced using the ExOne Innovent+ binder jetting printer and Sandvik Osprey® 316L stainless steel powders. The binder used was an industry-standard aqueous-based organic binder. The printing parameters used for the manufacturing of the binder jetting samples were reported in the previous companion paper [Citation21]. Powder chemistry and physical properties (particle size and tap density) were provided by the powder alloy manufacturer and are summarised in and , respectively.
Table 1. Chemistry of the 316L powder used for BJ samples manufacturing (wt.%).
Table 2. Properties of experimental powder.
The chemical analysis of the BJ samples was done using combustion analysis (HFIR), melt extraction technique (EXTR) and X-ray Fluorescence Spectrometry elemental analysis (XRF). The C- and S content was measured using HFIR, O- and N content was measured using EXTR and the other chemical elements was measured using XRF.
Microstructure characterisation was performed on cubic samples with a side of 10 mm, described in the companion paper [Citation21]. The relation between samples’ axes and the printing directions is defined as: building direction (Z axis), printhead movement (X axis) and recoating direction (Y axis). A bulk density of 7.95 mg/mm3 was assumed for the 316L alloy used in this study. Samples were subjected to the dilatometry sintering tests detailed in [Citation21]. A summary of the samples ID and the respective sintering parameters are summarised in
. All sintering tests were performed under high-purity hydrogen atmosphere (99.9999%) in dilatometer Netzsch 402C, to ensure good reduction atmosphere.
Table 3. Sample’s ID and sintering parameters used for the dilatometry sintering tests [Citation21].
The cube’s weight and dimensions of the different sample states (i.e. green, pre-sintered and sintered) were measured. A manual calliper with a resolution of 0.01 mm and high precision balance with a resolution of 0.0001 g were used. These measurements were employed to calculate the relative density of the samples at each state. In this study, the term ‘geometry-based density’ was used for the results obtained from manual geometry and weight measurements. The bulk density of the sintered samples with closed porosity was also measured via the Archimedes principle, following the standard method described in [Citation22]. The term ‘Archimedes density’ was used for this case.
In this study, the microstructure of the samples in the pre-sintered and sintered states was analysed using sample cross-sectional optical micrographs. From the anisotropy study of each samples set (P-1300C, P-1370C and G-1370C), three cross-section planes from cubic samples were analysed: XZ, YZ and XY. For the pre-sintered microstructure characterisation, three pre-sintered samples were cut along the three different cross section planes. For the sintered state characterisation, each dilatometry-sintered sample was cut along a cross-section plane, comprising all three planes for each sintering condition studied. Samples subjected to interrupted sintering trials were cut along the XZ plane. Cut cross-sections were mounted, grinded and polished using a Struers Tegrapol-11 automatic system. Finally, images were obtained using a Zeiss Axioscope 7 light optical microscope (LOM). All the LOM images were taken with a resolution of 0.22 µm/pixel. Images were sub-divided into 30 × 30 regions of interest (ROI) and sub-images extracted to be measured individually. ImageJ software was used to measure the area fractional density on each sub-image, and the average and standard deviation values were obtained for each sample. The term ‘LOM-based density’ was used for the values obtained using the image analysis method. Also, the pore morphology (i.e. size and shape parameters) of selected sintered samples were analysed using Fiji particle analysis plug-in [Citation23].
Pores located at the edges of the sub-images were automatically excluded by Fiji. Also, any pore with an area < 0.3 µm2 (6 pixels) was excluded to reduce the noise. The area distribution of the pores, based on the equivalent circle diameter (CED), was calculated by summing up the total pore area from each pore size class defined. The aspect ratio (AR) and circularity pore shape parameters are calculated by the Fiji particle analysis module as follows [Citation23]:
A scanning electron microscope Zeiss Leo Gemini 1550 with a field emission gun (FEGSEM) was used for microstructure characterisation. Grains with different lattice structures were identified by the electron backscattered diffraction (EBSD) technique and data were postprocessed by using open-source MTEX code [Citation24]. All EBSD measurements were performed with a step size of 0.5 μm and an acceleration voltage of 20 kV. The acquired phase maps were processed after the acquisition, i.e. minor noise reduction was applied. High angle grain boundaries (twin boundaries) were defined by a misorientation of ∼60° and are illustrated by white lines in the resulting maps. The misorientation value of ∼60° found for the twin boundaries is typical for annealed 316L stainless steels [Citation25]. Non-indexed data were related to the porous areas and is illustrated by black coloured areas in the resulting maps.
The thermodynamic theoretical calculations concerned with the phase equilibrium diagrams were carried out with Thermo-Calc Software using TCFE11 Steels/Fe-alloys database.
Results and discussion
Full sintering cycles
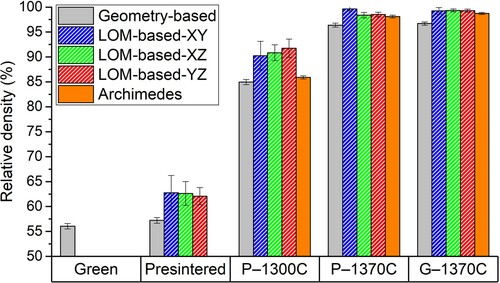
Density measurements are presented in . A relative green density of ∼56.1%, that is slightly lower than the tap density of 60.4% for the 316L powder, was obtained. Note that no LOM-based density measurements were done on the green samples because of the low green strength. Generally, with increasing sintering temperature the solid volume fraction increases and a progression from irregular, inter-connected porosity to more equiaxed pores is observed [Citation4,Citation7,Citation17]. Density measurements in P-1370C and G-1370C samples showed high densification allowing to reach 96%–99% relative density, while samples sintered at 1300°C, resulted in lower density of about 85%–90%. In general, LOM-based density results from different cross-sections are relatively similar but typically higher than geometry-based and Archimedes density measurement results. This difference tends to decrease as the measured density increases. Archimedes density is typically only ∼1% higher than geometry-based density, this may be caused by the omitted surface roughness effect when measuring the volume with a calliper.
Figure 1. Relative densities for studied samples at the green and pre-sintered states, together with the sintered densities of each sample’s sets sintered using the corresponding thermal routes. Density values obtained by different measurement methods are presented: geometry-based, LOM-based and Archimedes method.
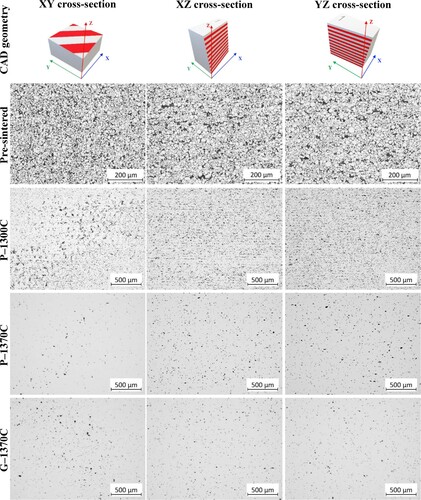
shows cross-sectional optical micrographs with the general microstructure of the samples and visible details of the shape, size and distribution of porosity. Samples from each set of dilatometry tests were characterised along different planes, thus each cross-section plane (XY, XZ, YZ) from each samples set was analysed. Identical global porosity structure for all samples within a set, i.e. subjected to the identical sintering parameters, can be assumed. It could be expected that, during metallographic preparation (i.e. cutting, grinding and polishing), cross-sections could slightly deviate from a perfect orthogonal plane. For illustration purposes, these CAD geometry cross-sections are showed in with a small arbitrary inclination angle. Also, a layered structure was added to imitate the effect of the layer-by-layer BJ printing process, with a thicker layer thickness for easier visualisation. Pre-sintered samples’ LOM images in show the characteristic interconnected porosity structure created by the initial small neck formation after pre-sintering [Citation26]. Several larger pores were observed within the XZ and YZ cross-sections, preferentially aligned along the horizontal direction (building plane) [Citation4], while no preferential orientation was observed within the XY plane. Samples sintered at 10°C/min up to 1300°C (P-1300C) showed a combination of large irregular-shape and small quasi-spherical pores. As shown in the pre-sintered microstructure, larger elongated pores were found to be oriented with the longest dimension parallel to the x- or y-axis within the XZ and YZ cross-sections. This is most likely related to the interlayered porosity formed during printing, where large pores are usually found between layers [Citation4,Citation7,Citation17,Citation27]. Samples sets sintered at 5°C/min up to 1370°C (P-1370C and G-1370C) showed rather homogeneous distribution of quasi-spherical small pores for all the cross-sections. In general, XY cross-sections of sintered samples (P-1300C, P-1370C and G-1370C set) showed a particular pore distribution, where larger pores seem to be aligned together in specific areas along an arbitrary direction. This effect could relate to the 3D porosity arrangement and sample characterisation procedure discussed previously. Hence, clusters of larger pores located within periodical planes along Z (building direction) would produce the porosity distribution observed within XY cross-sections. This effect was also illustrated in the XY cross-section of the sample CAD geometry from .
Figure 2. Optical micrographs of the BJ samples cross-sections made along the three quasi-orthogonal planes XY, XZ and YZ. Micrographs from pre-sintered state samples and sintered samples from each sample’s set: P-1300C, P-1370C and G-1370C. For illustration purposes, the corresponding cross-sections were done to the CAD geometry, where a layered structure was visualised by alternating coloured slices.
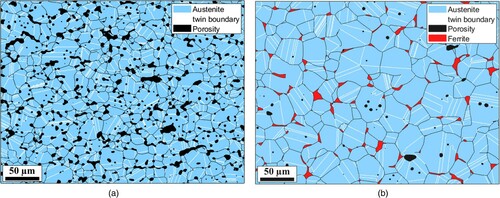
The final microstructure of the samples sintered at the two different temperatures of 1300°C and 1370°C was characterised using EBSD technique. (a) and (b) shows the EBSD map obtained from XZ cross-sections of samples sintered at 1300°C and 1370°C, respectively. The map represents the different phases, porosity, grain boundaries and twin boundaries for each case. For the sample sintered up to 1370°C, a mixture of FCC austenite (γ), BCC ferrite phase (δ-ferrite) and porosity was obtained. The presence of δ phase confirmed the dilatometry results obtained in the first part of this study [Citation21], where shrinkages were boosted above 1340°C. Other studies reported the same effect from the formation of δ-ferrite during sintering [Citation1,Citation3,Citation20,Citation28]. EBSD map shows δ-ferrite grains surrounding γ grains, especially at the junctions between the grains. The location of δ-ferrite can be related to the location of larger pores before the onset of the phase transformation. This could relate to the free surfaces of the pores having the highest nucleation rate, together with the lowest mis-fit strain energy [Citation29]. Spherical pores located inside the γ grains were detected. EBSD maps of the sample sintered up to 1300°C showed the presence of γ grains and porosity. The porosity was observed to be a mixture of small (CED < 10µm) quasi-spherical pores mainly located inside γ grains and large irregular pores (CED > 10µm) located between grains. Also, smaller γ grains were observed in the sample sintered at 1300°C.
Figure 3. Phase maps obtained by EBSD in the XZ cross-sections from the samples set: (a) P-1300C and (b) P-1370C, where the FCC (austenite), BCC (δ-ferrite) and non-indexed (porosity) phases are shown in blue, red and black, respectively. Grain boundaries are shown as black lines, while twin boundaries within austenitic grains are shown in white.
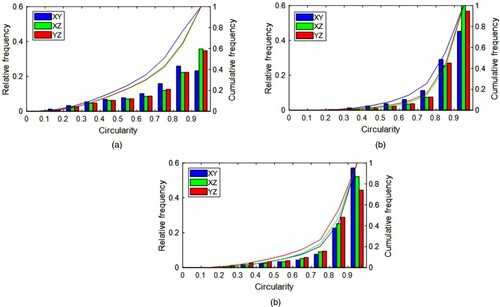
The microstructure within each cross-section was qualitatively discussed previously from images presented in . Then, a detailed statistical analysis of the porosity was performed by image analysis. Pore area-size distribution, aspect ratio (AR) and circularity shape parameter results are presented as histograms in , and , respectively. First, the results from the different cross-sections of each sintered samples set (P-1300C, P-1370C and G-1370C) were analysed. These results were normalised with respect to the total area or a total number of pores, so results could be compared between different sample sets. In general, the pore area-size results in showed a skewed right distribution, where the largest area fraction corresponds to pores with a CED between 5 and 10 µm. However, XY cross-sections results showed a slightly more spread distribution, where large pores (CED > 35 µm) have a relatively higher area fraction. Indeed, from P-1370C and G-1370C set results, outlier values were found for pores with CED > 40 µm. These results can relate to the aligned large pores population identified in XY cross-section images from . Thus, large pores identified within XY cross-sections could be inherited from the interlayered non-homogeneous porosity produced by the BJ printing process. This population showed up as outlier values because the increase of its relative area fraction when sintering at higher temperatures decreased the total porosity. In general, AR histograms in show a skewed right distribution with a higher relative frequency for values between 1 and 1.5. XY cross-sections results in (a) and (b) showed slightly higher frequency for the larger AR bins which could relate to the identified larger pores aligned in the XY cross-section. However, the G-1370C set results in (c) show similar distribution. In general, circularity histogram results in show a skewed left distribution with the highest frequency for values between 0.9 and 1. This is related with the pores’ shape tends to become circular during sintering [Citation11,Citation17,Citation26]. Similar tendency for the XY cross-section can be found here, with a high frequency of pores with lower circularity. Thus, the increased population of large pores within XY cross-section of pre-sintered samples sintered at 1300°C and 1370°C might relate to the increased AR and decreased circularity. In contrast, the higher relative area fraction of large pores within XY cross-section of green samples sintered at 1370°C did not influence particularly the shape parameters’ distribution. The cause of this fact could be related to a slight variation in the debinding step, which was included in the dilatometry tests.
Figure 4. Normalised histograms and cumulative distributions of pore area as function of the equivalent diameter for each sample set: (a) P-1300C, (b) P-1370C and (c) G-1370C. The data sets correspond to the different cross-sectional data: XY, XZ and YZ.
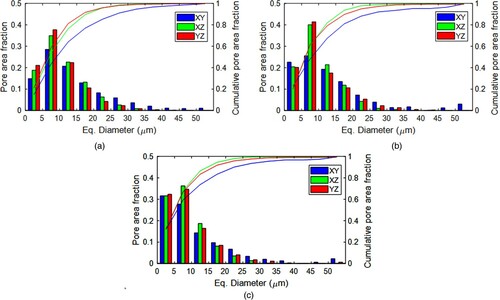
Figure 5. Normalised histograms and cumulative distributions of pores aspect ratio for each sample set: (a) P-1300C, (b) P-1370C and (c) G-1370C. The data sets correspond to the different cross-sectional data: XY, XZ and YZ.
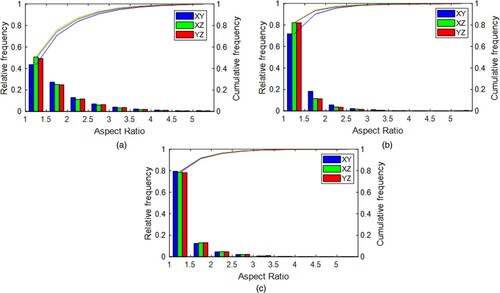
Figure 6. Normalised histograms and cumulative distributions of pores circularity for each sample set: (a) P-1300C, (b) P-1370C and (c) G-1370C. The data sets correspond to the different cross-sectional data: XY, XZ and YZ.
The influence of the sintering conditions on the porosity parameters distribution was also studied by combining the cross-section’s results from each sample set. In this case, the histogram analysis was done without normalisation of the data to show the difference of porosity characteristics for different sintering conditions. In general, the cumulative pore area results showed in (a) was larger for the samples sintered at the lowest temperature of 1300°C (P-1300C set). This relates to the lower shrinkages from the dilatometry experiments [Citation21], caused by smaller densification observed in this case. Densification was principally lower in absence of δ-ferrite transformation during sintering at 1300°C. For the samples’ sets sintered at the highest temperature of 1370°C, the results showed slightly higher cumulative pore area when pre-sintered samples were subjected to the dilatometry tests [Citation21].
Figure 7. Histograms and cumulative distributions for each sample set of: (a) pore area as function of the equivalent diameter, (b) aspect ratio and (c) circularity.
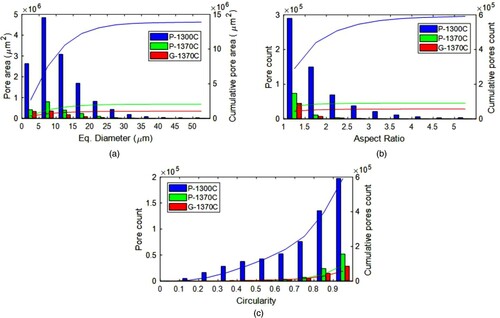
(b) and (c) shows the histograms of AR and circularity shape descriptors results. In general, these results show the typical closed quasi-spherical porosity for samples sintered at 1370°C (P-1370C and G-1370C), with most of the values close to 1 for both parameters and low cumulative pore counts values when compared to the values from samples sintered at 1300°C (P-1300C). An intermediate state with a combination of irregular-shaped and quasi-spherical porosity was found when sintering up to 1300°C. Even though the peak of the distribution was located at a value of 1, pore count results for high AR and low circularity values were relatively high. This showed that samples sintered at 1300°C did not reach the last stage of sintering, where mostly closed quasi-spherical porosity is typically present within the microstructure. Whereas samples sintered at 1370°C (P-1370C and G-1370C) reached the last sintering stage showing mostly quasi-spherical porosity. This porosity is more difficult to eliminate during the last stages of the sintering process, particularly pores located inside the grains, where diffusion along grain boundaries is no longer active [Citation30]. In this study, it is observed that δ-ferrite formation during sintering at high temperatures has a significant contribution to the reduction of large irregular porosity present in the BJ 316L microstructures.
Interrupted sintering cycles
The cross-sectional LOM micrographs in (a) show the general microstructure of the samples and details of the porosity characteristics from the different interrupted sintering tests at temperatures of 1000°C, 1100°C and 1200°C. In general, when the sintering temperature condition was increased, the density increased, and the large porosity observed at 1000°C transformed towards a mixture of small and large irregular pores. In the sample sintered at 1200°C, regions with large irregular and potentially interconnected pores can be observed. Those large pores are the most challenging when attempting to reach full densification of binder jet samples through sintering. As discussed, the presence of δ-ferrite enhanced the densification during the sintering process, thus, possibly closing most of these large pores observed when sintering at lower temperature conditions.
Figure 8. Microstructural characterisation and density results from samples subjected to interrupted sintering tests: (a) Optical micrographs of the BJ samples XZ cross-sections; (b) normalised histograms and cumulative distributions of pore area as function of the equivalent circle diameter (CED); pore aspect ratio and circularity; (c) geometry-based and LOM-based relative densities from sintered samples.
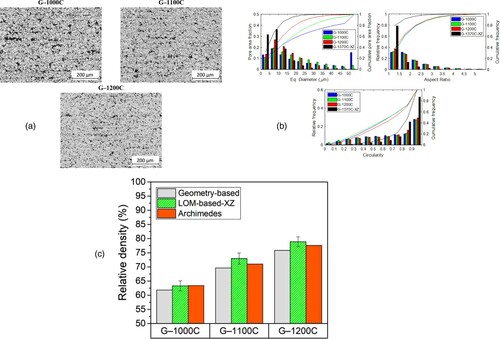
Statistical analysis of the porosity confirms the qualitative interpretation of the microstructures in (b). Aspect ratio and circularity histograms indicate a slight tendency for the reduction of the irregularity of the pore shape when temperature increases. The results from the XZ cross-section of the sample sintered up to 1370°C were shown for comparison, which indicates that the reduction of irregularity (decreased AR and/or increased circularity) mainly occurs above 1200°C. Furthermore, the pore area-size distribution results showed a clear evolution of the pore area during the temperature range studied. At 1000°C the large interconnected porosity is represented by the pore area fraction corresponding to pores with a CED > 50 µm. These large regions of interconnected porosity were observed to be reduced with increasing temperature and almost vanished at 1200°C. As discussed above, the LOM-based density values from the interrupted sintering samples are recurrently higher than the geometry-based values.
Thermodynamic calculations on the microstructure evolution during sintering
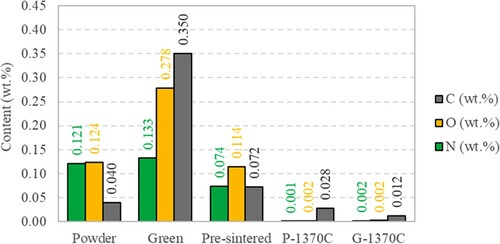
shows the results of the chemical analysis performed to follow the change in carbon, nitrogen, and oxygen in samples at the different stages of the BJ manufacturing process: raw powder, green (as-printed), pre-sintered (900°C for 60 min) and sintered at different conditions. For the samples sintered at 1370°C, a sample sintered from the green state (G-1370C) and other from the pre-sintered state (P-1370C) were analysed. The results show that green sample has the highest content of carbon and oxygen owing to the presence of the binder ink in the sample, deposited during printing. After pre-sintering, all three interstitial elements decreased owing to the binder removal during debinding process. However, carbon was found to be higher in the green state than in the powder. A possible explanation for this observation is that the higher C content is caused by minor binder residuals within the open porous surface remaining after the low-temperature pre-sintering. When samples were sintered up to 1370°C for 60 min, chemical analysis revealed a clear decrease of O and N content to trace values. Besides, the C content of the sintered samples was reduced to values slightly lower than the raw powder. Note that the chemical analysis does not determine if the element is an interstitial in the metal alloy or is forming other compounds on the surface (e.g. binder).
Figure 9. Element content of C, O, and N (wt.%) measured in samples at different stages of binder jetting: raw powder, green, pre-sintered at 900°C, sintered at 1370°C from initial pre-sintered sample (P-1370C) and sintered at 1370°C from initial green sample (G-1370C) specimens.
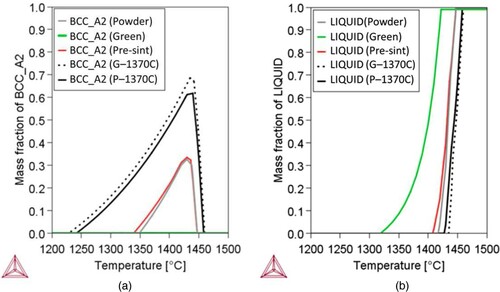
Thermodynamic calculations were conducted by using the values of C, N and O content from each sample state according to , to display the possible influence of the chemical composition on the equilibrium phases. In the companion paper [Citation21], the important effect of the δ-ferrite phase on shrinkages and densification behaviour during sintering was evidenced. Thus, the potential effect of chemical composition on the sintering shrinkages evolution is linked to the delta-ferrite phase. However, anisotropy was not directly connected to the phase transformation. It can be argued that the chemical evolution would not directly affects anisotropy. But is still unclear if the porosity structure present when the phase transformation starts would affect how anisotropy develops afterwards. Also, is crucial to predict the potential formation of liquid phase, which could lead to high geometric distortions and melting. Thus, the equilibrium diagram of δ-ferrite (BCC_A2) and liquid (LIQUID) phase from each sample’s chemical composition was calculated and presented in (a) and (b), respectively. The increased C and N content in the green sample leads to the suppression of the δ-ferrite formation and a noticeable swift of liquid phase curve to lower temperatures. However, green sample chemistry values are highly affected by the presence of the binder ink, which is removed during debinding and heating stages and hence has minor or no effect on the steel phase transformation. The phase diagram curves for powder and pre-sintered sample are relatively analogueous, with δ-ferrite and liquid phase stability onset at ∼1350°C and ∼1410°C, respectively. Also, the phase diagram curves for both sintered samples are relatively similar, with δ-ferrite and liquid phase stability onset at ∼1250°C and ∼1440°C, respectively. These results clearly display the high influence of N, C or O content on the phase equilibrium.
Figure 10. Effect of C, N and O content obtained from the chemical analysis for the different samples states on the equilibrium phase diagram: raw powder, green, pre-sintered at 900°C, sintered at 1370°C from initial pre-sintered sample (P-1370C) and sintered at 1370°C from initial green sample (G-1370C). Effect on (a) δ-ferrite phase equilibrium and (b) liquid phase equilibrium.
Typically, the powder chemical composition is used as input to predict the possible phase transformations during the sintering process. However, the analysis of sintered samples chemical composition showed a decrease in C, O, and N content after sintering. Despite small difference in the chemical composition, its effect on the 316L stainless steel phase equilibrium diagram is significant, especially on the formation of the δ-ferrite phase. Dilatometry sintering curves obtained from experiments with BJ manufactured 316L samples [Citation21] showed an onset of shrinkage behaviour caused by δ-ferrite at ∼1340°C. This result agrees well with the phase equilibrium results obtained using the powder chemical composition. Also, EBSD phase maps presented in demonstrated the absence of δ-ferrite for samples sintered up to 1300°C, while sample sintered at 1370°C presented ∼2.73% of δ-ferrite. According to the phase equilibrium diagram, a larger fraction of δ-ferrite is stable at 1370°C. Nevertheless, part of the δ-ferrite likely transforms to austenite during the stage where cooling at 30°C/min was applied [Citation21]. Initially, these results support the use of the powder chemical composition as a reference to predict the phases present during sintering. But, a detailed experimental analysis of the phase evolution during sintering and detailed kinetic modelling of the phase transformations would be useful to get full understanding of this important phenomenon occurring during sintering of BJ 316L.
Summary and conclusions
The microstructure evolution of the 316L binder jet components was studied after various pre-sintering and sintering treatments. Previous work showed the anisotropic evolution of the shrinkages during sintering, with ∼15% larger shrinkages occurring along the building direction (Z axis) for the specific powder studied [Citation21]. In this study, the microstructure characterisation suggests a slight anisotropy of the porous structure evolution. Also, the phases present after sintering were analysed by means of EBSD and the density values were obtained. Finally, the chemical analysis was carried out to obtain the C, N and O content of samples at different states of the BJ multi-step manufacturing process, and the respective phase diagrams were obtained using the Thermo-Calc software. The following main conclusion could be drawn:
A relative green density of ∼56.1%, that is slightly lower than the tap density (60.4%) of the 316L powder, was obtained after printing. Sintering tests up to 1370°C at 5°C/min showed high densification up to 96%–99% relative density. Sintering at lower temperature of around 1300°C at 10°C/min showed lower densification up to 85%–90%. Archimedes density values are typically only ∼1% higher than geometry-based density. This confirms the geometry-based density measurements accuracy for this type of BJ cubic samples, where the external dimensions can be precisely measured.
Analysis of the microstructure of pre-sintered and sintered samples showed a solid volume fraction increase with the sintered temperature and a progression from irregular, inter-connected porosity to more isolated equiaxed pores. Pre-sintered XZ and YZ cross-sections of the microstructure show larger pores oriented along the building plane, likely related to the interlayered porosity formed during printing.
EBSD analysis of the sintered microstructure of sample sintered at1370°C revealed the presence of δ-ferrite, whereas sample sintered at 1300°C revealed a fully austenitic phase. These results agree with the findings in [Citation21], where a second onset of the shrinkage behaviour at ∼1340°C was related with the δ-ferrite formation. δ-ferrite grains are located surrounding γ grains, especially at the junctions between the grains.
Statistical analysis of the porosity in sintered samples supports the anisotropic porosity distribution observed in the LOM images of different cross-sections. Pore area-size results from XY cross-sections showed a noticeable different frequency distribution, with large pores (>35 µm) having a relatively higher area fraction. These large pores identified within the XY cross-sections might be inherited from the larger interlayered porosity produced by the BJ printing process.
Chemical analysis of samples at different states showed a noticeable increase in the O and C content in the green state when compared to the initial powder content, caused by the presence of the binder. Pre-sintered samples had a chemical composition similar to the powder feedstock. A clear decrease of C and N content down to insignificant values was obtained for the samples sintered up to 1370°C, while C was slightly lower than the powder content. The phase diagrams were calculated and compared for the different combinations of C, O and N content. A noticeable difference in the δ-ferrite phase diagram for the initial powder/pre-sintered samples versus sintered samples’ phase composition was obtained. It can be concluded that initial powder chemical composition can be used for the calculation of the phase diagrams to predict phase evolution during sintering with reasonable accuracy.
Acknowledgement
This work was conducted in the framework of the Centre for Additive Manufacturing – Metal (CAM2), supported by the Swedish Governmental Agency of Innovation Systems (Vinnova).
Disclosure statement
No potential conflict of interest was reported by the author(s).
Additional information
Notes on contributors
Alberto Cabo Rios
Alberto Cabo Rios is currently a Ph.D. Student at the Department of Industrial and Materials Science, Chalmers University of Technology, Sweden, with focus on experimental studies of sintering of metallic components produced by binder jetting additive manufacturing. Also, he is a research visitor in the powder technology laboratory (PTL), Mechanical Engineering Department at San Diego State University (SDSU), with focus on the advanced multi-physics modelling of sintering of components produced by binder jetting.
Eduard Hryha
Eduard Hryha received his Ph.D. degree in Materials Engineering in 2008 from the Institute of Materials Research of the Slovak Academy of Sciences, Slovakia. He is currently a full professor at the Department of Industrial and Materials Science, Chalmers University of Technology. His main research activity is devoted to powder metallurgy and additive manufacturing.
Eugene Olevsky
Eugene Olevsky received his Ph.D. from Ukraine National Academy of Sciences in 1990. Since 1998, he has been a faculty member of the Mechanical Engineering Department at San Diego State University. He is the Dean of the College of Engineering since March 2018. His main research activity is devoted to experimentation and computational modelling on powder processing, including novel ceramic, metallic, composite materials synthesis, field-assisted sintering techniques and sintering-assisted additive manufacturing.
Peter Harlin
Peter Harlin received his Ph.D. degree in Materials Science in 2008 from Chalmers University of Technology, Sweden. He is currently research leader at the Department of Powder R&D at Sandvik Additive Manufacturing and adjunct senior lecturer at the Department for Subtractive and Additive Manufacturing at University West. His main research activity is devoted to powder metallurgy with focus on metal additive manufacturing.
References
- Berginc B, Kampus Z, Sustarsic B. Influence of feedstock characteristics and process parameters on properties of MIM parts made of 316L. Powder Metall. 2007;50:172–183.
- Shu GJ, Hwang KS, Pan YT. Improvements in sintered density and dimensional stability of powder injection-molded 316L compacts by adjusting the alloying compositions. Acta Mater. 2006;54:1335–1342.
- Wu Y, Blaine D, Marx B, et al. Sintering densification and microstructural evolution of injection molding grade 17-4 PH stainless steel powder. Metall Mater Trans A. 2002;33:2185–2194.
- Mostafaei A, De Vecchis P R, Netleship I, et al. Effect of powder size distribution on densification and microstructural evolution of binder-jet 3D-printed alloy 625. Mater Des. 2019;162:375–383.
- Özgün Ö, Gulsoy HO, Yilmaz R, et al. Microstructural and mechanical characterization of injection molded 718 superalloy powders. J Alloys Compd. 2013;576:140–153.
- Hryha E, Dudrova E, Nyborg L. On-line control of processing atmospheres for proper sintering of oxidation-sensitive PM steels. J Mater Process Technol. 2012;212:977–987.
- Mostafaei A, Elliott AM, Barnes JE, et al. Binder jet 3D printing – process parameters, materials, properties, and challenges. Prog Mater Sci. 2020;100707.
- Mirzababaei S, Pasebani S. A review on binder Jet additive manufacturing of 316L stainless steel. J Manufact Mater Process. 2019;3:82.
- Hugonnet B, Missiaen JM, Martin CL, et al. Effect of contact alignment on shrinkage anisotropy during sintering: stereological model, discrete element model and experiments on NdFeB compacts. Mater Des. 2020;191:108575.
- Vagnon A, Lame O, Bouvard D, et al. Deformation of steel powder compacts during sintering: correlation between macroscopic measurement and in situ microtomography analysis. Acta Mater. 2006;54:513–522.
- Torresani E, Giuntini D, Zhu C, et al. Anisotropy of mass transfer during sintering of powder Materials with pore–particle structure orientation. Metall Mater Trans A. 2019;50:1033–1049.
- Fu Z, Polfer P, Kraft T, et al. Three-dimensional shrinkage behavior of Green tapes derived from spherical-shaped powders: experimental studies and numerical simulations. J Eur Ceram Soc. 2015;35:2413–2425.
- Zavaliangos A, Missiaen JM, Bouvard D. Anisotropy in shrinkage during sintering. Sci Sinter. 2006;38:13–25.
- Gonzalez JA, Mireles J, Lin Y, et al. Characterization of ceramic components fabricated using binder jetting additive manufacturing technology. Ceram Int. 2016;42:10559–10564.
- Oh JW, Nahm S, Kim B, et al. Anisotropy in Green body bending strength owing to additive direction in the binder-jetting additive manufacturing process. J Korean Inst Metals Mater. 2019;57:227–235.
- Manière C, Kerbart G, Harnois C, et al. Modeling sintering anisotropy in ceramic stereolithography of silica. Acta Mater. 2020;182:163–171.
- Zhu Y, Wu Z, Hartley WD, et al. Unraveling pore evolution in post-processing of binder jetting materials: X-ray computed tomography, computer vision, and machine learning. Additive Manufact. 2020;34:101183.
- Wakai F, Chihara K, Yoshida M. Anisotropic shrinkage induced by particle rearrangement in sintering. Acta Mater. 2007;55:4553–4566.
- Wheat E, Vlasea M, Hinebaugh J, et al. Sinter structure analysis of titanium structures fabricated via binder jetting additive manufacturing. Mater Des. 2018;156:167–183.
- Wu Y, German RM, Blaine D, et al. Effects of residual carbon content on sintering shrinkage, microstructure and mechanical properties of injection molded 17-4 PH stainless steel. J Mater Sci. 2002;37:3573–3583.
- Cabo A, Hryha E, Olevsky E, et al. Sintering anisotropy of binder jetted 316L stainless steel: part I – sintering anisotropy. Powder Metall. 2021.
- ASTM International. Standard Test Methods for Density of Compacted or Sintered Powder Metallurgy (PM) Products Using Archimedes’ Principle. Astm B962-13 2013;i:
- Schindelin J, Arganda-Carreras I, Frise E, et al. Fiji: an open-source platform for biological-image analysis. Nat Methods. 2012;9: 7 2012;9:676–682.
- Bachmann F, Hielscher R, Schaeben H. Grain detection from 2d and 3d EBSD data-specification of the MTEX algorithm. Ultramicroscopy. 2011;111:1720–1733.
- Odnobokova M, Kipelova A, Belyakov A, et al. Microstructure evolution in a 316L stainless steel subjected to multidirectional forging and unidirectional bar rolling. IOP Conf Ser: Mater Sci Eng. 2014;63.
- German RM. Geometric Trajectories during Sintering. In: Sintering: from Empirical Observations to Scientific Principles. 2014. p. 141–181.
- Miyanaji H, Momenzadeh N, Yang L. Effect of powder characteristics on parts fabricated via binder jetting process. Rapid Prototyp J. 2019;25:332–342.
- Jung IMDOO, Ha S, Park SJIN, et al. Two-Phase master sintering curve for 17-4 PH stainless steel. Metall Mater Trans A. 2016;47:5548–5556.
- Porter DA, Easterling KE, Sherif MY. Phase transformations in Metals and alloys. 3rd ed. London: Taylor & Francis; 2009.
- Burke JE. Role of grain boundaries in sintering. J Am Cer Soc. 1957;40:80–85.