
 ?Mathematical formulae have been encoded as MathML and are displayed in this HTML version using MathJax in order to improve their display. Uncheck the box to turn MathJax off. This feature requires Javascript. Click on a formula to zoom.
ABSTRACT
In the present study, crack propagation through the case hardened region of two different PM steels manufactured with different powder size distributions and sintered at different temperatures has been investigated. EBSD was used to study the microstructure before and after case hardening, revealing the relationship between powder particle grains after sintering and prior austenite grains after case hardening. A novel approach was used to achieve short cracks (10–20 µm) with high repeatability. The cracks were then analysed using EBSD and SEM, revealing detailed and novel information about the crack propagation route in the materials. Both tested materials show the same crack propagation behaviour. If a prior grain/prior austenite boundary is present within an angle from the crack initiation site, the cracks will follow the boundary and thus propagate intergranular, suggesting that the preferred route of crack propagation in case hardened sintered steel is along these boundaries.
1. Introduction
The complex shape of many parts manufactured for the automotive industry suits the production route of sintered powder metal steel (PM), where the production of near-net-shape components in large quantities, with a small amount of inherent energy from production compared to wrought components, is feasible by pressing and sintering alone. The porosity will decrease the overall weight of the component and provide the steel with beneficial sound-absorbing properties [Citation1], which could be of benefit for the automotive industry with the arrival of electric vehicles where the combustion engine is no longer the main sound source. During the compaction, the material can, to some extent, be placed where it is most needed. An example of this is lightening holes that can be produced without secondary operation. Gears with a weight reduction of 15%, half stemming from the lower density material and a half from lightening holes, have been produced [Citation2].
The mechanical properties of sintered steel depend on the density, where higher density gives better mechanical properties [Citation3]. A relative density of up to about 94% results in a pore structure that is, to some extent or fully interconnected [Citation4]. Materials with roughly the same density but with different number and sizes of pores will exhibit different mechanical properties, whereas smaller pores are often beneficial [Citation5]. Other factors are pore morphology, connectivity, and distribution, although the latter has been shown to have a smaller impact than expected on the mechanical properties [Citation6].
1.1. PM steel microstructure
The initial powder particles are often pre-alloyed to some degree meaning that the composition of the powder particles is decided during the solidification process. After solidification and heat treatment of the powder, the particles normally consist of a smaller number of grains separated by high-angle grain boundaries (>10 degrees) and multiple low-angle grain boundaries (<2 degrees) [Citation7]. Alloying elements can also be admixed in the powder mix, where the added particles adhere to the surface of the base powder. During the sintering step of the manufacturing process, adjacent powder particles bond to each other in two stages. In the first stage, sintering necks are formed between the powder particles, and in the second stage, the total volume decreases. If the crystallographic orientation between two adjacent particle grains is somewhat similar, they can coalesce during the sintering step, removing the boundary between the grains. If the misalignment in the crystallographic direction is high, the boundary between the particles remains [Citation8]. The grain boundaries from the latter therefore exist as a consequence of the prior particle boundaries. Grain coarsening then occurs by atomic exchange across particle interfaces, grain boundaries and through vapour phase transport, causing grain boundary migration, pore rounding and shrinkage [Citation9].
Grain boundaries in sintered steel, therefore, have two origins. They arise either from the grains inside a particle or as a consequence of the prior particle boundaries. These two types of grain boundaries may differ since during, for example, admixing of an element to the powder mix, the alloying elements will adhere to the particle surface resulting in a local enrichment of the admixed alloying elements at the surface and consequently at the grain boundary. Increasing the sintering temperature and or sintering time will result in a more coarse grain structure and increase the possibility of the admixed alloying elements diffusing in the material.
Machine components of PM steels, such as gears, are almost always hardened in some way. The most common is case hardening, which provides the surface with a hard, wear-resistant martensitic layer while keeping the ductility and toughness of the interior. The case hardening procedure involves surface heating, resulting in phase transformations from ferrite and pearlite to austenite. As the material is then rapidly cooled, the austenite is transformed into martensite. The relevant structure to relate to after case hardening is thus prior austenite grains rather than prior particle grains. For sintered steel, the pores, if they are large enough, will pin down grain boundaries and retard austenitic grain growth. Therefore the initial particle size practically restricts the maximum size of the austenite grains [Citation10,Citation11], meaning that the size of a prior austenite grain depends on the size of the prior particle grain size.
1.2. Crack initiation and propagation in PM steel
Cracks are initiated from the pores, which act as stress raisers in the material, meaning that the stress at the pore edges is higher than the nominal stress. According to Murakami [Citation12], morphology has no significant impact on crack initiation, instead, the size of the largest inclusion is considered the detrimental factor for fatigue life. Andersson et al. found this statement to be valid for sintered steel where pores constitute the largest inclusions [Citation13]. In a sintered material, where the pores are numerous and very different from an isolated crack, the pores might interact to increase the local stress even more. This means that the effect of pore distribution can be discussed in terms of stress intensity factors for cracks, where the effect of two adjacent cracks on the stress intensity is small unless they are found in close proximity [Citation12].
The mechanical properties of steel correspond to the grain size, where smaller grains improve mechanical properties [Citation14]. A clear relationship between crack propagation rate and grain size is not established, but smaller grains tend to increase the resistance to crack propagation. The effect of prior austenite grain size on the fatigue life, studied by Simm et al. [Citation15], shows a considerable increase in fatigue life as the prior austenite grain size was reduced. As described above, the grain size can be traced back to the initial powder size distribution, so it is reasonable to expect that cracks in sintered materials tend to follow these boundaries as they grow.
A few previous studies have dealt with crack paths in sintered steels. Deng et al. showed how, in bending fatigue, the route of propagation differs between different densities of the sintered material and also between different microstructures. They found that in a homogenous pearlite structure, cementite particles hindered the growth, causing deflection of the crack. For a microstructure consisting of coarse pearlite, fine pearlite, bainite, or Ni-rich austenite, the crack would preferably propagate through austenitic Ni-rich areas [Citation16]. Kabatova et al., also using bending fatigue, reported that cracks preferably propagated along prior grain boundaries [Citation17].
1.3. Purpose of this study
The purpose of this study is to investigate how cracks are initiated and grow in PM steel. The cracks are studied with EBSD in an SEM (electron backscatter diffraction in a scanning electron microscope), which makes it possible to correlate the position of cracks to the microstructure. Previous EBSD studies of crack propagation have shown that valuable information regarding crack propagation can be found using the technique [Citation18–20]. No EBSD studies of crack propagation in martensitic PM steel are known to the authors.
A crossed cylinder cyclic sliding set-up was applied [Citation21]. In this set-up, the load is varied during each stroke so that a large load range can be tested in the same test, which makes it possible to efficiently find the critical load for crack initiation. Once this critical load was determined, additional tests were performed in a narrow load range below the critical load. Careful sample preparation of cross-sections allowed any cracks to be studied in terms of low cycle contact fatigue causing crack initiation and propagation.
Earlier work by present authors on high cycle rolling contact fatigue has shown that the combination of higher sintering temperature and finer initial powder fraction than used as standard results in a substantially longer fatigue life than for materials manufactured either at a higher sintering temperature or with smaller powder [Citation22]. A higher sintering temperature results in more circular and to some degree smaller pores. A smaller initial powder size results in substantially smaller pores. The combination of high temperature and small initial powder is believed to result in a material well suited for handling cyclic loads. Thus, for the present study, we have selected this special PM steel and standard PM steel.
2. Experimental
2.1. Materials
Sintered steel blanks, ∅︀ = 100 mm and height = 22 mm, were provided by Höganäs AB. The steel was produced from a powder pre-alloyed with Cr, with an addition of 2.0% Ni and 0.25–0.3% C admixed, see . The particle size distribution for the admixed Ni is in the range of 3–7 µm and C is added as graphite. The powder particle size was the standard fraction, <250 µm, or a finer fraction, <75 µm. The finer fraction was achieved by sieving the standard fraction. The blanks were compacted from the two powders to a density of 7.15 g cm−3. The standard fraction was sintered at 1120°C and the finer fraction at 1250°C for 45 min, both in a 90/10 N2/H2 atmosphere. PM steel with the same composition, densified by hot isostatic pressing (HIP), resulting in a fully dense material, was used as counter material. All manufacturing parameters are presented in .
Table 1. Composition of the tested PM steel materials.
Table 2. Manufacturing parameters of the tested PM steel materials.
Cylindrical samples, ∅︀ = 9.8 mm and length = 90 mm, were cut out from the blanks. All samples were case hardened in an atmosphere of acetylene diluted in nitrogen using a low-pressure carburising procedure where the carbonisation is achieved through a boost diffuse schedule. The resulting case hardening depth is about 1 mm. As the last step in surface finishing, all cylinders were centreless ground, removing about 20 µm of material, and the resulting surface has a Ra value of about 0.25 µm.
Cross-sections from cylindrical samples were ground and polished to reveal the pore and microstructure. The appearance of the two porous materials is similar. The microstructure is heterogeneous, consisting of regions of solid steel mixed with pores.
According to Beiss [Citation3], the elastic properties are functions of density for PM steel. The modulus of elasticity E and the Poisson’s ratio can be estimated as:
(1)
(1)
(2)
(2) where
,
and
0 are Young’s modulus, Poisson’s ratio, and density of the fully dense steel, respectively. The density
after sintering is acquired from image analysis. The calculated values of Young’s modulus are presented in . Since sintered steel has a lower density than fully dense steel, it will deform more elastically and thus give rise to a nominally lower contact pressure than the fully dense steel when the same load is applied in e.g. a crossed cylinder set-up.
Table 3. Calculated values of Young’s modulus and Poisson’s ratio. = 213 GPa,
= 0.3 and
= 7.85 g cm−3.
2.2. Load scanner set-up and test procedure
In this work, a tribological load scanner test set-up was used. Two perpendicularly crossed cylinders, oriented 45° to the sliding direction, slid against each other at a speed of 10 mm s−1 in a reciprocating motion. A schematic view of the set-up is shown in . During the stroke, the load is gradually increased from a set starting load at one endpoint to a set final load at the other endpoint. The motion is then reversed and the load decreases until the starting load is reached once again, which completes one cycle of sliding. The contact geometry, sliding and loading together expose the two cylinders to a unique contact load at every specific position along the cylinders. The contact was fully lubricated before each test with polyalphaolefin8 (PAO8) and additional lubricant was supplied to the contact every 2000 strokes to ensure low friction throughout the test. The normal and frictional forces are logged during the whole test. All cylinders were tested against the counter material and every test was repeated three times.
Figure 1. Schematic view of the load scanner set-up and load-interval during 1 stroke of the cylinders for the first step.
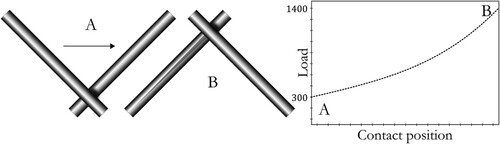
As the first step of the test procedure, the critical load for crack initiation was identified. A preliminary test showed that no cracks were present below 500 N. A single cycle test was done using a load interval from 300 N to 1400 N to ensure that the critical load would be included in the load range. The critical load was then identified by examining cross-sections, as described below in Section 2.5.
When the critical load was identified, both materials were tested for 4000 strokes in a narrow load-interval below the critical load. The new interval started 400 N below and ended 200 N below the critical load.
2.4. Contact analysis
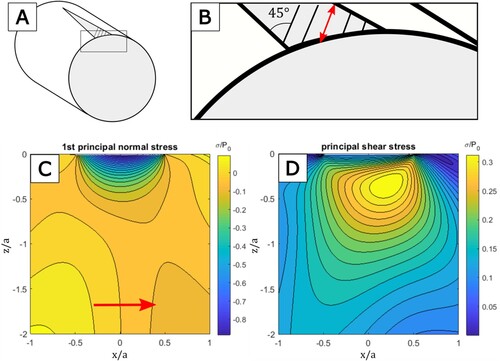
A schematic view of the contact is presented in . Due to the geometry of the test set-up, the sliding occurs at a 45-degree angle relative to both the short and the long sides of the cylinder. The cross-sections are thus obtained at a 45-degree angle from the direction of sliding, as indicated by the red arrow in (B). A given point in the contact track will experience a cyclic variation in stress including both normal and shear stresses. The analytical Hertzian [Citation23] normal stress distribution and shear underneath a spherical contact with radius a and contact pressure P0 for contact with friction (µ = 0.1) are shown in 3C and 3D. For a friction-free contact (not shown), the highest normal stress is approximately equal to P0 at the contact interface, while the highest shear stress is approximately equal to 0.3 P0 and located at a depth of about 0.8a below the contact. When low friction (µ = 0.1) is added, small shifts of magnitude and position are obtained for the highest stresses. The highest normal stress decreases to about 0.9 P0. The highest shear stress increases to about 0.33P0 and the position is shifted towards the surface and to the front of the contact at a depth of 0.7a.
Figure 2. Schematic view of a cross-section of a tested cylinder and Hertzian pressure distribution. The position of the cross-section (A) and illustration of the actual sliding inclined 45 degrees to the length of the specimen along the red arrow (B). The principal normal stress (C) and the principal shear stress (D), simplified to a spherical contact sliding along the red arrow in (B) with low friction (µ = 0.1). The arrow in (C) indicates the direction of sliding.
2.5. Analysis
Scanning electron microscopy (SEM) and electron backscatter diffraction (EBSD) was used to reveal the microstructure of the two materials after sintering and after hardening. Grain size measurements from EBSD were done on a total area of 0.9 mm2 for each material and the distinction between two grains was set to a grain boundary angle > 10 degrees. Low-angle grain boundaries were not considered in this analysis. After testing, light microscopy and optical profilometry were used to characterise the surfaces of the specimens.
To find the critical load for crack initiation, cross-sections were acquired by cutting the cylinders into as many discs as possible, resulting in 28 discs along the 70 mm wear track and thus one cross-section about every 40 N. To study the crack initiation and propagation from the 4000 cycle tests one cross-section from each test were cut out at the middle of the new load interval. The discs were mounted in resin, ground, and polished using the procedure for martensitic steel explained in detail here [Citation24] to reveal pores, microstructure, and any cracks present in the cross-section. SEM was employed in the search for cracks, focusing on the region close to the contact track of the cross-sections. SEM combined with EBSD was used to analyse crack paths in relation to the microstructure of the material.
3. Results
3.1. Microstructure
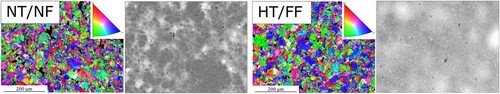
Typical microstructures of NT/NF and HT/FF materials after sintering are shown in . The inverse pole figures provide information on crystallographic orientation in the indexed phases, which were chosen to be FCC, BCC, and Fe3C. This enables visualisation of prior particle boundaries and also grain boundaries inside the particles. The EDS maps of the same areas show the Ni distribution as white. Grain size measurements from the EBSD images show that the NT/NF material (sintered at conventional temperature with normal fraction powder) has smaller grains than the HT/FF material (sintered at higher temperature with a finer fraction powder), although the difference is small between the two tested materials. The Ni-content was found to be about 2% for both of the tested materials.
Figure 3. EBSD and EDS of the same area of NT/NF (left) and HT/FF (right) cross-section after sintering, showing inverse pole figure and EDS mapping, showing the Ni distribution as brighter areas, of the same area. EBSD indexing is based on FCC, BCC, and Fe3C.
shows a closer view of the microstructures in and and show the corresponding microstructures after case hardening. The band contrast images are produced as a result of pattern quality, reflecting how successful the indexing and determination of phases were. Dark areas have poor pattern quality and bright areas have good pattern quality. Poor pattern quality is typically found at grain boundaries, phase interfaces, surface defects, and pores, and for sintered steel also at particle boundaries.
Figure 4. EBSD of NT/NF (left) and HT/FF (right) cross-section after sintering showing band contrast image with FCC phase marked by red colour and inverse pole figure. EBSD indexing is based on FCC, BCC, and Fe3C.
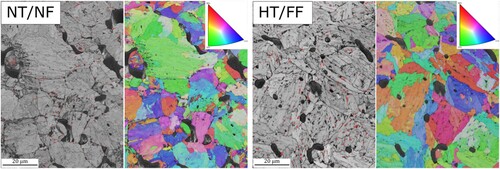
Figure 5. EBSD of an NT/NF cross-section after case hardening. (a) Band contrast image, (b) band contrast image with prior austenite grain boundaries, pores, and intergranular pores enhanced and (c) inverse pole figure. Indexing is based on FCC, BCC, and Fe3C.
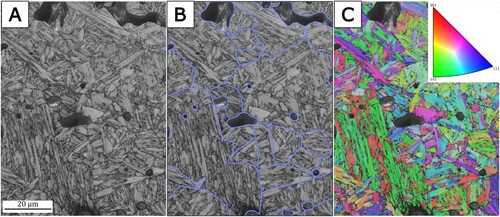
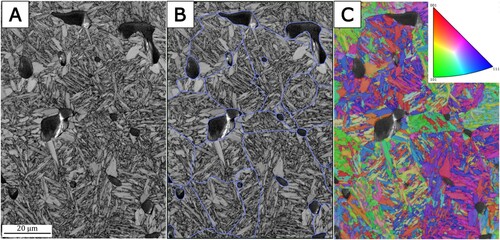
Figure 6. EBSD of an HT/FF cross-section after case hardening. (a) Band contrast image, (b) band contrast image with prior austenite grain boundaries, pores, and intergranular pores enhanced and (c) inverse pole figure. Indexing is based on FCC, BCC, and Fe3C.
After sintering, the chemical analysis shows that for the materials sintered at a lower temperature, the Ni-content is concentrated at grain boundaries, while for the material sintered at a higher temperature, the Ni-content is homogeneously distributed in the material, probably due to the higher sintering temperature which increases the diffusion rate and the smaller initial particle size, allowing more free surface area for Ni to adhere to during the admixing and lesser distance for the Ni to travel.
Phase analysis shows that the microstructure of both materials consists of ferrite and cementite, possibly forming pearlite. Isolated islands, indexed as FCC, probably consisting of Ni-rich austenite are also seen, marked as red in . The austenite islands are located at grain boundaries for the NT/NF material and are more round in form and evenly distributed in the HT/FF material.
Prior austenite grain boundaries are visible in the images after case hardening. The grain size most often corresponds to the particle size after sintering. This need not be the case and a few exceptions are visible in the images where two prior austenite grains are formed inside a prior particle. Prior austenite grain boundaries, derived by a combined analysis of the inverse pole figures and the corresponding band contrast image have been drawn on top of the latter, in and , to facilitate interpretation. The phase analysis of the EBSD analysis shows that the microstructure consists of lath martensite (indexed as BCC), retained austenite, indexed as FCC (not shown), and small fractions of cementite (not shown). Pores are visible as dark areas. The reduced hit rate and increasing darker areas in the band contrast image are a result of the martensite transformations where many small grains and thus many grain boundaries are formed inside the prior austenite particles. Dislocation formation and movement during the martensite transformation will also reduce the contrast.
3.2. Critical load for crack formation
For both materials in their hardened condition, the critical load was found to be 800 N, corresponding to a theoretical Hertzian maximum contact pressure of about 4300 MPa. At the critical load, small cracks are initiated at pores already after one stroke. At a higher load, more cracks form, some cracks grow longer, connecting pores, and the width of the cracks appears to grow. At high loads, cracks are also formed in what appears as solid material, possibly originating from a pore not visible in this particular cross-section. The width of the cracks also appears to grow with increasing load. At the critical load, the crack initiation depth is about 150 µm below the surface, which is about 20 µm deeper than the theoretical peak von Mises depth. As the load is increased, so does the span at which cracks are formed. At high loads, cracks are found at all depths from the surface down to about 180 µm below the surface.
3.3. Crack propagation
To study crack propagation, tests of 4000 strokes were performed at a new narrower load interval, 400–600 N, i.e. lower than the observed critical load of 800 N (see Section 3.2). Cross-sections were acquired at 500 N, see . Underneath the contact, indicated by rectangle 1, cracks are found between the surface and a depth of about 200 µm. The calculated highest von Mises stress is found at about 130 µm below the surface.
Figure 7. SEM image of a cross-section of NT/NF material, acquired at 500 N after 4000 strokes showing cracks propagation at different angles relative to the direction of loading. The line indicates the contact width at the surface. The load was applied vertically in the image and the sliding direction was 45 degrees out of the plane as indicated by the dashed arrow.
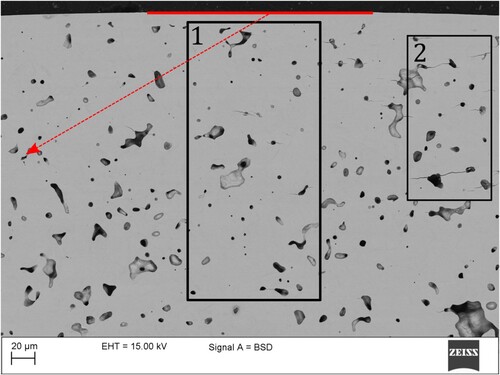
Although the load is below the critical load for crack formation after one stroke, numerous cracks are formed due to the cyclic loading in this test. Cracks are formed at all depths between the surface and the location of the highest von Mises stress. Cracks are also sometimes found at larger depths, but these findings were not frequent. The cracks are typically between 10 and 20 µm long. Underneath the contact the cracks appear to be initiated perpendicular to the direction of loading, hence following the plane of the local maximum shear stress. At the side of the contact, indicated by rectangle 2, the crack initiation and propagation are generally found at a lower angle compared to the direction of loading due to tensile forces perpendicular to the direction of sliding.
Typical examples of how cracks propagate through the microstructure are presented below in , all acquired directly below the contact mark and showing different propagation routes as the angle between the initiation plane and the prior austenite boundary increases. The cracks, which are seen to be thin in SEM images, appear wider in the EBSD images. This is because of local deformation and damage in the region close to the crack surfaces, which results in little or no crystallographic information close to the crack. Cracks that connect pores are in general wider and the loss of information is greater around these cracks.
Figure 8. Example of a crack initiated at a prior austenite boundary at a pore edge in a case hardened NT/NF sample. (a) SEM image showing the crack propagating from the pore, (b) EBSD band contrast image with pore edges and prior austenite grain boundaries enhanced and (c) EBSD inverse pole figure. The load was applied vertically in the images.
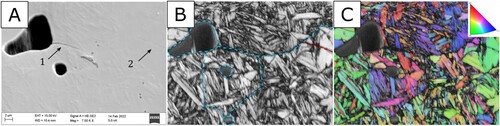
Figure 9. Example of cracks initiated at a prior austenite grain boundary (1) and inside a prior austenite grain (2) in a case hardened HT/FF sample. (a) SEM image where arrows indicate the larger crack (1) and the smaller (2), (b) band contrast image with pore edges and prior austenite grain boundaries enhanced and (c) EBSD inverse pole figure. Arrows in SEM image indicate small cracks where (1) is initiated at prior austenite grain boundary and (2) is initiated inside prior austenite grain. The load was applied vertically in the images
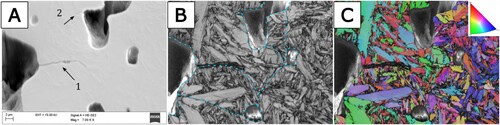
Figure 10. Example of a crack, initiated at a pore edge, following the path of a prior austenite grain boundary in a case hardened HT/FF sample. (a) SEM image showing the crack propagating from the pore, (b) EBSD band contrast image with pore edges and prior austenite grain boundaries enhanced and (c) EBSD inverse pole figure. The load was applied vertically in the images.
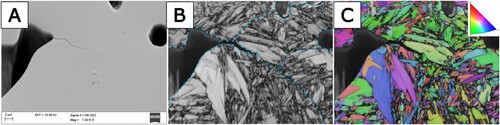
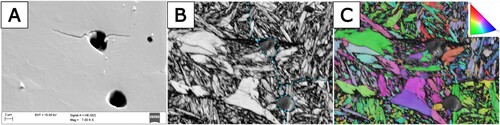
Figure 11. Example of cracks initiated at a pore edge and propagating transgranular through a prior austenite grain in a case hardened HT/FF sample. (a) SEM image showing the crack propagating from the pore, (b) EBSD band contrast image with pore edges and prior austenite grain boundaries enhanced and (c) EBSD inverse pole figure. The load was applied vertically in the images.
Cracks initiate at pores and initially propagate along the plane of the local maximum shear stress. Directly underneath the contact, this plane is parallel to the surface.
shows two cracks. Crack nr. 1 is initiated at an austenite grain boundary. The crack tends to follow the grain boundary as it slightly bends away from the direction of the local maximum stress. Crack nr. 2 is initiated outside of the imaged area, propagating transgranular and appears to stop at a prior austenite grain boundary.
shows a crack that initially follows a prior austenite boundary and deflects from the direction of the local stress maximum, following the boundary as it turns.
shows a crack initiated at a prior austenite grain boundary. After about 2 µm of propagation, it reaches a junction with two possible propagation routes, causing deflection towards the grain boundary with the lowest angle relative to the prior route of propagation.
shows a crack initiated in the direction of the local maximum stress where no prior austenite boundary is present within some angle from the crack initiation site, the crack then propagates transgranular through the prior austenite grain.
3.3. Friction and wear
During the cyclic test, both materials show an initial running-in period, lasting for about 20–30 strokes where a slight decrease in friction from 0.2 to 0.1 is noted. After about 60 strokes, the friction increases from about 0.1 to 0.13 and is thereafter stable at this level until the end of the test.
After 20 strokes, the grinding lay is still visible, but a local build-up of sheared material is seen on the surface. After 130 strokes, the lay is still visible in parts of the track and a periodic wear pattern, forming ridges in the sliding direction, is starting to appear. Sheared material has, in the sliding direction, been driven over the edges of the lay and the wear track appears to be somewhat smoother than the track after 20 strokes. The surface appearance after 4000 strokes is similar to the surface after 130 strokes but with more pronounced ridges. No surface damage in terms of cracking or delamination of material was found for any of the longer tests and no measurable difference in circumference was seen, suggesting that the wear rate was low during the test.
For both tested materials, the width of the wear track increases linearly with imposed load and the width is slightly increasing with the number of strokes. No difference in wear track width is seen between the tested materials. Hardness measurements on cross-sections acquired 50 µm below the surface inside and outside of the wear mark after 4000 strokes at 500 N revealed no difference in hardness, suggesting that the amount of strain hardening induced by the reciprocal sliding is low.
4. Discussion
4.1. Methods
This study investigates how cracks propagate through martensitic regions in sintered steel at low cycle fatigue. To achieve cracking, the contact load has been deliberately chosen to be much higher than what normally occurs in real applications, where the load is selected to avoid cracking. Accelerated wear tests can generally be motivated as long as the deformation and wear mechanisms are reproduced. In this study, the applied load is larger than in practice, and although cracks are found to initiate and propagate at a different rate, they propagate in the same manner as in materials tested for high cycle rolling contact fatigue, with and without slip [Citation22,Citation25–27].
The load scanner set-up combined with precision cutting and polishing allows for fairly precise knowledge of the critical load and is useful for generating cracks of a certain length, allowing studies of crack initiation and propagation mechanisms. This, combined with EBSD studies of the crack and the surrounding microstructure enables a good understanding of the microstructural aspects of crack propagation in sintered steels.
EBSD analysis on cracks in martensitic steel poses challenges. Although EBSD is well suited for characterising steel crystallography, it is difficult to distinguish phases with similar crystallographic parameters. The c/a-ratio indicates the difference in length between the c and a-axes of the crystal structure. Martensite has a c/a-ratio just above 1, varying with carbon content according to the following equation [Citation28].
For the studied materials, this results in a c/a-ratio of about 1.01. The ratio is close to that of the bcc cell structure which has a ratio of exactly 1. This makes it hard to distinguish between the two. In this work, the lattice parameters used to detect martensite are those of ferrite (bcc). The martensite grains vary in size but are in general small compared to those typically found in ferritic steel.
EBSD analysis reveals not only the apparent crack but also the strain field around the crack. Due to this, cracks that appear thin in the SEM image will appear wider in an EBSD image. Cracks also appear longer in the EBSD images for the same reason. As the number of martensite grains increases, so does the number of grain boundaries, where the crystallographic information is generally low. This yields images with less information than desirable when small differences in microstructure are studied. On top of this, cracks propagating in the shear mode under compressive load results in friction between the crack surfaces, which causes damage not found in, for example, pure tensile crack propagation.
4.2. Material
The materials were chosen to represent two different manufacturing routes achievable through the same sintering technique. The initial powder particle size distribution and sintering temperature will have a joint effect on the grain size of the prior particles after sintering. A smaller initial powder particle size results in grains that are smaller in diameter in general, but because higher sintering temperatures govern grain growth in which smaller grains shrink while larger grains grow, the result is not obvious just by looking at either of the two parameters.
Grain size measurements from EBSD and chemical analysis using EDS show that the NT/NF material consists of smaller grains than the HT/FF material and that the Ni, which is mixed into the Fe/Cr-powder as a separate powder, is more homogeneously distributed in the latter. Both the larger grain size and the more homogenous Ni distribution can be traced back to the sintering temperature and the initial particle size distribution, where a higher temperature increases the diffusion rate and smaller particles provide more free surface for the admixed Ni to adhere to. Smaller grains result in a higher number of grain boundaries but since the diffusion is known to be halted by particle grain boundaries and pores, the NT/NF material probably, to a higher degree, consists of multi-grain particles than the HT/FF material.
4.3. Crack initiation
Cracks always appear to be initiated at pore edges. This is most likely caused by stress concentrations at the pore edges. Shabanov discussed the issue of crack propagation due to compressive load and states that cracks can propagate in opening mode even under compressive load [Citation29]. Since cracks are most often found at the depth corresponding to the highest von Mises stress, which in its turn corresponds to where the highest shear stress is found, crack propagation probably occurs in shear mode. This assumption is supported by the observation that the cracks follow the planes of the highest principal shear stress.
4.4. Crack propagation
Cracks initially propagate along the plane containing the local maximum principal shear stress. At first, the crack is thin, but as it reaches another pore, the crack tip is heavily blunted. As this occurs, the crack does not propagate further but instead increases in width. The material around a wider crack is heavily deformed compared to the material found around thinner cracks. The thinner cracks, therefore, hold more detailed information and are more suitable for crack path analysis.
Four characteristic events that dictate crack propagation have been identified from the EBSD analysis.
A crack that is initiated at a prior austenite grain boundary will propagate along the boundary, cf. . If the prior austenite grain boundary bends away from the direction of local maximum principal shear stress, the crack can deflect along with the grain boundary and thus it appears as if the boundary hosts the path of least resistance, cf. .
A crack that propagates along a prior austenite grain boundary that is parallel to the direction of local maximum stress encounters a junction where two prior austenite grain boundaries are present within some angle, the crack will deflect towards the grain boundary with the lowest angle relative to the prior route of propagation, cf. .
A crack that propagates along a prior austenite grain boundary that is parallel to the direction of local maximum stress may be hindered in its propagation if encountering another grain boundary.
If no prior austenite grain boundary is present with a suitable angle relative to the plane parallel to the plane where the crack is initiated, the crack will propagate transgranular through the austenite grains, cf. . The martensitic structure inside the prior austenite grain can cause local deflection of the crack but the preferred route will still be perpendicular to the loading direction.
Based on the findings where cracks tend to follow the intergranular route, this route probably results in a faster propagation rate than the transgranular route. To confirm this, statistical analysis would be required. Therefore these results should be viewed as an indicator based on observations.
4.5. Friction and wear
In this study, the purpose of using a reciprocating sliding test is to create cracks in the material. The purpose is not to study friction and wear mechanisms. It is rather the case that wear and surface deformation should be avoided so as not to affect the crack formation.
The coefficient of friction is, in general, low for both tested materials and throughout the tests. This is expected since the contact is well lubricated from the beginning and additional lubricant is provided several times during the tests. The slight increase can probably be explained by the change in surface appearance after about 90 strokes. At the beginning of the tests, the grinding lay is visible and the surface can therefore hold lubricant. The lay is then gradually disappearing due to shearing, resulting in a surface that has fewer or no features that can hold the lubricant, and thus the friction increases.
For both materials, the wear track width increases continuously and smoothly as the load increases. This means that no sub-surface collapse occurs, as this would have resulted in a sudden increase in wear track width. The width of the wear track does not increase significantly after the first stroke but an increase in the amount of sheared material is seen, resulting in a local decrease in surface pressure.
The periodic wear seen along the wear track is initiated at the first stroke and becomes more obvious as the test proceeds. The origin of this is believed to be minute periodic changes in the diameter of the cylinders after the centreless grinding. A slight periodicity can be seen in the lay. The contact between the cylinders, both having this periodicity, is established on the ridges and material from the ridges shears in the sliding direction during the test.
The wear of the cylinders might affect the load distribution closest to the surface, but since cracking occurs at a relatively large depth underneath the surface, the effect of this wear on crack formation and propagation is probably negligible.
4.6. Microstructural aspects and fatigue life
The two different materials differentiate in terms of the size of the pores, pore shape, grain size, Ni-distribution, and resistance to high cycle fatigue. However, the behaviour of short cracks in terms of initiation and propagation through the microstructure are the same and thus, the difference in the overall fatigue life behaviour cannot be explained by the initial events after crack initiation.
5. Conclusions
In this study, crack formation load and crack propagation through the case hardened region of PM steels have been investigated. A load scanner sliding test combined with cross-section analysis proved to be an efficient method to:
identify the critical load for crack formation after one single stroke and
study crack formation and propagation after repeated strokes at a load below the critical load.
Cracks were identified by SEM analysis of polished cross-sections. This study shows in particular how EBSD analysis can be used to study the preferred crack paths through the microstructure. By combining different crystallographic projections both particle and grain boundaries can be identified and the paths of the cracks can be made visible.
Based on the finding, the following conclusions about the crack formation and propagation are made:
Cracks are initiated at pore edges and initially propagate in shear mode.
Cracks have a strong tendency to follow prior austenite grain boundaries.
If no particle boundary or prior austenite grain boundary is present within a certain angle at the crack initiation site, the crack tends to propagate transgranular.
As the cracks continue to grow in shear mode, the cracks smoothly deviate towards the surface.
No difference in critical load or crack propagation behaviour was found between the two tested materials.
At high loads, well above the critical load, numerous cracks about 10 µm long are formed instantly and can be observed after one stroke.
Acknowledgement
The authors would also like to acknowledge Höganäs AB for providing the steel material and especially Michael Andersson for scientific co-operation.
Disclosure statement
No potential conflict of interest was reported by the author(s).
Additional information
Funding
Notes on contributors
Anders Holmberg
Anders Holmberg is a Phd Student.
Urban Wiklund
Urban Wiklund is Professor in Material Science.
Per Isaksson
Per Isaksson is Professor in Solid Mechanics.
Åsa Kassman Rudolphi
Åsa Kassman Rudolphi is Associate Professor and Senior Lecturer.
References
- Sosa MJ, Björklund S, Sellgren U. Gear web design with focus on powder metal sound characteristics and web design. International conference on Gears: Europe Invites the World;2; 2013. p. 1199–1208.
- Flodin A. Powder metal gear technology: A review of the state of the art. Am. Gear manuf. assoc. fall tech. meet. 2015, AGMA FTM 2015, no. March; 2015. p. 67–77
- Beiss P. Mechanische Eigenschaften von Sinterstählen. Tagungsband zum Symp. für Pulvermetallurgie Mater. Hagen. 2003;27:3–24.
- Dlapka M, Danninger H, Gierl C, et al. Defining the pores in PM components. Met Powder Rep 2010;65:30–33.
- Dobrzański LA, Brytan Z, Grande MA, et al. Influence of sintering parameters on the properties of duplex stainless steel. J Achievements in Mater Manuf Eng. 2007;20(2):231–234.
- Sevostianov I, Kushch V. Effect of pore distribution on the statistics of peak stress and overall properties of porous material. Int J Solids Struct 2009;46(25–26):4419–4429.
- Wendel J, Manchili SK, Hryha E, et al. Sintering behaviour of compacted water-atomised iron powder: effect of initial state and processing conditions. Powder Metall 2020;63(5):338–348.
- German RM. Microstructure coarsening. In: RM German, editor. Sintering: from empirical observations to scientific principles, pp. 227–246. Waltham, MA: Elsevier; 2014.
- Höganäs AB. Höganäs Handbook for Sintered Components Power of Powder ® Production of Sintered Components 2; 2013.
- Dlapka M, Strobl S, Danninger H, et al. Austenite grain size in sinter hardened powder metallurgy steels. Prakt Metallogr Metallogr. 2010;47(12):686–699.
- Carter CB, Norton MG. Ceramic Materials: Science and Engineering. New York, NY: Springer; 2013.
- Murakami Y. Metal fatigue: effects of small defects and nonmetallic inclusions. Oxford: Elsevier; 2002.
- Andersson M, Larsson M. Linking pore size and structure to the fatigue performance of sintered steels. Proceedings of the World powder metallurgy congress and exhibition, World PM 2010; 3; 2010. p. 1–8.
- Morris J. “The Influence of Grain Size on the Mechanical Properties of Steel,” 2001.
- Simm T, Sun L, McAdam S, et al. The influence of lath, block and prior austenite grain (PAG) size on the tensile, creep and fatigue properties of novel maraging steel. Materials. 2017;10(7):730. DOI:10.3390/ma10070730
- Deng X, Piotrowski G, Chawla N, et al. Fatigue crack growth behavior of hybrid and prealloyed sintered steels. part II. fatigue behavior. Mater Sci Eng A. 2008;491(1–2):28–38.
- Kabatova M, Dudrova E, Wronski AS. Microcrack nucleation, growth, coalescence and propagation in the fatigue failure of a powder metallurgy steel. Fatigue Fract Eng Mater Struct 2009;32(3):214–222.
- Wright SI, De Kloe R, Nowell MM. EBSD analysis of crack propagation : A case study. In. ICOTOM; 2017. p. 1–2.
- Salvati E, O’Connor S, Sui T, et al. A study of overload effect on fatigue crack propagation using EBSD, FIB–DIC and FEM methods. Eng Fract Mech 2016;167:210–223.
- Laureys A, Depover T, Petrov R, et al. Microstructural characterization of hydrogen induced cracking in TRIP-assisted steel by EBSD. Mater Charact 2016;112(January):169–179.
- Berger M, Hogmark S. Tribological properties of selected PVD coatings when slid against ductile materials. Wear. 2002;252(7–8):557–565.
- Holmberg A, Rudolphi ÅK. Rolling fatigue life of PM steel – Influence of sintering temperature and powder particle size. Euro PM 2019 congress and exhibition, 2019
- Hertz H. Über die berührung fester elastischer körper. J für die Reine und Angew Math. 1881;92:156–171.
- Guesnier A. Preparation of ferrous metals for electron backscatter diffraction application notes. Oxford Instruments NanoAnalysis. 2010: 12.
- Holmberg A, Andersson M, Rudolphi ÅK. Rolling fatigue life of PM steel with different porosity and surface finish. Wear. 2019;426–427.
- Janitzky TLM. Einfluss von Dichte und Schlupf auf die Wälzfestigkeit einsatzgehärteter Sinterstähle. In Von der Fakultät für Maschinenwesen der Rheinisch-Westfälischen Technischen Hochschule Aachen zur Erlangung des akademischen Grades eines Doktors der Ingenieurwissenschaften genehmigte Dissertation; 2014.
- Mekonone ST, Pahl W, Molinari A. Influence of the microstructure on the subsurface and surface damage during lubricated rolling – sliding wear of sintered steel : theoretical analysis and experimental investigation. Powder Metall 2018;0(0):1–10.
- Lu Y, Yu H, Sisson RD. The effect of carbon content on the c/a ratio of as-quenched martensite in Fe-C alloys. Mater Sci Eng A. 2017;700(April):592–597.
- Shabanov AP. Under compressive external stresses. J Appl Mech Tech Phys 2005;46(6):861–866.