
ABSTRACT
High sintered density is desired for heavy-duty applications and there are different ways through which the sintered density can be improved. In the current study, nanopowder is blended to the conventionally used micrometre-sized water-atomised steel powder to evaluate its impact on sintering. Both the powder variants, without and with nanopowder, were subjected to thermogravimetry analysis, and uniaxially compacted to the same green density of 7.15 g/cc or 90% relative density and sintered at 1250°C in pure hydrogen. A comparative analysis was performed with respect to the microstructural evolution between the micro and micro/nano bimodal powder compacts. JMatPro and electron backscattered diffraction was used to understand the microstructural evolution. An attempt was made to understand the improved linear shrinkage in the micro/nano bimodal powder compact using a combination of microstructure analysis and chemical analysis.
1. Introduction
There is a need for higher relative densities of press and sinter powder metallurgy (PM) parts to extend their use for heavy-duty applications. One of the approaches for achieving higher relative density is through the application of sintering aids. It has previously been reported that nanopowder could be used [Citation1]. Furthermore, nanopowder added to water-atomised iron powder has been found to accelerate the sintering in press and sinter PM [Citation2].
This study is part of a larger research effort, enabling achievement of full density in press and sinter route-based PM components using water-atomised ferrous powder. The current study is intended primarily to evaluate sintering behaviour of powder mix of nanopowder added to water-atomised steel powder, when subjected to uniaxial compaction. The present study also attempts to provide insights into the effect on microstructure because of nanopowder addition. The scope is that such knowledge would allow for appropriate tailoring of the alloy composition and the overall manufacturing process to obtain the desired microstructure and properties for potential applications.
2. Materials and methods
2.1. Materials
Water atomised steel powder, pre-alloyed with 1.8 wt.% chromium, having 2 wt.% nickel and 0.3 wt.% UF-4 natural graphite admixed supplied by Höganäs AB with a particle size distribution of 20–180 μm, was used as the base powder (CrA + Ni + C). Prior to compaction, 0.6 wt.% lubricant (Lube-E) was added to the powder to improve the compressibility of the powder during compaction. Commercial pure iron nanopowder with size of below 100 nm was procured from Sigma Aldrich. This nanopowder was mixed with the CrA + Ni + C as a sintering aid at a ratio of 95:5 with CrA + Ni + C forming the majority fraction (CrA + Ni + C + Fe NP).
2.2. Methods
2.2.1. Thermogravimetry
Thermogravimetric (TG) measurements were carried out using a simultaneous thermal analyser STA 449 F1 Jupiter (Netzsch). Powder weighing 2 g was loaded into an alumina crucible and heated to 1350°C at a heating rate of 10°C/min followed by cooling at 30°C/min with a holding time of 60 min. Pure hydrogen atmosphere (99.9999% purity) was used at a flow rate of 100 ml/min for all the experiments. CrA + Ni + C and CrA + Ni + C + Fe NP delubricated compacts were also analysed under similar conditions as that of the powder.
2.2.2. Chemical analysis
The bulk carbon and oxygen levels of both powder and sintered compacts were determined using LECO TC-600 and LECO CS-844 instruments.
2.2.3. Compaction and sintering
Both CrA + Ni + C and CrA + Ni + C + Fe NP powder were compacted in the shape of impact energy (Charpy) bars with the dimensions 10×10×55 mm3 using a uniaxial compaction to a green density of 7.15 g/cm3. The compaction pressure needed to achieve 7.15 g/cm3 green density was 600 MPa in the case of CrA + Ni + C, whereas it increased to 1100 MPa with the addition of iron nanopowder to achieve the same green density.
Delubrication was carried out at 450°C in nitrogen atmosphere prior to sintering [Citation3]. The compacts were sintered at 1250°C using a DIL 402C dilatometer (Netzsch) (DIL). Sintering was carried out at a heating rate of 10°C/min, held at peak sintering temperature for 60 min and cooled to room temperature at 30°C/min in pure hydrogen atmosphere (99.9999% purity) at a flow rate of 100 ml/min.
2.2.4. Density
Green density of the compacts was evaluated using a micrometre and a balance (0.0001 g). Density of the sintered compacts was measured using Archimedes principle.
2.2.5. Microstructural characterisation
Optical microscopy was performed using a Zeiss Axioscope 7 optical microscope to evaluate the microstructure and Trainable Weka Segmentation tool was used for the analysis of ferrite in sintered samples [Citation4,Citation5]. Electron backscattered diffraction (EBSD) along with energy dispersive spectroscopy (EDS) was carried out on sintered compacts using a scanning electron microscope LEO Gemini 1550 (CARL ZEISS-LEO with a field emission gun) (FEG SEM). Phase fraction calculations were done using JMatPro software (version 10.2) using general steel database.
3. Results and discussion
3.1. Thermogravimetry
shows both powder variants and their respective delubricated compacts when subjected for thermogravimetric (TG) analysis to understand the difference in their reduction behaviour. A mass loss of 0.28% was observed for CrA + Ni + C powder, while it increased to 0.65% with the addition of iron nanopowder. In the case of compacts, mass losses of 0.34 and 0.82% were recorded for CrA + Ni + C and CrA + Ni + C + Fe NP compacts, respectively.
Figure 1. Thermogravimetric curves for (a) CrA + Ni + C and (b) CrA + Ni + C + Fe NP.
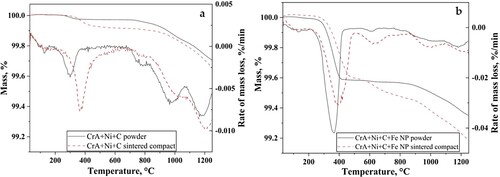
The TG curve could be divided into two different regions. For the powder, the first region in the temperature range below about 400°C, represents the reduction of surface oxide film, which is mainly formed by iron oxide, present on both micro and nanopowder [Citation6,Citation7]. This region extends to around 550°C for the compacts. A flat line is observed between 400 and 800°C in (a) for both the powder and compact of CrA + Ni + C. A similar flat line is observed for the CrA + Ni + C + Fe NP powder in (b), whereas for the compact, a continuous mass change was observed in this region.
The second region, 800°C and above, carbothermal reduction reactions are active with carbon being more effective for reduction. With further increase in temperature, reduction of more stable particulate oxides on the surface as well as internal oxides present occurs in the micrometre-sized powder. The total mass loss is the sum of the reduction of iron-rich surface oxide and that of the more stable particulate oxides, which includes consumption of carbon in the reduction reactions besides the initial action of hydrogen.
The mass loss rate curves show that the peak mass loss in the first region occurs at 309 and 363°C for CrA + Ni + C and CrA + Ni + C + Fe NP powder, respectively. The difference in temperature is attributed to the change in chemical composition caused by the nanopowder addition. In a previous work [Citation7], it was shown that the oxide scale on the nanopowder reduces before 600°C. Similarly, it was also shown that the Fe-rich oxide film covering most of surface of the water-atomised steel powder reduces at low temperatures in the presence of hydrogen [Citation6].
With regard to the TG analysis of the compacts, significant differences could be noticed when compared to powder. The mass loss rate curves show that the peak mass loss in the first region is pushed to higher temperatures. For CrA + Ni + C compact, the peak temperature was observed at 366°C whereas with the addition of nanopowder, this temperature increased to 396°C. The details of mass loss and peak temperatures for mass loss rate are given in . For the compacts, surface oxide reduction shifted to higher temperature. This can be attributed to the fact that the access to powder surface is also minimised due to the compaction operation, although open porosity exists at the green density levels achieved.
Table 1. Details of TG.
3.2. Chemical analysis
Carbon and oxygen contents measured for both CrA + Ni + C and CrA + Ni + C + Fe NP powder variants and their respective sintered compacts given in .
Table 2. Carbon and oxygen analysis.
The carbon content in CrA + Ni + C and CrA + Ni + C + Fe NP powder samples prior to processing was measured to be 0.27%. There was no significant contribution of iron nanopowder addition towards the carbon content. On sintering, carbon content was observed to be 0.2 and 0.13% for CrA + Ni + C and CrA + Ni + C + Fe NP, respectively.
Oxygen content was 0.15% and 0.36% for CrA + Ni + C and CrA + Ni + C + Fe NP powder, respectively. An increase in oxygen content with the addition of nanopowder corresponds to the oxygen present in the surface oxide layer of the nanopowder. On sintering, the oxygen content reduced in both the powder variants to less than 0.01%. The excess oxygen in CrA + Ni + C + Fe NP powder in comparison to CrA + Ni + C powder, is removed with carbon as a reducing agent. Therefore, the reduced carbon content after sintering in nanopowder-containing samples.
As the surface oxide of nanopowder was not efficiently reduced at low temperatures, carbon reduces the surface oxide at high temperatures. The carbon content was same in both the powder variants but an increase in oxygen content was observed with the addition of nanopowder. On sintering, the carbon content was low in CrA + Ni + C + Fe NP compact in comparison to CrA + Ni + C compact, whereas the oxygen content was similar after sintering. Therefore, the carbon was consumed for the reduction of oxygen present in the surface oxide of nanopowder which was left by the inefficient reduction.
3.3. Sintering
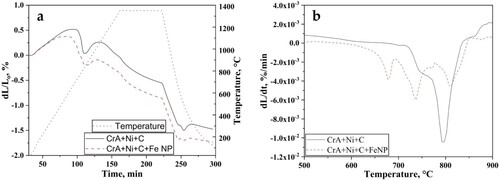
Compacted green bodies were delubricated before sintering to remove the lubricant used for aiding compaction [Citation3]. Sintering of the delubricated green compacts was performed in DIL. Relative linear shrinkage of 1.4 and 1.7% was observed for CrA + Ni + C and CrA + Ni + C + Fe NP compacts, respectively ((a)). Hence, the increase in the amount of relative linear shrinkage was observed with the addition of nanopowder. (b) shows the shrinkage rate curves during the heating cycle of sintering. A single peak was observed for CrA + Ni + C sintered compact at 794°C, which represents the transformation of BCC ferrite to FCC austenite. A multi-peak behaviour was observed in the case of CrA + Ni + C + Fe NP sintered compact with peaks at 681, 736 and 810°C. The peak at 810°C represents the ferrite to austenite transformation temperature. The addition of nanopowder alters the overall composition which increases the transformation temperature. The other two peaks at 681 and 736°C could be attributed to the sintering associated to nanopowder. Such multi-peak behaviour was witnessed in compacts where nanopowder agglomerate sintering was observed [Citation8].
Figure 2. Sintering curves of (a) CrA + Ni + C and CrA + Ni + C + Fe NP and (b) shrinkage rate curves during the heating cycle.
3.4. Density
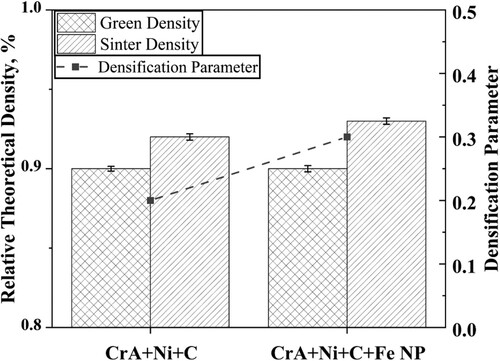
shows the green and sintered densities in relative theoretical density terms along with densification parameter. The densification parameter is defined as the density difference during sintering divided by the change needed to attain a pore-free solid. The higher compaction pressure needed for CrA + Ni + C + Fe NP could be attributed to the low compressibility caused by nanopowder addition [Citation2]. Sintered density of 93% was obtained for CrA + Ni + C + Fe NP, while it was 92% for the compacts without nanopowder.
Figure 3. Plot showing green and sintered density.
Unlike in this study, higher shrinkage and density values were obtained in the previous studies on the micro/nano bimodal powder sintered compacts [Citation2,Citation9]. The lack of improved shrinkage or density on par with the previous studies can be attributed to the higher compaction pressures employed for the bimodal powder in the present study which can have two consequences. The higher compaction pressures could contribute to partial cold welding of the powder which can result in a decrease in the ‘size effect’ for the nanopowder. The nanopowder might behave as micrometre-sized powder and the very advantage of addition of nanopowder, which accelerates the sintering at temperatures as low as 600°C is minimised or lost [Citation2]. Early stages of sintering, seen in samples with added nanopowder, is supposedly not efficient when high compaction pressures are employed. It is seen from thermogravimetry that the inefficient reduction of surface oxide which acts as barrier for sintering in the nanopowder at lower temperatures is decreasing its effectiveness in densification.
This shows that the access of reducing gas to the surface of the powder, and especially removal of the reduction products from the compact, is hindered, which pushes the reducing temperature to higher temperatures [Citation10]. As the green density is same in both cases, ‘permeability’ of the gases is expected to be the same. But the presence of nanopowder changes the path for the reducing gas to reach the powder surface, which could be different from the compact without the nanopowder. A continuous mass change in the case of CrA + Ni + C + Fe NP compact, seen in (b), shows that the oxide reduction is continuous.
3.5. Microstructural characterisation
shows the optical microstructure of both CrA + Ni + C and CrA + Ni + C + Fe NP sintered compacts. Porosity in the sintered compacts of CrA + Ni + C and CrA + Ni + C + Fe NP is shown in (a,d), respectively. Heterogeneous microstructure was observed in both cases, where a combination of different phases was seen. Different phases were identified to be ferrite, pearlite, bainite and some amount of martensite and are indicated in (b,d). The difference in microstructures can be explained through chemical analysis within which three factors are to be considered in this regard: nanopowder addition, carbon concentration and nickel distribution.
Figure 4. Optical micrographs of (a–c) CrA + Ni + C and (d–f) CrA + Ni + C + Fe NP sintered compact. Phases identified as P, B, M and F are pearlite, bainite, martensite and ferrite.
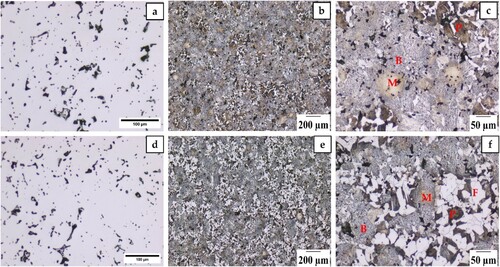
The ferrite content, measured using Trainable Weka Segmentation tool, was found to be 10 and 30% in CrA + Ni + C and CrA + Ni + C + Fe NP, respectively. While it is true that the addition of nanopowder decreases the effective alloy concentration, a 20% increase in the ferrite content is higher than that can be expected just based on dilution of alloying elements. An important aspect to be considered here is the resulting carbon content in the compacts after sintering. Carbon, apart from being an alloying element, acts as a reducing agent. The decrease in carbon content in CrA + Ni + C + Fe NP describes the higher amount of ferrite. It should be noted that the admixed nickel is redistributed through solid-state mass transport mechanisms involving surface diffusion over the steel particle surfaces, diffusion along the austenite grain boundaries and finally interdiffusion between iron and nickel with preferential diffusion of iron into the nickel-containing regions [Citation11].
To comprehend the impact of the compositional changes on the microstructure, JMatPro calculations were performed for both the variants with the assumption of not having and having homogenously distributed nickel in the material. The results are shown in with an assumed austenite grain size of 140 μm has been used in all cases. The chemical compositions used for the calculations were taken from chemical analysis values of the compacts after sintering. For CrA + Ni + C + Fe NP compact, assuming that nickel is homogeneously distributed in the matrix ((a)) suggests a microstructure with of 85% bainite and rest being pearlite and ferrite. This changes to a tentative microstructure with decrease in bainite and increase in pearlite content without any ferrite in CrA + Ni + C compact ((b)). Apparently, this is not the case as a clear segregation of nickel was observed (). Therefore, a calculation was done removing nickel from the composition with the same carbon content as presented in (c,d). The prediction then shows the presence of ferrite and pearlite with an increased ferrite content in the compact containing the nanopowder. The microstructural observation in the present study clearly shows heterogeneous microstructure with segregation of nickel and hence inapplicability of thermodynamic calculations for homogeneous material. However, approximation using nickel content somewhere between the two calculations can be used to get good approximation of the general microstructure. An equivalent or effective nickel content defined as the nickel content which when uniformly present in the matrix, would result in the observed microstructures could be conceptualised. For the obtained ferrite content, JMatPro was iterated for nickel content and the effective nickel content for both the variants was obtained to be 1.0% for CrA + Ni + C and 1.2% for CrA + Ni + C + Fe NP. The higher effective nickel content in CrA + Ni + C + Fe NP compact shows that nanopowder provides more grain boundary area for the diffusion of nickel and better distribution of nickel in such compact. A synergistic effect of the differences in nickel distribution and carbon content can hence be expected.
Figure 5. JMatPro calculations for the amount of phases with nickel in (a) CrA + Ni + C + Fe NP, (b) CrA + Ni + C and without nickel in (c) CrA + Ni + C + Fe NP and (d) CrA + Ni + C.
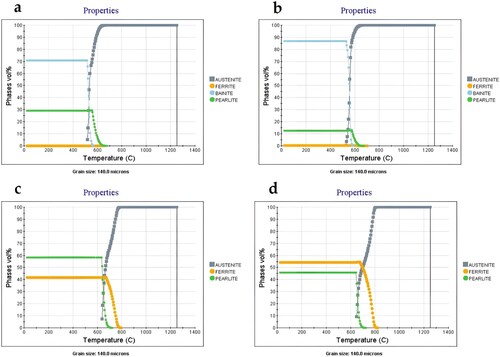
Figure 6. Band contrast along with KAM maps and EDS analysis of nickel for (a–c) CrA + Ni + C, (d–f) CrA + Ni + C + Fe NP sintered compacts and (g) misorientation frequency plots.
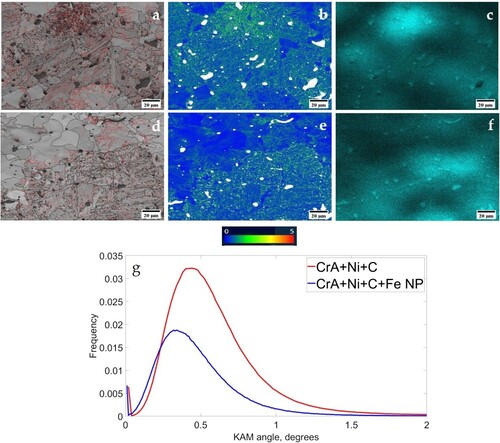
Since it is inferred that the nickel distribution is modified due to nanopowder addition, the nickel rich areas in the compacts are further analysed to understand their possible effects on the microstructure (). It can be seen from Kernal angle misorientation (KAM) map for the sintered CrA + Ni + C and CrA + Ni + C + Fe NP compacts, that the misorientation was higher in the nickel rich regions in comparison to nickel lean areas ((a–f)). The reduced amount of misorientation in the case of compact with nanopowder could consequently be attributed to more homogenous distribution of nickel and reduced carbon content ((g)).
Nickel affects the hardenability of the alloy and an increase in concentration results in the formation of bainitic structure upon normal cooling from the sintering temperature [Citation12]. It should be noted that the final microstructure is the result of mixing of powder, alloying methods and interdiffusion of alloying elements during sintering. An interplay between the reduced carbon content in compact containing nanopowder along with increased grain boundary network for improved nickel diffusion is hence suggested to have resulted in the increased effective nickel content.
4. Conclusions
Thermogravimetry revealed increased mass loss due to addition of nanopowder which is attributed to the higher oxygen content connected to surface oxide layer present on the nanopowder. The compaction pressure required to achieve same green density for the powder with nanopowder addition was higher than that for the powder without nanopowder. On sintering, the amount of relative linear shrinkage in the nanopowder compact was 0.13 in comparison to 0.11 in the compact without nanopowder. The microstructure evaluation of sintered compacts revealed a heterogenous structure. An increase in ferrite content was observed in the compact with nanopowder, which was attributed to the decreased carbon content. This decrease in carbon content was explained through the reduction of excess oxygen present in the form of surface oxides of iron nanopowder. From this study, it could be inferred that scaling up the micro/nano bimodal powder components manufacture requires specific concern regarding compaction pressure employed and carbon control to account for the higher carbon loss during reduction of surface oxide
Acknowledgements
This work has been carried out within the project ‘Nanotechnology enhanced sintered steel processing’ through support from Swedish Foundation for Strategic Research, SSF within the programme ‘Generic Methods and Tools for Future Production’.
Disclosure statement
No potential conflict of interest was reported by the author(s).
Additional information
Funding
References
- Oh JW, Ryu SK, Lee WS, et al. Analysis of compaction and sintering behavior of 316L stainless steel nano/micro bimodal powder. Powder Technol. 2017;322:1–8.
- Manchili SK, Wendel J, Zehri A, et al. Effect of nanopowder addition on the sintering of water-atomized iron powder. Metall Mater Trans A. 2020;51:4890–4901. DOI:10.1007/s11661-020-05891-1.
- Karamchedu S. Lic Thesis. Chalmers University of Technology, Sweden; 2013.
- Schindelin J, Arganda-Carreras I, Frise E, et al. Fiji: an open-source platform for biological-image analysis. Nat Methods. 2012;9:676–682.
- Arganda-Carreras I, Kaynig V, Rueden C, et al. Trainable weka segmentation: a machine learning tool for microscopy pixel classification. Bioinformatics. 2017;33:2424–2426.
- Wendel J, Manchili SK, Cao Y, et al. Evolution of surface chemistry during sintering of water-atomized iron and low-alloyed steel powder. Surf Interface Anal. 2020;52:1061–1065.
- Manchili SK, Shvab R, Zehri A, et al. Surface analysis of iron and steel nanopowder. Surf Interface Anal 2018;50:1083–1088.
- Manchili SK, Wendel J, Hryha E, et al. Sintering of bimodal micrometre/nanometre iron powder compacts - A master sintering curve approach. Powder Technol 2021;391:557–568.
- Choi JP, Lee GY, Il Song J, et al. Sintering behavior of 316L stainless steel micro–nanopowder compact fabricated by powder injection molding. Powder Technol 2015;279:196–202.
- Hryha E, Dudrova E, Nyborg L. On-line control of processing atmospheres for proper sintering of oxidation-sensitive PM steels. J Mater Process Technol 2012;212:977–987.
- Vintila R, Aguirre-Perles L, Paserin V, et al. Nanometric surface modification of iron and steel powders. World PM 2016 congress, Germany. 2016;1–7
- Sarasola M, Gomez-Acebo T, Castro F. Sinterability, alloy homogenisation and microstructural development of Ni-Cr-Mn P/M steels. Proc Euro Cong Powder Metall. 2001;2: p. 266–271 .