
Abstract
Mental and sketch maps have a long tradition in modern geography. Little theoretical and methodological distinction has been made, however, between different hand mapping approaches. Mental maps emerged from behavioral geography of the spatial science tradition as a technique to understand human behaviors based on peoples’ perceptions of their spatial environment. More recently, sketch maps have been used in participatory and qualitative geographic information systems (QGIS) to develop cartographies of group and individual spatial narratives. They are a tool that helps achieve QGIS's objectives of collecting unique spatial data of individual experiences, visualizing socio-spatial processes, breaking down particular barriers of positionality in research, and developing new uses of GIS. Two case studies illustrate the use of sketch maps in research, including a project examining job accessibility among working poor individuals and a study of the experiences of fear and safety in public spaces among lesbian, gay, bisexual, and transgender community members. Sketch maps in QGIS have many methodological merits. They add an invaluable dimension to the qualitative interview process, offer countermapping perspectives, generate detailed spatial information of individuals, and facilitate data interpretation.
心理地图与示意图在现代地理学中具有悠久的传统。但在不同的手绘地图方法中, 却鲜少有理论及方法论的区隔。心理地图源自于空间科学传统中的行为地理学, 是根据人们对空间环境的感知, 理解人类行为的方法。近年来, 参与式研究与质化地理信息系统 (QGIS) 则运用示意图来建立社群及个人的空间叙事製图。它们是协助 QGIS 达成搜集个人经验的特殊空间资料、视觉化社会—空间过程、打破研究中有关立场的特殊障碍, 以及发展GIS的崭新运用等目标之工具。以下两个案例研究说明示意图在研究上的运用, 包含研究贫穷工人的就业可及性之计画, 以及男女同性恋者、双性恋者和跨性别社群成员在公共空间中的恐惧与安全经验。 QGIS 中的示意图具有诸多方法论上的优点, 它们为质性访谈过程补充了可贵的面向、提供反抗性製图的视角、生产详尽的个人空间资讯, 并帮助资料的诠释。
Los mapas mentales y los de esbozo, o boceto cartográfico, tienen una larga tradición en la geografía moderna. No obstante, es muy poca la distinción teórica y metodológica que se ha hecho entre los diferentes enfoques del mapeo manual. Los mapas mentales surgieron en la geografía conductual de la tradición espacial científica como una técnica para entender las conductas humanas a partir de las percepciones que la gente tiene de su entorno espacial. Más recientemente, los bocetos cartográficos se han usado en sistemas de información geográfica cualitativa (SIGC) de tipo participativo, para desarrollar cartografías de narrativas espaciales grupales e individuales. Estas cartografías son una herramienta de apoyo a los objetivos de los SIGC de recolectar datos espaciales únicos a partir de experiencias individuales, visualizando procesos socio-espaciales, echando abajo barreras particulares de posicionalidad en investigación y desarrollando nuevos usos para los SIG. El uso de las cartografías de boceto en investigación se ilustra con dos estudios de caso, que incluyen un proyecto para examinar la accesibilidad al trabajo entre trabajadores pobres, y un estudio de las experiencias de temor y seguridad en los espacios públicos entre miembros de las comunidades de lesbianas, gays, bisexuales y transexuales. Los mapas de boceto en los SIGC tienen muchos méritos metodológicos. Ellos agregan una invaluable dimensión al proceso de la entrevista cualitativa, ofrecen nuevas perspectivas opuestas a la ortodoxia cartográfica, generan información espacial detallada de los individuos y facilitan la interpretación de datos.
In the famous London Cholera Map of 1854, John Snow tested a waterborne germ theory by marking on a neighborhood map the locations of cholera illness incidents relative to various water pumps. In A New Yorker's Idea of the United States, Wallingford (Citation1937) drew a satirical art map where Manhattan and Long Island are drawn in oversized proportions, comically implying perceptions by locals of New York City's prominence and the diminishing relevance of more distant U.S. places. These two maps illustrate different approaches in using hand-drawn maps to achieve distinctive purposes: One represents cartographically precise locations of events and individuals; the other distorts cartography to represent human perceptions, beliefs, and imaginations.
Even in today's age of technologically sophisticated mapping, there has been a resurgence in the use of hand-drawn maps to collect and visualize a variety of unique information in research, and such mental and sketch mapping has a long tradition in modern geography. One problem in the research literature, however, is that the terms sketch maps, mental maps, cognitive maps, and perceptual maps are often used interchangeably (Brennan-Horley and Gibson Citation2009, 2601; cf. Tuan Citation1975). This article addresses this issue by making a theoretical distinction between mental and sketch maps and illustrating how sketch maps are currently used to meet the objectives of qualitative geo- graphic information systems (QGIS).
In recent years, with the rise of social critical theories, geospatial technologies, and broader possibilities of citizenry mapping, there is a push to “think outside the box” of possibilities for GIS, including discovering how to integrate diverse forms of geographic knowledge into GIS, how to develop new ways of creating knowledge, and how to expand access to GIS (Elwood Citation2010). Furthermore, the increased proliferation and widespread availability of mapping technologies opens opportunities for volunteered geographic information (Goodchild Citation2007) and “ground-up” citizen mapping (Crampton Citation2010). At the same time, critical geographic perspectives have sought greater focus on the individual and the local, and some have articulated the need for alternative cartographies that represent the diversity and complexity of peoples’ lived experiences (Dorling Citation1998; Kwan Citation2002). We argue that within this context, sketch mapping has (re)emerged as a research tool, particularly within the public participation GIS (PPGIS) and QGIS bodies of research. Sketch maps are cartographic representations of individual or group spatial experiences, commonly produced by placing locational markings onto geographically referenced base maps.
To date, there does not appear to be a formal articulation of epistemological and methodological differences in the use of mental maps and sketch maps in geographical research, which is the intent of this article. First we outline a key distinction. Mental maps emerged from behavioral geography of the spatial science tradition as a technique to understand human behaviors based on peoples’ perceptions of their spatial environment. More recently, sketch maps have been used in QGIS to develop cartographies of individual spatial narratives. Then, we illustrate the use of sketch maps from two QGIS case studies: a project examining job accessibility among working poor individuals and a study of the experiences of fear and safety in public spaces among lesbian, gay, bisexual, and transgender (LGBT) community members. We discuss how sketch maps help achieve QGIS's objectives of collecting unique spatial data of individual experiences, visualizing socio-spatial processes, breaking down particular barriers of positionality in research, and developing new uses of GIS. We argue that sketch maps have many methodological merits. They add an invaluable dimension to the qualitative interview process, provide researchers with detailed spatial information of individuals, and facilitate data interpretation.
Mental Maps and Behavioral Geography
Mental maps were first used in modern geography within the behavioral geography tradition (Kitchin Citation1994; Golledge and Stimson Citation1997), which materialized during the broader spatial science movement of the quantitative revolution. In seeking a generalized understanding of human spatial behaviors, behavioral geography was embedded in the positivist framework of spatial science: to develop quantitatively verifiable and generalizable theories through logical and mathematical thinking. Their primary critique, however, was on the limitations of neoclassical economics assumptions of humans as rational beings with perfect locational knowledge. Rather than relying on such assumptions, behavioral geography argued that human behaviors could be investigated inductively, allowing researchers to construct models of understanding and replication. They argued that humans carry mental images of their surrounding environments, which can be accurately identified by researchers, and that actual human behaviors are strongly tied to those images (Johnston 1997). Although methodologically similar to spatial science, new approaches to studying human behavior were sought.
One technique used to study these personal environmental images was the mental map. This method was influenced by Lynch's (Citation1960) seminal study, in which he asked urban residents to draw maps of their city from memory. When compiled into a collective map, this information helped identify the most important elements of the urban built environment around which people structured their cognitive images of the city and subsequently influenced new theories of urban design. Orleans (Citation1973) followed this mental map approach to reveal how different people of various ethnic groups carried different spatial perceptions of the same Los Angeles neighborhood, and Gould and White (Citation1974) created a rank order of preferential desirability of living in certain cities based on subjects’ knowledge of places.
These early studies helped launch the cognitive mapping tradition of studying the attributive value, meaning, and memory associated with places, as well as the cognitive processes of spatial decision making and the behaviors of way-finding (Kitchin Citation1994). For example, mental maps are used to understand decision-making practices of individuals regarding residential choice, shopping and leisure destinations, commuting modes and routes (Kitchin, Blades, and Golledge Citation1997), travel behaviors (Weston and Handy Citation2004), or even criminal behavior location choices (Shalev Citation2008). Mental map exercises help researchers understand the spatial orientation and way-finding skills of humans (Downs and Stea Citation1973; Rovine and Weisman Citation1989), test distortions in perceptions of distances (Buttenfield Citation1986), or investigate how indigenous cultures perceive, remember, and share knowledge of space from a framework outside the Cartesian and Euclidean traditions of geographic space (Feinberg et al. Citation2003; Roberts Citation2010). Mental maps also capture peoples’ perceptions of places based on affective images—emotional and perceptive responses that attach feeling and meaning to a place based on remembered impressions or external influences (Spencer and Dixon Citation1983; Son Citation2005). This includes studies of how residents or tourists characterize cities based on their affective mental representations of Melbourne and Sydney (Son Citation2005) or East London, South Africa (Van Ommen and Painter Citation2005), or how perceived locations of fear emerged due to images constructed socially by media representations of Los Angeles neighborhoods following the riots of 1965 and 1992 (Matei and Ball-Rokeach Citation2005). The technique is also used to assess geographic literacy, whereby students receive a simple prompt (e.g., “Draw a map of the world”) and from memory draw freehand on blank paper. This approach has been used to examine how students’ geographic knowledge progresses over time (Metz 1990; Wiegand Citation1995) or to compare literacy among students across the globe (Kong et al. Citation1994; Saarinen and MacCabe Citation1995).
In looking across the studies in this literature, there are consistent practices of how mental maps are used in the research process. Generally, mental maps are paper-and-pencil free-form spatial drawings on blank paper. Without a grid reference system or base map, they are cartographically imprecise, but their broader purpose is to learn why people behave or think spatially the way they do—in relation to a person's environmental images or perceptions of place(s). As such, the mental map exercises tend to be the primary research instrument in a study.
Sketch Maps and Qualitative GIS
There has been a recent surge in the use of sketch maps in geographical research, which we identify as distinct from this mental map tradition. Although the act of spatial drawing is similar, and the origins are undoubtedly from the mental map tradition, we argue that current uses of sketch maps evolved from a different epistemological framework serving a different research purpose and are methodologically distinctive from mental maps. In particular, sketch maps used in QGIS today are bred from the critical GIS research concerns of knowledge production, positionality, and the appropriate role of technology. Generally, they are spatially referenced (cartographically accurate) maps that represent the unique and varied lived experiences of social groups, households, or individuals.
Challenging certain assumptions of epistemology, the critical turn in human geography questioned the relevance of positivist science and the plausibility of universal truth, generalizability, and objectivity. With strong influence from feminist and postcolonial thought, the critical geographic perspective articulated the importance of appreciating differences in identity and lived experiences of individuals and social groups, recognizing knowledge as situated or contingent, acknowledging the power and positionality of researchers, and the need to address social oppressions (Rose Citation1997; Kwan Citation2002; Leitner and Sheppard Citation2003; Blomley Citation2006). By the 1990s, these concerns filtered into the GIS community, which critically explored the social and scientific implications of GIS technologies (Sheppard Citation1995; Schuurman Citation1999; Sieber Citation2006) and the possibilities for socially and politically engaged GIS-based research (Schuurman and Kwan Citation2004). This critical GIS perspective counters scientific and social conservatism in geospatial technologies by critiquing dominant practices of knowledge production, implementing uses of GIS in critically informed progressive social research, and developing postpositivist techniques of GIS (Pavlovskaya Citation2009). Among many others, qualitative research methods became one important epistemological thread adopted by critical GIS for its authoritative way to produce knowledge sympathetic to the critical agenda. At their core, qualitative techniques allow in-depth and intensive data collection, knowledge production with alternative data sources, acquiring nondominant and local knowledge, the integration of mixed-method and multiscale analyses, and more representational possibilities of the unique, the individual, and multiple realities (Aitken and Kwan 2009; Cope Citation2010; Hay Citation2010). By conceptually opening up GIS beyond quantitative or positivist uses (Sheppard Citation2001), new methodological possibilities emerged to integrate these epistemological benefits of qualitative approaches with GIS. In practice, PPGIS was one turning point that precipitated socially relevant and community-engaged research projects that empowered voiceless groups or enabled individuals to take action against that which was negatively affecting their lives (McLafferty Citation2002; Sieber Citation2006).
Out of critical GIS's adoption of qualitative approaches emerged the QGIS body of literature, which examines the possibilities for integrating qualitative techniques with GIS (Kwan and Knigge 2006; Cope and Elwood Citation2009). As Pavlovskaya (Citation2006) argued, despite its computational origins, GIS is well suited for qualitative research, as many of its functionalities require no quantitative user skills. GIS can integrate multiple forms of data, facilitating information analysis and allowing visual representation of complex socio-spatial processes embedded in everyday life experiences of individuals (Kwan and Knigge 2006; Jones and Evans Citation2012). This provides a crucial opening for allowing the collection of nontraditional forms of data, especially from nondominant and local knowledge sources. Furthermore, given the critical GIS concern of technology power relations, whereby the researcher has privileged positionality as a technology insider, Wilson (Citation2009) argued that this insider–outsider relation breaks down in QGIS, which uses the technology in ways that exceed its intended purpose. Recent research has shown several unique manifestations of QGIS. Matthews, Detwiler, and Burton (Citation2005) used GIS to spatially contextualize ethnographically derived data to study welfare service provision and child development, and Knigge and Cope (Citation2006) used GIS visualization and grounded theory to analyze diverse views of reality in the study of community gardens. Jung (Citation2009) demonstrated the capabilities of linking computer-aided qualitative data analysis software with a GIS, Kwan and Ding (Citation2008) conducted narrative analysis with 3D GIS visualization of activity diaries, and Jones and Evans (Citation2012) developed spatial transcripts of interview narratives recorded while moving through space.
Each of these illustrates a unique integration of qualitative data and GIS technologies that assist in understanding the spatiality of different social processes. Here we focus on another manifestation: the use of sketch maps in QGIS research and allied fields. In the context of critical GIS, sketch maps first appeared as alternative forms of data collection within PPGIS. Researchers used participatory mapping techniques to facilitate public involvement in policy and decision making through collaboration with grassroots community organizations (Harris and Weiner Citation1998; Sieber Citation2006; St. Martin and Hall-Arber Citation2007) to integrate local knowledge data collection with map production. Since then, the use of sketch mapping in research has proliferated. Although not a new instrument of research, the current use of sketch maps’ theoretical origins and methodological merits are distinct from mental maps, as argued earlier. Next, we review many recent studies that utilized sketch mapping techniques from a critical or QGIS perspective.Footnote 1 In short, here sketch maps are research instruments for collecting spatially accurate data during a research interview or survey collection. They are used to focus on the spatial experiences and knowledge of interview participants, providing an opportunity for countermapping, beyond mapping of official statistics (Brennan-Horley and Gibson Citation2009). They typically are part of mixed-methods research design and are frequently digitized for integration with GIS for visualization and analysis purposes.
In many empirical studies, sketch maps act as a spatial data collection tool. Researchers are interested in knowing the locational experiences of individuals, such as spaces of daily life among lesbians (Cieri Citation2003), gender resource maps to visualize household spatial division of labor (Bee Citation2013), to examine where the creative city exists (Brennan-Horley and Gibson Citation2009), where persons acquire reproductive health services (Fielding and Cisneros-Puebla Citation2009), countermapping dominant discourse of fisheries (St. Martin and Hall-Arber Citation2007), where low-income individuals access basic services (Matthews, Detwiler, and Burton Citation2005), where children engage in various physical activities (Wridt Citation2010), or where household-level mosquito control takes place (Dongus et al. Citation2007). Researchers also commonly collect locational affective responses, capturing spatial information on where people have felt certain emotions. For example, Pain, MacFarlane, and Turner (Citation2006), Fielding and Cisneros-Puebla (Citation2009), and Wridt (Citation2010) asked participants to identify specific locations within cities where they felt particularly unsafe, as this directly impacted their capacity to engage in various urban opportunities. With an emphasis on locational experiences, these studies use spatially referenced materials during the sketch mapping process. Typically, the process uses a simple paper-and-pencil technology of participants sketching onto aerial images, base maps, or tracing paper, unlike the free-form blank paper drawings of mental mapping.
In these studies, the data collection procedures with sketch maps varied. Data were most commonly collected in community or small groups of five to eight individuals who worked collectively (Weiner and Harris Citation2003; Dongus et al. Citation2007; Fielding and Cisneros-Puebla Citation2009; Sletto et al. Citation2010; Wridt Citation2010). This process is a mechanism by which collective mapping acts to engage community members together and enhance their dialogue (Weiner and Harris Citation2003; Wridt Citation2010), to empower community members, and to provide the community with important spatial information (Dongus et al. Citation2007). A few studies employed sketch maps based on individual experience (Cieri Citation2003; Brennan-Horley and Gibson Citation2009) or household experiences (Matthews, Detwiler, and Burton Citation2005; D’Antona, Cak, and Vanwey Citation2008). In some instances, particularly in large studies, detailed and systematic sketch mapping procedures were used to keep data consistent across multiple interviewers (Dongus et al. Citation2007; D’Antona, Cak, and Vanwey Citation2008). It is common to use colored markers as a way to capture different themes, such as gradient levels of feeling safe in locations (Wridt Citation2010) or to differentiate responses from various interview questions (Weiner and Harris Citation2003; Brennan-Horley and Gibson Citation2009).
Many studies digitize sketch map data for integration with a GIS whereby the geographical outputs enable visualization as well as overlay and composite exploratory analysis. For example, constructed overlays compare collected local knowledge with official records or expert knowledge (Weiner and Harris Citation2003; Brennan-Horley and Gibson Citation2009; Sletto et al. Citation2010) or visually identify risk and vulnerability based on collected locations of human activity (Sletto et al. Citation2010; Wridt Citation2010). Composite maps aggregate results of the entire sample to visualize the areas of agreement or disagreement among study participants (Weiner and Harris Citation2003). At the individual level, sketch maps tell the stories and illustrate the unique spatial narratives of interview participants (Cieri Citation2003).
Among these studies, sketch maps are mostly used as a supplementary data collection technique alongside surveys, questionnaires, or interviews. In the behavioral geography tradition, mental maps serve as a singular data source to capture the spatial cognition or place perception of the subject who is drawing the map. Here, the sketch map serves as an added piece to a larger body of evidence and, in some cases, might help increase confidence in the accuracy of collected survey and interview information (D’Antona, Cak, and Vanwey Citation2008). They can also serve as an anchor around which an interview itself evolves (Brennan-Horley and Gibson Citation2009).
In summary, sketch maps as used in the QGIS tradition are cartographically accurate (not free-form) representations of individual and group spatial experiences, serving as supplemental data and commonly integrated with GIS for analysis. They are alternative forms of data that create cartographies of individual spatial narratives that can represent the diversity and complexity of peoples’ lived experiences. Because little to date has been written reflectively on the process and merits of sketch maps, the remainder of this article illustrates the use of sketch maps from two case studies. Then we ask how sketch maps help meet the objectives of QGIS. By using GIS in a new way, we argue that sketch maps facilitate the collection of spatial data, provide details of everyday lives, help visualize socio-spatial processes, and address particular issues of researcher positionality, particularly in the technology divide.
Sketch Map Case Study Description
The first case study included interviews with thirty working poor individuals in Columbus, Ohio, to examine household location decision making in relation to job commuting and home-to-work linkages. The research literature argues that job accessibility is a more complex process than simply location of workplace relative to residence (Hanson and Pratt Citation1995; Preston and McLafferty Citation1999). Individuals detailed their past and present job and housing locations, commuting patterns, and the factors of location decision making. The study found that these individuals have spatially transitory lives (frequently changing residences and jobs), that individual urban mobility largely determines spatial decision making, and that job access is a highly complex process at the individual scale (Boschmann Citation2011). The second case study interviewed six LGBT individuals in St. Louis, Missouri, to examine their spatial experiences of feeling safe or unsafe in public spaces, why they associated particular feelings with certain places, and how social behavior and identity changed based on their being in certain public spaces (Sanschagrin Citation2011). Literature on the geographies of fear argues that experiences and feelings of fear are contextual and situated (Pain Citation2000), and the geographical complexity has been demonstrated in research that also integrates GIS with qualitative data (Pain, MacFarlane, and Turner Citation2006). Similarly, this study found that feelings of safety in public space depended more on an individual's life experiences, rather than common characteristics of identity, such as race or income. More specific details on data collection, interpretation, and validity of these qualitative studies can be found in the original sources.
Figure 1 Original sketch map example from one interview subject (“Hank”) in Columbus, Ohio, with coded symbology of residence, employment, and commuting experiences. (Color figure available online.)
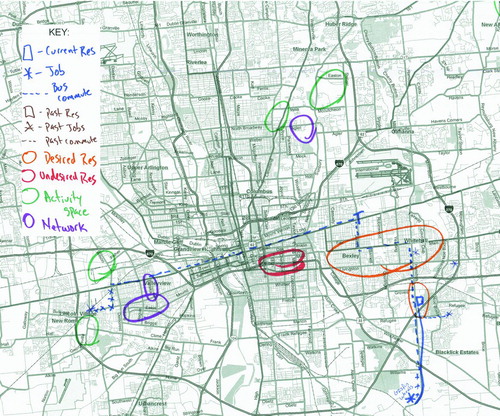
Both studies focused on the spatial experiences of individuals’ lives; thus, we used sketch maps during semistructured interviews (Dunn Citation2010) to record spatial information from interview subjects. We prepared spatially referenced base maps of the respective metropolitan regions, measuring 24″ by 36″ in size. These street-level maps contained highway and road networks, as well as other dominant features, such as parks, rivers, railroads, and place names of municipalities (suburbs). A fresh base map was used in each interview to allow marking directly on the map. shows a typical sketch map produced during the interviews. The job access study used a categorical colored marker coding scheme with symbology to mark past and present locations and trajectories identified by each informant (see key in ). To maintain consistency and clarity of color and symbology across maps from all participants, the researcher and interviewer drew sketch marks based on the informants’ comments during the interview. In the LGBT study, the researcher asked participants to identify where they felt safe or unsafe in public places using an ordinal colored marker coding scheme (e.g., yellow = very safe, blue = neutral, red = very unsafe). Here the participants actively marked up the paper map. Each resultant paper sketch map was digitally scanned, imported into a GIS as a digital image file, and georeferenced with existing boundary layer shapefiles. Then, all color marker features from each sketch map image were manually digitized into vector typology of points, lines, or polygons. is an example of the initial output of digitizing the sketch map with its derived features. A spatial database was created to store the digitized features, including fields for feature type, informant source, categorical or ordinal codes, and special comments from the interview.
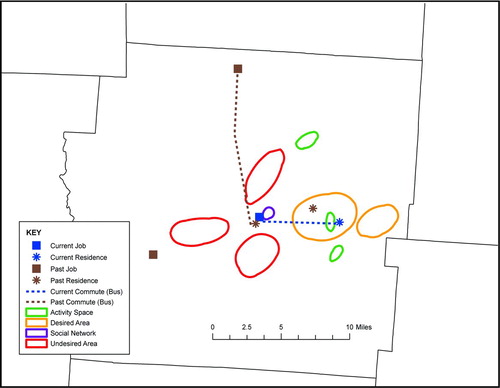
Figure 2 Digitized point, line, and polygon features of one sketch map in Columbus, Ohio. (Color figure available online.)
Discussion of Sketch Map Case Studies
Sketch maps were useful to collect spatial data information during qualitative interviews. In this process we also found that the use of sketch maps enhanced the interview itself, as they seemed to improve the conversations and dialogue and acted as a key supplement (Son Citation2005) to the interview. For instance, helping participants feel safe and willing to openly share is a key challenge in conducting interviews (Valentine Citation1997; Dunn Citation2010), and sketch maps helped establish rapport with informants (D’Antona, Cak, and Vanwey Citation2008). Interview sessions can be anxiety-producing situations for participants, with “official” informed consent documentation to sign, flashing digital recording devices, unfamiliar settings, and an unknown researcher with unknown motivations. We found that introducing a simple paper map had a somewhat calming effect. A map of their city represents something familiar and recognizable, with places that interview subjects can identify with. As an area of common knowledge and shared geography, it also seemed to diminish some level of researcher–subject barriers.
In addition to increasing their comfort, many participants were excited by the maps and became eager to discuss and show their experiences in the context of a familiar map. The base maps stimulated informants’ memories, furthering the interview conversation and enriching the quality and quantity of spatially specific data acquired. With few exceptions, participants engaged and interacted with the maps as they discussed their spatial experiences. The visual clues of streets, neighborhoods, suburbs, and other references helped participants recall other relevant instances otherwise forgotten. For example, in the LGBT study, while participants were mapping one level of emotion, they would often come across an area of the map previously missed while mapping a different emotion. Without the mapping exercise, they would not have included these areas as spaces of particular emotion. Thus, for the individuals, the process of “thinking aloud” with the maps through conversation (Shalev Citation2008) elicited more richly detailed descriptions. In this way, our experience corroborates with Brennan-Horley and Gibson's (Citation2009) assertion that sketch maps act as an anchor around which the interview process evolves. Given this strong sense that sketch mapping improved the interviews, what might have been lost from the interviews if the maps were not used? Future research might examine the effects of sketch maps on the interview procedure by conducting a controlled study of interviews with and without sketch maps.
Collecting spatial data with sketch maps also facilitates the process of qualitative data interpretation. One approach to interpreting interview data is coding an interview transcript that reduces responses into smaller meaningful ideas, which become linked to more specific concepts (Bazeley Citation2007). Through multiple exposures to the data—from the interview itself, to transcription, careful rereading, and coding—researchers engage in a crucial iterative process that allows key themes to emerge from the data (Miles and Huberman Citation1994; Knigge and Cope Citation2006; Bazeley Citation2007; Dunn Citation2010). In the same way, the laborious and time-consuming process of digitizing each sketch map became vital to this discovery process, reinforcing the connection between the interview transcript and the collected spatial information. Digitizing sketch maps becomes an added point of engagement with the interview data, particularly when unique comments and details of each interview get imported into the spatial database.
One key challenge of collecting spatial data with sketch maps was an uncertainty of how to mark less specific items or places on the base map, which subsequently implicates the digitizing process as well. For example, if a participant mentions a suburb name (e.g., “Worthington”), what gets marked and digitized? The municipal boundaries of Worthington, which might be expansive and jagged, or the place name label on the base map, which is somewhat arbitrarily located on the map? Generally we noticed people interacting with the place name label itself. But does that correctly represent the geographic location they intended? Or does it reference a more generalized impression of a place as “safe” or that “has many good jobs”? In another instance, allowing participants of the LGBT study to mark the sketch maps resulted in great variations in the amount of geographic area covered. Some chose to only color specific areas they were familiar with, whereas others colored the entire map area—much of it as neutral, indicating indifference or unfamiliarity with those places. This variation in coverage limited the analysis phase of comparing overlaps. Sketch mapping intends to capture personal expression of spatial reality, but researchers must decide in advance how to address these situations.
Sketch maps can provide details of the everyday lives of individuals, particularly through a narrative analysis approach—the study of peoples’ everyday life experiences situated within the sociocultural contexts of the larger society (Kwan and Ding Citation2008). As an example, represents the spatial narrative of “Hank's” experiences in negotiating the residential–commuting–workplace nexus. A fifty-three-year-old male living on the southeast side of town with his wife and daughter, until recently, Hank's family did not own a car, which required him to commute by bus, carpool with acquaintances, or bike and walk. His primary job was property maintenance for a company with four locations. Three sites were relatively close to home, easily reachable by bus, bike, or catching a ride. The site across town created a long and complicated commute consisting of two buses, a transfer with a wait, and a long walk to reach the job site. On weekends, Hank's secondary job was cleaning an industrial plant located south of his residence. He relied on bus service and walking, but weekend bus service was infrequent. The scale of does not show the many potential places of employment Hank knew existed in the outlying suburbs. Given his dependence on public bus service, he simply could not pursue distant jobs. In this way, a sketch map narrative illustrates real-world aspects of job access not revealed in traditional types of job access data: working multiple jobs and job sites, how limited transit service affects job choice, or the importance of biking and walking to complete a transit journey.
Visualization is an inherent and widely used function of GIS (Pavlovskaya Citation2006). Once digitized and integrated with GIS, sketch map data enable visualization of information, allowing researchers to graphically display and “see” data, assess the nature and quality of the data, and analyze relevant socio-spatial relations. For example, an overlay function allows for comparative analysis of collected interview data with GIS layers of other existing relevant spatial data of the larger context. For example, in the job access study, overlay with the public transit networks helped visualize the spatial disconnect between bus transit service areas with the locations of good-paying jobs identified by participants. This corroborated informants’ complaints that “the bus can't get me there” (Boschmann Citation2011). Furthermore, a composite map of the job access study () tells a collective story from the interviews. By compiling all digitized features from each individual sketch map, visual analysis reveals that job locations are scattered and dispersed across the city, with central and peripheral locations of equal significance. Residential locations, however, are more clustered, particularly in the southeast. Visualizing this pattern allowed us to suggest that it accurately reflected the socioeconomic residential patterns of the city, but it also prompted questions of whether the clustering was an effect of the snowballing recruitment technique. In another display that cartographically connected individuals’ residential and workplaces (see Boschmann [Citation2011, ]), it was apparent that proximity in the home–work link was quite varied and not contingent on commuting mode, which speaks to the proximity debate of the job access literature. Although participants mentioned many “good-paying jobs” existed in the city, by locating the information on the sketch maps they were able to visualize the jobs’ peripheral decentralized locations. Together, the collection of spatial data in sketch maps facilitates analysis in GIS as the interview data can be compared with layers of existing secondary data, compared against other interview participants, as well as create fuller visualizations of individual spatial experiences. The power of comparative analysis is also possible through composite maps.
Figure 3 Composite map aggregating spatial data of residential and employment locations collected from thirty interview participants in Columbus, Ohio. Source: Boschmann (Citation2011). (Color figure available online.)
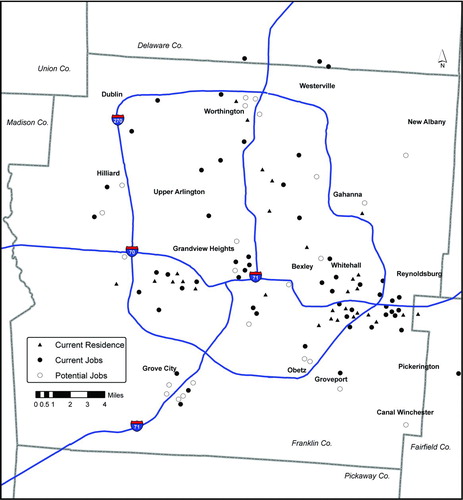
Figure 4 Example of digitized sketch maps for overlay analysis of public space experiences among two lesbian, gay, bisexual, and transgender study informants in St. Louis, Missouri. Subject A (top) and Subject F (bottom). (Color figure available online.)
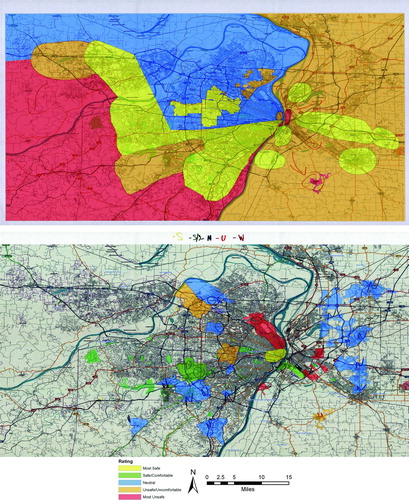
Figure 5 Visualization of the “creative epicenter” in Darwin, Australia, based on sketch map overlays of eighty-three creative workers. Source: Figure adapted by Chris Brennan-Horley, from Brennan-Horley and Gibson (Citation2009). (Color figure available online.)
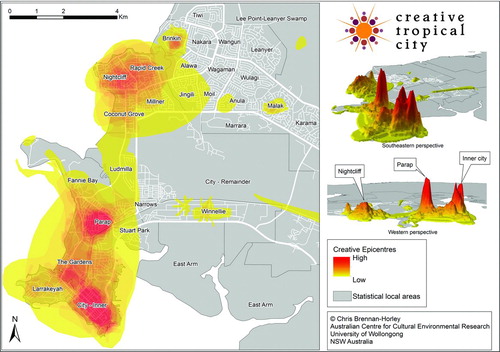
Composite maps, the aggregating of portions or all collected data from each interview, allows for intradata comparisons as well as collective summaries (Weiner and Harris Citation2003). The LGBT study used this approach to identify public spaces of fear and safety commonly experienced among the participants. illustrates these spaces in sketch maps of two participants. Each annotated space was digitized into a polygon enabling comparisons of common overlapping areas of each ordinal value (e.g., “very safe”) to understand how LGBT community members individually and collectively experienced public space. For example, areas of high overlap were those marked as neutral (St. Louis County and areas beyond the suburbs) and very safe (generally the City of St. Louis and many of the suburbs), whereas least overlapped areas were those marked as unsafe (limited to North St. Louis county and some rural towns) and very unsafe (limited to parts of East St. Louis). Whereas participants commonly acknowledged some areas as safe, experiences of unsafe areas were more variable in space and limited in scope. In some instances, subjects similarly qualified unsafe areas as “ghetto” or “hick” yet did not geographically identify these to be the same specific places. Analyzing a metropolitan region presents challenges in classification of large areas in which persons have less direct experience or knowledge, particularly with a small sample size. Brennan-Horley and Gibson's (Citation2009) study of eighty-three creative workers persuasively demonstrated the power of composite overlap mapping. By asking local creative class workers to draw on base maps the spaces of creative activity as they experienced it, the authors sought to discover the “creative epicenter” of Darwin, Australia. The resulting composite map () revealed several distinct zones, some that were unexpected based on traditional methods and official data sources of creative class mapping. This composite overlap approach allows subjects to contribute experiential data whereby patterns might emerge based on where subjects (dis)agree on the importance of a location in the study area.
We experienced that sketch maps address the power relations of GIS technology by working to break the insider–outsider positionality divide in research (Wilson Citation2009). As noted earlier, sketch maps were well received in the interview setting, acting to build researcher–participant rapport, creating a more relaxed environment, and becoming a centerpiece of conversation. Participants appeared quite engaged by using a simple paper-and-pencil technology approach. The use of tablet computing technologies during interviews could be a savvy way to enable on-the-fly digitizing, but it would limit the effectiveness of the wider contextual scope of a 24″ × 36″ map and might generate a technology barrier with participants; it should thus be considered cautiously.
In our experiences, the tangible visual–spatial representation of individual life experiences of the sketch maps caused some participants to become self-reflective. For example, in the job access study when seeing work and home locations within the larger metropolitan area context, one person stated, “I never looked at it in this way,” and another said, “I think I need to make a change in where I work.” In such instances, this seemed a moment of empowerment through mapping (Harris and Wiener Citation1998; Sieber Citation2006), enabling individuals to think proactively about their commuting experiences.
If engaging the participants in sketch mapping is a beneficial process, does it matter who marks up the sketch map? One general criticism of hand-drawn maps in research is the sensitivity to graphical and drawing skills of the person drawing (Shalev Citation2008), which is particularly true in free-form mental maps. In our studies we took differing approaches, largely based on the complexity of the coding scheme for the sketch maps. The job access study used a complex color and graphical code; thus, to maintain coding scheme consistency the researcher drew these sketches. Does this act somehow disempower participants, by seemingly removing them from the mapping process? In the LGBT study the coding scheme was much simpler, with only five colors representing different levels of comfort. Participants drew their spaces of fear and safety using any annotation method they desired, which allowed for more affective and personal representations in the maps (e.g., a heart shape drawn to indicate an area of particular affection). The differing bodies of literature suggest that (in)direct involvement in map creation reflects the varieties of research questions pursued with sketch or mental maps (Bell 2009). How to best incorporate participants’ engagement with the mapping and technology remains a lingering challenge in using sketch maps for research.
Conclusion
Sketch maps are increasingly being used in geographic research to create cartographies of individual spatial narratives. This article argues that sketch maps in QGIS are epistemologically and methodologically distinct from the earlier tradition of mental maps of behavioral geography. Although creating cartographies of people is complex (Dorling Citation1998), this has posed a challenge to find alternative approaches to cartographically illuminate the unique and particular individual urban experiences. As a form of countermapping to traditional approaches, such sketch maps provide nuanced and differentiated geographies of how subjects themselves experience their spatial lives (Brennan-Horley and Gibson Citation2009). Through case studies and a review of literature, this article has demonstrated how sketch maps help achieve QGIS's objectives of collecting unique spatial data of individual experiences, visualizing socio-spatial processes, breaking down particular barriers of positionality in research, and developing new uses of GIS. Sketch maps also have methodological merits in aiding the qualitative interview process and facilitating data interpretation and analysis through visualization, overlays, and composite mapping techniques.
The democratization of mapping (Crampton Citation2010) and the many openings for integration of qualitative research with GIS (Pavlovskaya Citation2006) provide fertile grounds for expanded uses of sketch mapping research. Future research could examine other technological means of collecting sketch map data, through tablet technology, Internet-based mapping, or the burgeoning phenomenon of individual location sharing via social media platforms. Our studies used the traditional pencil-and-paper approach to minimize potential barriers with interview subjects; future work must consider how sophisticated technologies might impact the data collection. We believe that sketch mapping as a data collection tool has applicability to a wide range of research topics across many disciplines. At the same time, though, an ongoing challenge in GIS is how to represent knowledge “while avoiding the seduction and artifice of the ‘wow’ factor” (Aitken and Kwan 2009, 295) and misusing sketch maps for chic appeal. Furthermore, future work should also consider how spatial patterns derived from sketch map techniques might effectively inform social policies, which might overlook them in favor of more traditional empirical methods (Brennan-Horley and Gibson Citation2009). Finally, as the potential uses of GIS continue to expand, future research can explore further dimensions for analyzing sketch maps and integrating them into GIS (Elwood Citation2010).
Notes
1. Some literature comes from allied fields such as sociology, anthropology, or public health. Not all explicitly engage critical or QGIS literatures but emerge from similar epistemological frameworks.
Related Research Data
Literature Cited
- Aitken , S. and Kwan , M. P. 2009 . “ GIS as qualitative research: Knowledge, participatory politics, and cartographies of affect ” . In The handbook for qualitative methods in geography , London : Sage . , ed. D. DeLyser, S. Herbert, S. Aitken, M. Crang, and L. McDowell, 286–303.
- Bazeley , P. 2007 . Qualitative data analysis with NVivo , Los Angeles : Sage .
- Bee , B. 2013 . Who reaps what is sown? A feminist inquiry into climate change adaptation in two Mexican ejidos . ACME: An International E-Journal for Critical Geographies , 12 ( 1 ) : 131 – 54 .
- Bell , S. 2009 . “ Mental maps ” . In International encyclopedia of human geography , Oxford, UK : Elsevier Science . , ed. R. Kitchin and N. Thrift, vol. 7, 70–75.
- Blomley , N. 2006 . Uncritical critical geography? . Progress in Human Geography , 30 : 87 – 94 .
- Boschmann , E. E. 2011 . Job access, location decision, and the working poor: A qualitative study in the Columbus, Ohio metropolitan area . Geoforum , 42 : 671 – 82 .
- Brennan-Horley , C. and Gibson , C. 2009 . Where is creativity in the city? Integrating qualitative and GIS methods . Environment and Planning A , 41 : 2595 – 2614 .
- Buttenfield , B. P. 1986 . Comparing distortions on sketch maps and MDS configurations . The Professional Geographer , 38 : 238 – 46 .
- Cieri , M. 2003 . Between being and looking: Queer tourism promotion and lesbian social space in greater Philadelphia . ACME: An International E-Journal for Critical Geographies , 2 : 147 – 66 .
- Cope , M. 2010 . “ A history of qualitative research in geography ” . In The Sage handbook of qualitative geography , Edited by: DeLyser , D. , Herbert , S. , Aitken , S. , Crang , M. and McDowell , L. 25 – 46 . London : Sage .
- Cope , M. and Elwood , S. 2009 . Qualitative GIS: A mixed methods approach , Thousand Oaks , CA : Sage .
- Crampton , J. W. 2010 . Mapping: A critical introduction to cartography and GIS , Chichester , , UK : Wiley-Blackwell .
- D’Antona , A. , Cak , A. D. and Vanwey , L. K. 2008 . Collecting sketch maps to understand property land use and land cover in large surveys . Field Methods , 20 : 66 – 84 .
- Dongus , S. , Nyika , D. , Kannady , K. , Mtasiwa , D. , Mshinda , H. , Fillinger , U. , Drescher , A. W. , Tanner , M. , Castro , M. C. and Killeen , G. F. 2007 . Participatory mapping of target areas to enable operational larval source management to suppress malaria vector mosquitoes in Dar es Salaam, Tanzania . International Journal of Health Geographics , 6 : 37 – 52 .
- Dorling , D. 1998 . Human cartography: When it is good to map . Environment and Planning A , 30 : 277 – 88 .
- Downs , R. M. and Stea , D. 1973 . Image and environment: Cognitive mapping and spatial behavior , Chicago : Aldine .
- Dunn , K. 2010 . “ Interviewing ” . In Qualitative research methods in human geography , Edited by: Hay , I. 101 – 38 . Oxford , , UK : Oxford University Press .
- Elwood , S. 2010 . Thinking outside the box: Engaging critical geographic information systems theory, practice and politics in human geography . Geography Compass , 4 : 45 – 60 .
- Feinberg , R. , Dymon , U. J. , Paiaki , P. , Rangituteki , P. , Nukuriaki , P. and Rollins , M. 2003 . “Drawing the coral heads”: Mental mapping and its physical representation in a Polynesian community . Cartographic Journal , 40 : 243 – 53 .
- Fielding , N. and Cisneros-Puebla , C. A. 2009 . CAQDAS-GIS convergence: Toward a new integrated mixed method research practice? . Journal of Mixed Methods Research , 3 : 349 – 70 .
- Golledge , R. G. and Stimson , R. J. 1997 . Spatial behavior: A geographic perspective , New York : Guilford .
- Goodchild , M. 2007 . Citizens as sensors: The world of volunteered geography . GeoJournal , 69 : 211 – 21 .
- Gould , P. R. and White , R. 1974 . Mental maps , New York : Penguin .
- Hanson , S. and Pratt , G. 1995 . Gender, work, and space , London and New York : Routledge .
- Harris , T. and Weiner , D. 1998 . Empowerment, marginalization and “community-integrated” GIS . Cartography and Geographic Information Systems , 25 : 67 – 76 .
- Hay , I. 2010 . Qualitative research methods in human geography. , Oxford , , UK : Oxford University Press .
- Johnston , R. J. 1997 . Geography and geographers: Anglo-American human geography since 1945, , 5th ed. , London : Arnold .
- Jones , P. and Evans , J. 2012 . The spatial transcript: Analysing mobilities through qualitative GIS . Area , 44 : 92 – 99 .
- Jung , J.-K. 2009 . “ Computer-aided qualitative GIS: A software-level integration of qualitative research and GIS ” . In Qualitative GIS: A mixed methods approach , Edited by: Cope , M. and Elwood , S. 115 – 35 . Thousand Oaks , CA : Sage .
- Kitchin , R. 1994 . Cognitive maps: What are they and why study them? . Journal of Environmental Psychology , 14 : 1 – 19 .
- Kitchin , R. M. , Blades , M. and Golledge , R. G. 1997 . Relations between psychology and geography . Environment and Behavior , 29 : 554 – 73 .
- Knigge , L. and Cope , M. 2006 . Grounded visualization: Integrating the analysis of qualitative and quantitative data through grounded theory and visualization . Environment and Planning A , 38 : 2021 – 37 .
- Kong , L. , Savage , V. R. , Saarinen , T. and MacCabe , C. 1994 . Mental maps of the world: The case of Singapore students . Journal of Geography , 93 : 258 – 63 .
- Kwan , M.-P. 2002 . Feminist visualization: Re-envisioning GIS as a method in feminist geographic research . Annals of the Association of American Geographers , 92 : 645 – 61 .
- Kwan , M. P. and Ding , G. X. 2008 . Geo-narrative: Extending geographic information systems for narrative analysis in qualitative and mixed-method research . The Professional Geographer , 60 : 443 – 65 .
- Kwan , M. P. and Knigge , L. 2006 . Doing qualitative research using GIS: An oxymoronic endeavor? . Environment and Planning A , 38 ( 11 ) : 1999 – 2002 .
- Leitner , H. and Sheppard , E. 2003 . Unbounding critical geo- graphic research on cities: The 1990s and beyond . Urban Geography , 24 : 510 – 28 .
- Lynch , K. 1960 . The image of the city , Cambridge , MA : Technology Press .
- Matei , S. A. and Ball-Rokeach , S. 2005 . Watts, the 1965 Los Angeles riots, and the communicative construction of the fear epicenter of Los Angeles . Communication Monographs , 72 : 301 – 23 .
- Matthews , S. , Detwiler , J. and Burton , L. 2005 . Geo-ethnography: Coupling geographic information analysis techniques with ethnographic methods in urban research . Cartographica , 40 : 75 – 90 .
- McLafferty , S. 2002 . Mapping women's worlds: Knowledge, power and the bounds of GIS . Gender Place and Culture , 9 : 263 – 69 .
- Metz , H. M. 1990 . Sketch maps: Helping students get the big picture . Journal of Geography , 89 : 114 – 18 .
- Miles , M. B. and Huberman , A. M. 1994 . Qualitative data analysis: An expanded sourcebook , Thousand Oaks , CA : Sage .
- Orleans , P. 1973 . “ Differential cognition of urban residents: Effects of social scale on mapping ” . In Image and environment: Cognitive mapping and spatial behavior , Edited by: Downs , R. M. and Stea , D. 115 – 30 . Chicago : Aldine .
- Pain , R. 2000 . Place, social relations and the fear of crime: A review . Progress in Human Geography , 24 : 365 – 87 .
- Pain , R. , MacFarlane , R. and Turner , K. 2006 . “When, where, if, and but”: Qualifying GIS and the effect of streetlighting on crime and fear . Environment and Planning A , 38 : 2055 – 74 .
- Pavlovskaya , M. 2006 . Theorizing with GIS: A tool for critical geographies? . Environment and Planning A , 38 : 2003 – 20 .
- Pavlovskaya , M. 2009 . Critical GIS and its positionality . Cartographica , 44 : 8 – 10 .
- Preston , V. and McLafferty , S. 1999 . Spatial mismatch research in the 1990s: Progress and potential . Papers in Regional Science , 78 : 387 – 402 .
- Roberts , M. 2010 . Mind maps of the Maori . GeoJournal , 77 : 741 – 51 .
- Rose , G. 1997 . Situating knowledges: Positionality, reflexivities and other tactics . Progress in Human Geography , 21 : 305 – 20 .
- Rovine , M. J. and Weisman , G. D. 1989 . Sketch-map variables as predictors of way-finding performance . Journal of Environmental Psychology , 9 : 217 – 32 .
- Saarinen , T. F. and MacCabe , C. L. 1995 . World patterns of geographic literacy based on sketch map quality . The Professional Geographer , 47 : 196 – 204 .
- Sanschagrin , E. 2011 . “ The LGBT community and public space: A mixed methods approach ” . Denver , CO : Master's thesis, University of Denver .
- Schuurman , N. 1999 . Chapter 1 introduction: Theorizing GIS, inside and outside . Cartographica , 36 : 1 – 108 .
- Schuurman , N. and Kwan , M.-P. 2004 . Guest editorial: Taking a walk on the social side of GIS . Cartographica , 39 : 1 – 3 .
- Shalev , K. 2008 . Sketch maps: An old technique with new applications . Issues in Forensic Psychology , 8 : 56 – 67 .
- Sheppard , E. 1995 . GIS and society: Towards a research agenda . Cartography and Geographic Information Science , 22 : 5 – 16 .
- Sheppard , E. 2001 . Quantitative geography: Representations, practices, and possibilities . Environment and Planning D , 19 : 535 – 54 .
- Sieber , R. 2006 . Public participation and geographic information systems: A literature review and framework . Annals of the Association of American Geographers , 96 : 491 – 507 .
- Sletto , B. , Muñoz , S. , Strange , S. M. , Donoso , R. E. and Thomen , M. 2010 . El Rincón de los Olvidados: Participatory GIS, experiential learning and critical pedagogy in Santo Domingo, Dominican Republic . Journal of Latin American Geography , 9 : 111 – 35 .
- Son , A. 2005 . The measurement of tourist destination image: Applying a sketch map technique . International Journal of Tourism Research , 7 : 279 – 94 .
- Spencer , C. and Dixon , J. 1983 . Mapping the development of feelings about city: A longitudinal study of new residents’ affective maps . Transactions of the Institute of British Geographers , 8 : 373 – 83 .
- St. Martin , K. and Hall-Arber , M. 2007 . “ Environment and development: (Re)connecting community and commons in New England fisheries, USA ” . In Participatory action research approaches and methods: Connecting people, participation and place , Edited by: Kindon , S. , Pain , R. and Kesby , M. 51 – 59 . London and New York : Routledge .
- Tuan , Y.-F. 1975 . Images and mental maps . Annals of the Association of American Geographers , 65 : 205 – 13 .
- Valentine , G. 1997 . “ Tell me about … : Using interviews as a research methodology ” . In Methods in human geography: A guide for students doing research projects , Edited by: Flowerdew , R. and Martin , D. 110 – 25 . Harlow , , UK : Longman .
- van Ommen , C. and Painter , D. 2005 . Mapping East London: Sketching identity through place . South African Journal of Psychology , 35 : 505 – 31 .
- Wallingford , D. K. 1937 . A New Yorker's idea of the United States , New York : Columbia University Press .
- Weiner , D. and Harris , T. 2003 . Community-integrated GIS for land reform in South Africa . URISA Journal , 15 : 61 – 73 .
- Weston , L. and Handy , S. 2004 . “ Mental maps ” . In Handbook of transport geography and spatial systems , Edited by: Hensher , D. A. , Button , K. J. , Haynes , K. E. and Stopher , P. R. 533 – 46 . Amsterdam : Elsevier .
- Wiegand , P. 1995 . Young children's freehand sketch maps of the world . International Research in Geographical and Environmental Education , 4 : 19 – 28 .
- Wilson , M. 2009 . “ Towards a genealogy of qualitative GIS ” . In Qualitative GIS: A mixed methods approach , Edited by: Cope , M. and Elwood , S. 156 – 70 . Thousand Oaks , CA : Sage .
- Wridt , P. 2010 . A qualitative GIS approach to mapping urban neighborhoods with children to promote physical activity and child-friendly community planning . Environment and Planning B: Planning and Design , 37 : 129 – 47 .