
 ?Mathematical formulae have been encoded as MathML and are displayed in this HTML version using MathJax in order to improve their display. Uncheck the box to turn MathJax off. This feature requires Javascript. Click on a formula to zoom.
Abstract
The spatial distribution of public hospitals is a crucial factor in patient access and thus important to health equity, especially amid the COVID-19 pandemic crisis. In China, a major issue is to improve accessibility to public health care in the face of the limited space for further growth of cities. Therefore, this study assesses the current spatial accessibility patterns to public hospitals in Shanghai, using point density analysis and the comprehensively improved gravity model. The results identify the challenges of inadequate and imbalanced spatial distribution of public hospitals at the district level and show that the central urban area has more high-quality public health care resources and also has higher accessibility levels. Based on the comparisons in each district, the study also summarizes four policy implications for future public hospital and public health care system optimization in Shanghai, which can also be leveraged for the planning of public hospitals in other cities or other public service facilities. The first is to deploy public hospitals in areas with a large population and to introduce branches of top-level hospitals to noncentral areas. The second is the full utilization of community health service centers to relieve the burden of public hospitals to improve accessibility.
公立医院的空间分布是患者得到治疗的重要因素, 对健康公平至关重要—尤其是在新冠病毒流行期间。在中国, 主要的问题是:在有限的城市发展空间里去改善公共健康服务的可及性。本研究采用点密度分析和全面改进的重力模型, 评估了上海市公立医院的空间可及性模式。研究结果指出, 区级公立医院的空间分布面临着不充分和不平衡的挑战, 城市中心有更多高质量的公共健康服务资源、更高的可及性。基于对上海市各区的比较, 本研究还总结出了优化上海市未来公立医院和公共健康服务体系的四个政策, 也可用于其它城市公立医院或其它公共服务设施的规划。一是在人口众多的地区设立公立医院, 在非中心地区引入高等级医院的分支机构。二是充分利用社区健康服务中心, 减轻公立医院的负担, 提高可及性。
La distribución espacial de los hospitales públicos es un factor crucial para el acceso de los pacientes y, por lo mismo, importante para la equidad sanitaria, en especial en medio de la crisis de la pandemia del COVID-19. En China, una de las principales cuestiones es mejorar la accesibilidad a la salubridad pública frente a las restricciones de espacio para el mayor crecimiento de las ciudades. Por tanto, este estudio evalúa los actuales patrones de acceso espacial a los hospitales públicos en Shanghái, usando el análisis de densidad de puntos y el modelo de gravedad, notable e íntegramente mejorado. Los resultados identifican los desafíos que presenta una distribución espacial inadecuada y desequilibrada de los hospitales públicos, a nivel distrital, y muestran que el área urbana central cuenta con mayores recursos de servicios de salud pública de alta calidad y tiene también más altos niveles de accesibilidad.
Access to health services is a fundamental need that matters for all people (World Health Organization Citation2017). Different from other needs such as food and shelter, health care has a distinct impact on opportunity equality as disease and disability can restrict the range of opportunities open to individuals (Daniels Citation1983; C. Yin et al. Citation2018). Moreover, health care is usually scarcer in quantity, more unequal in distribution, and more expensive than other needs (Daniels Citation2001; Pan et al. Citation2016). Therefore, the importance and scarcity of health care jointly render the equity in health care distribution, mainly realized by hospitals, a critical social justice issue. In addition to health care resource allocation inside hospitals, the spatial distribution of hospitals, a crucial factor in patient access, has been widely recognized as important to determine not only health outcomes but also health equity (Braveman Citation2006; Buchmueller, Jacobson, and Wold Citation2006; World Health Organization Citation2020). Especially amid the recent COVID-19 pandemic, there is an urgent need to provide spatially balanced and accessible health facilities in urban areas (Yao et al. Citation2021). Thus, researchers worldwide, including but not limited to western Asia, Europe, and the United States, have put particular focus on the spatial accessibility patterns of health care facilities, and many of them identified that there could be a considerable variation in terms of the spatial distribution and accessibility of health care facilities, regardless of the study methods they used (Fransen et al. Citation2015; Mansour Citation2016; P. Yin Citation2019).
Relevant studies on the spatial distribution of hospitals mainly focus on four aspects: (1) comparison of accessibility level to hospitals among different regions of a certain population residence (Hou and Jiang Citation2014; G. Cheng et al. Citation2016; Reshadat et al. Citation2019), (2) comparison of accessibility level to different kinds of hospitals among a certain population (Alam et al. Citation2013; Pan et al. Citation2016), (3) the spatial distribution analysis of hospitals among a certain population to treat a certain type of disease (De Mello-Sampayo Citation2016; L. Liu and Wang Citation2020), and (4) comparison of accessibility level to hospitals by different travel modes (S. Zheng et al. Citation2019; Y. Zhang et al. Citation2020). For example, G. Cheng et al. (Citation2016) explored the difference in spatial accessibility to high-level hospitals with a kernel density two-step floating catchment area method and found that accessibility in south and central parts of Shenzhen, a megacity in southern China, was significantly higher than that in the eastern and western parts (G. Cheng et al. Citation2016). Pan et al. (Citation2016) combined the results of the nearest-neighbor method and the enhanced two-step floating catchment area (E2SFCA) method and found that public hospitals surpassed private hospitals in spatial accessibility, whereas the west Sichuan Province of China only relied on public health care (Pan et al. Citation2016). L. Liu and Wang (Citation2020) explored the spatial distribution of 117 fever clinics in Shanghai against the background of COVID-19 and found that the density of fever clinics in suburban areas is markedly lower than that in the central urban area (L. Liu and Wang Citation2020). Zheng et al. (Citation2019) discovered that there are significant differences in hospital accessibility and travel time using public transit and self-driving modes of transportation (Zheng et al. Citation2019).
Existing studies frequently use accessibility level indicators to quantitatively measure the rationality of spatial distribution (Kanuganti, Sarkar, and Singh Citation2016; Tan and Guan Citation2021). Accessibility can be defined as the difficulty of reaching certain facilities from somewhere based on a given way of transportation, in which the difficulty is decided by a multidimensional set of factors including the characteristics of providers, the preferences, and the affordability of consumers’ transportation networks (Dalvi and Martin Citation1976; Jiao et al. Citation2012; Guan Citation2019). The most commonly used methods in calculating the accessibility level are E2SFCA models (W. Luo and Qi Citation2009; Ngui and Vanasse Citation2012), network analysis models (Tao et al. Citation2018), and improved gravity models (Yiannakoulias, Bland, and Svenson Citation2013). In these methods, travel time is always one of the variables factored into the accessibility level. Although travel time is usually estimated in geographic information systems (GIS) by setting the travel cost for different kinds of roads (Yang et al. Citation2016), some recent studies have indicated the advantages of using travel time generated by Web mapping application programming interfaces (APIs) to measure travel impedance (Socharoentum and Karimi Citation2015; S. Zhang et al. Citation2019). Taking various factors such as speed limits, waiting times, and traffic jams into consideration, the results can be more accurate than using a fixed, hypothetical impedance coefficient to predict travel time and can also better simulate route planning in real life than using road network analysis (Zheng et al. Citation2019).
In China, along with the rapid economic development in the past decades, health care provision has also improved but not enough to cope with large urbanized populations with relatively limited medical resources (S. Liu and Griffiths Citation2011). Public hospitals aim to provide basic health care to cover the entire population (National Health Commission of the People’s Republic of China [NHCPRC] Citation2018, Citation2020), and thus the current national health care insurance covers partial treatment fees incurred in public hospitals to reduce the costs for public health care (Shanghai Municipal People’s Government [SMPG] Citation2019). Moreover, the average number of patient beds of public hospitals in urban areas of large cities is often below national averages due to the higher density of population served, which is contrary to common sense, as shown in Appendix B, (NHCPRC Citation2019). Consequently, the spatial distribution of public hospitals, an important component of the national health system, is a critical issue of public policymaking (Zhu et al. Citation2019).
There are two main research gaps in the existing studies. The first is that although integrating big data–based Web mapping APIs into accessibility measurement is still in its burgeoning stages, most of the studies that use the Web mapping API directly use the travel time generated from a Web mapping API as the accessibility measurement or put it into simplified measurement models that neglect many other factors such as the class, capacity of the hospital, and the population (Guan et al. Citation2021). The second is that many of the existing studies conduct either city-level or district-level analysis on the spatial distribution and accessibility of health care facilities and stop at identifying the localized pattern for one particular city or region. The study design renders the results not deep enough because, without sensitivity analysis, it cannot dig out the fundamental problem and the targeted solution. Also, given that the fundamental problem and relationship have not been revealed, the results generated are localized, and thus the policy implications offered cannot be widely leveraged to other places.
In view of these facts, this study examines both the spatial distribution and the accessibility pattern of public hospitals in Shanghai for a comprehensive analysis. The study first uses point density analysis to directly examine the spatial distribution characteristics of public hospitals in Shanghai. More important, this study further examines the rationale of the public hospital spatial distribution from the patient perspective through the accessibility indicator calculated with the improved gravity model and the travel time generated by the Web mapping API. Compared with existing studies, this study closes the research gap by making contributions from the following two perspectives. First, this study integrates the big data–based Web mapping API into an improved gravity model that considers the class, capacity, and nearby population’s competition of public hospitals to improve the precision of accessibility analysis without sacrificing comprehensiveness. Such methodology has seldom been seen in relevant studies especially in the Chinese context. Second, this study follows a sensitivity analysis approach in the accessibility analysis from city level to district level. Many of the previous studies end with the analysis of the existing spatial distribution patterns (Ngui and Vanasse Citation2012; Zheng et al. Citation2019). This study summarizes the challenges and experiences in the case of Shanghai based on accurate and in-depth identification. Furthermore, this study offers suggestions to better the spatial distribution of public hospitals in Shanghai. The framework of this study could be leveraged for spatial planning of public hospitals in other cities or other public service facilities due to their commonality.
Materials and Methods
Study Area and Data
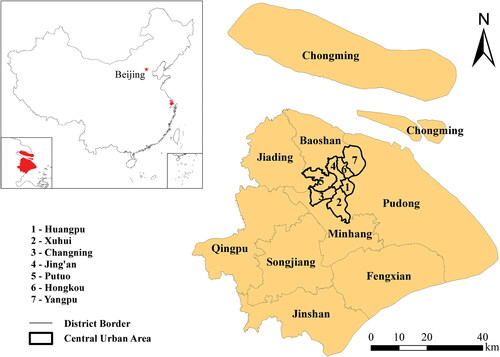
The study area of Shanghai, shown in ,Footnote1 was selected using the 2019 Shanghai Administrative Map in the 2019 Shanghai Almanac (Office of Shanghai Chronicles [OSC] Citation2020). The study area covers all sixteen districts of Shanghai, including seven districts in the central urban area (i.e., Huangpu, Xuhui, Changning, Jing’an, Putuo, Hongkou, and Yangpu), one district in the central-suburban area (i.e., Pudong), and eight districts in the suburban area (i.e., Minhang, Baoshan, Jiading, Jinshan, Fengxian, Songjiang, Qingpu, and Chongming). The central-suburban area and the suburban area are collectively referred to as the noncentral area. There are 214 subdistricts in total, the minimum research unit of this study, including 107 streets or Jiedao, 105 towns or Zhen, and two townships or Xiang (Office of Shanghai Chronicles Citation2020). The subdistrict government office is defined as the location of each population point, where all residents in the subdistrict are supposed to depart from. The population of the subdistricts was obtained from the 2019 statistical yearbook of each district. The travel time used in this study is obtained through Baidu’s Web mapping API (see https://map.baidu.com/).Footnote2
Figure 1 The study area of Shanghai.
Methods for the Point Density Analysis and Comprehensively Improved Gravity Model
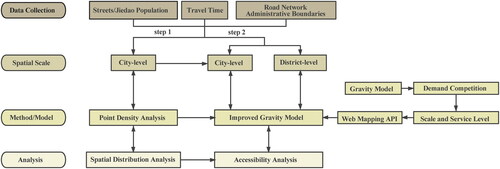
This study applied the point density analysis in GIS to visualize the spatial distribution of public hospitals. The point density analysis calculates the density of point features by totaling and dividing the number of points that fall within the area of the neighborhood of a cell. The accessibility indicator for each population point was calculated using the improved gravity model. The research design framework is summarized in a flowchart in . The gravity model is expressed in EquationEquation 1(1)
(1) :
(1)
(1)
where
is the aggregated accessibility index of population point i to all reachable hospitals,
is the accessibility index of population i to reachable hospitals j, n is the quantity of destination j,
is the scale of j, and
is the impedance between i and j when the friction coefficient is
Although
is necessary when using the network analysis in GIS to quantify the estimated travel friction, it is no longer needed because the travel time generated from the big data–based Web mapping API has already considered the friction.
Figure 2 Flowchart of the research design.
Based on EquationEquation 1(1)
(1) , Weibull (Citation1976) improved the gravity model by integrating the demand competition among potential patients into the model because health care resources are generally limited (Weibull Citation1976). The improved model is expressed in EquationEquations 2
(2)
(2) and Equation3
(3)
(3) :
(2)
(2)
(3)
(3)
where
is the competition among population points around the reachable scale of hospital j, m is the number of reachable population points around hospital j,
is the population quantity of the population point i, and
is the impedance between i and j when the friction coefficient is
Similar to
is no longer needed because the travel time generated from the big data–based Web mapping API has already considered the friction.
Although the scale and the service level of a hospital have a positive correlation with its attractiveness to potential patients, in Chinese hospital systems, they can be reflected through the class level of the hospital. Therefore, this study further improves EquationEquation 2(2)
(2) into EquationEquation 4
(4)
(4) :
(4)
(4)
where the
in EquationEquation 2
(2)
(2) is calculated by multiplying
by
in which
is the class coefficient of hospital j and
represents its service ability.
To be more accurate and aligned with the practical traveling situation, this study further improves the gravity model by using the generated by the Baidu Web mapping API to measure the travel time from population point i to public hospital j (or reverse) given all impedance factors instead of the traditional network analysis module in GIS.
The final version of the improved gravity model used in this study is expressed in EquationEquations 5(5)
(5) and Equation6
(6)
(6) :
(5)
(5)
(6)
(6)
The improved gravity model considers various factors in the process of access: the location, class, and scale of the hospitals; potential competition within and among population points; and traffic conditions. is quantified by the number of hospital patient beds. Considering the actual situation in Shanghai in which there are only five classes available for public health institutions,
is 5 when public hospital j is a 3A, 4 when public hospital j is a 3B, 3 when public hospital j is a 2A, and 2 when public hospital j is a 2B.
is the 2018 year-end population of subdistrict i. This study uses the interrupt travel times for
based on the class coefficient of public hospitals adopted from M. Cheng and Lian (Citation2018): no limitation for third-class hospitals and
minutes for second-class hospitals. M. Cheng and Lian (Citation2018) conducted a survey among residents for the interrupted travel time.Footnote3
Results
Spatial Distribution of Public Hospitals
Overall, public hospitals in Shanghai are disproportionately distributed, as shown in . More specifically, the spatial distribution of public hospitals is dense in the central urban area and sparse in the suburbs. The spatial distribution of community health care centers is shown in , which provides general information on overall health service facilities in Shanghai. The density of public hospitals and the occupancy of public hospitals per thousand people by district are given in .Footnote4
Figure 3 Density distribution of public hospitals in Shanghai.
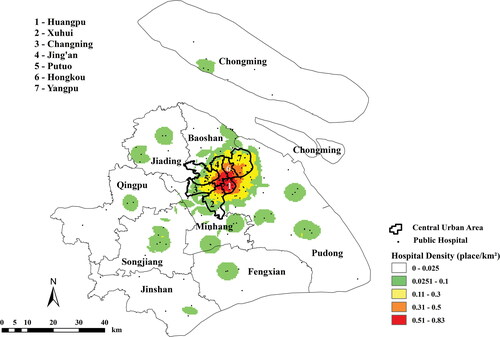
Figure 4 The community health service centers in Shanghai.
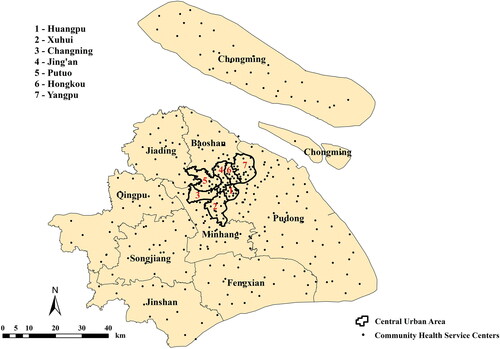
Table 1 Spatial distribution of public hospitals in Shanghai
Taking acreage and population into consideration, the imbalance of the spatial distribution of public hospitals in Shanghai becomes more significant (see ). With merely 4.56 percent of the total acreage and 28.41 percent of the total population, the central urban area contains eighty-two public hospitals, nearly half the total number. Although the central districts generally have a higher population density, based on the indicator of public hospitals per thousand people, the central urban area still has a higher share of public hospitals. The occupancy of public hospitals normalized by population in the central urban area is 1.75 times higher than the Shanghai average and roughly 2.5 times higher than the average level of the noncentral area. In addition to the imbalance in quantity, the quality of public hospitals in the central urban area is generally higher than that in the noncentral area. Furthermore, among the seventy-four third-class public hospitals in Shanghai, thirty-nine are in the central urban area, accounting for more than half of the total. Therefore, in general, the spatial distribution of public hospitals in Shanghai is imbalanced, with the central urban area housing abundant and high-quality public hospitals and the noncentral area, with larger acreage, more population, and yet lower density and lower occupancy per capita of public hospitals, containing public hospitals that are insufficient in both quantity and quality.
Accessibility Analysis
City-Level Accessibility Analysis. The city-level accessibility analysis is based on the scenario that patients choose and go to a public hospital after considering the class, scale, and travel time. Therefore, this part of the analysis is to examine the balance and rationality of spatial distribution of public hospitals from the perspective of patients, the actual users of public hospitals, through the indicator of accessibility to public hospitals. In combination with the definition of travel time this part of the analysis further requires that, in EquationEquation 5
(5)
(5) , all third- and second-class public hospitals within a thirty-minute drive from the population point in Shanghai are regarded as accessible; in EquationEquation 6
(6)
(6) , all population points are considered as accessible for the third-class public hospital, and all population points that are within a thirty-minute drive from the second-class public hospital are considered accessible for the second-class public hospital.
As shown in , the accessibility level to public hospitals in Shanghai varies from high (>315) to low (<125) from the central urban area to the noncentral area. The areas with the lowest accessibility level are not necessarily in the periphery of the suburban area, however. Besides northern Chongming, which has a large area with the lowest accessibility level, other lowest level areas are scattered in the noncentral area. In addition, there are high points of accessibility in the noncentral area, some of which are at the border of districts. In addition, the disparity in accessibility level is higher in the central urban area than in the noncentral area. Taking the spatial distribution of public hospitals into consideration, areas with dense location of public hospitals tend to have higher accessibility levels. Therefore, compared with residents in the noncentral area, central urban residents have quantitatively more accessible public health care resources. The competition indicators are shown in .
Figure 5 The city-level accessibility to public hospitals in Shanghai.
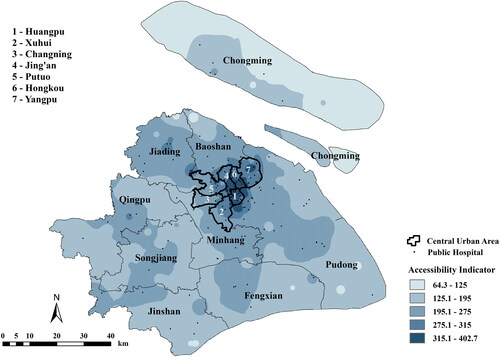
Table B.2 Statistical summary of public hospitals in Shanghai
District-Level Accessibility Analysis. The district-level accessibility analysis assumes that for patients, only public hospitals in their own district are accessible. In particular, the central urban districts are regarded as an entire district because they have relatively small acreage and vague borders in daily life. This analysis is designed for two reasons. First, although patients will go to public hospitals beyond the district border in reality, a balanced spatial distribution of public hospitals within the district ensures that patients can quickly access public health care resources. Second, district-level accessibility analysis enables in-depth analyses of spatial distribution of public hospitals for each district () and a comparison among districts (), which is meaningful for making health care–related policies at the district level. In addition, this study further explores experiences and exposes challenges at the district level, to provide suggestions on the future spatial planning of public hospitals. provides a summary of patient bed, hospital class coefficient, and district-level competition indicators.
Figure 6 The district-level accessibility to public hospitals of Shanghai, overall version (merging central district as one).
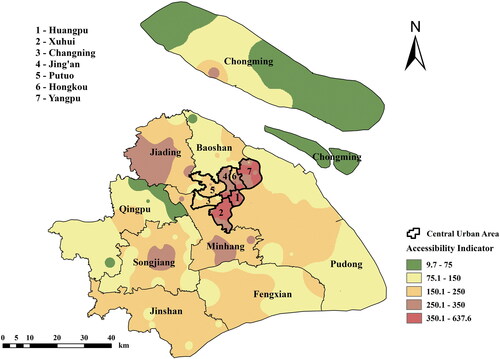
Table 2 The district-level accessibility indicator of Shanghai
Table B.3 Statistical summary of subdistricts in Shanghai
The overall accessibility level of the central districts is higher than the suburban districts. The numbers of public hospitals in Huangpu, Xuhui, and Yangpu are generally sufficient. These are also the districts with the highest accessibility level citywide.Footnote5 Comparing the city-level analysis and district-level analysis, one noteworthy point is that the low accessibility of Changning and Putuo districts is disguised in the city-level analysis, in which patients in these two districts are assumed to be able to visit all accessible hospitals within the city. This indicates that Changning and Putuo rely heavily on nearby districts’ public hospital resources. This can be proved when all central urban districts are regarded as a whole. As shown in Appendix A, the accessibility levels of Changning and Putuo are high, which is in sharp contrast to their accessibility levels in . The overall accessibility level of the districts in the suburban area is low, and the accessibility pattern varies greatly among districts.Footnote6
Discussion
As revealed by the results, the spatial distribution and accessibility of public hospitals in Shanghai are generally imbalanced, with the central urban area aggregating more and better hospitals and also enjoying better accessibility and the suburban area having both fewer hospitals and less accessibility. This imbalanced pattern of public hospitals can be largely attributed to the uneven development progress of Shanghai. Most of the central urban areas were actually concession areas in the Treaty Port era, and the current public health care system in the central urban area was largely the legacy of that special period (Yan Citation2013). In contrast, the suburban area of Shanghai did not rapidly develop from villages into suburbs until the 1990s when the Reform period of opening up and urbanization in Shanghai started. As the suburban area gradually developed and gathered more and more migrant workers, the public health care system then started to develop (Ouyang et al. Citation2017).
The central urban–suburban divide in public hospitals is dynamic rather than static, however, which can be proven by the study results showing that some suburban districts also have high performance in both spatial distribution and accessibility (e.g., Minhang) and some central urban districts have relatively poor performance (e.g., Changning). Some suburban districts have similar geographic location, population, and number of public hospitals, but the study shows that how they allocate the limited resources can result in different spatial distribution and accessibility. Therefore, the challenges and experiences are not the same based simply on the district attributes.
Although Shanghai is already a highly urbanized and developed city with limited space for planning of new public hospitals (Xiao et al. Citation2019), further optimization based on the spatial distribution of existing public hospitals should be prioritized. Therefore, the following discussion mainly focuses on the situation of each district given that it is the most suitable administrative level at which to take optimizing measures—small enough to analyze and compare to the actual spatial distribution of public hospitals and large enough to provide intervention via comprehensive planning.
Inadequate Public Hospitals
The shortage of public hospitals is directly reflected in the low density and low occupancy of public hospitals in some districts. For example, Qingpu and Fengxian have the lowest density and occupancy of public hospitals in Shanghai, indicating that existing public hospitals are not enough to meet the needs of patients for public health care services. Due to its small population, Chongming has the highest occupancy level of public hospitals per thousand people, but it still has inadequate public hospitals, as shown by its accessibility indicators. Low population density means it needs more balanced spatial distribution of public hospitals to improve accessibility. These three districts are on the periphery of Shanghai and away from the central urban area, so the insufficiency of public hospitals in these districts directly affects the overall accessibility level of public hospitals. Compared with other major cities in China—for example, Wuhan (0.03 place/km2 or below 0.02 place/km2 without considering specialized hospitals)—the overall density distribution of hospitals in Shanghai (0.026 place/km2) is similar or slightly better if only considering high-quality hospitals. The inadequate medical resources in suburban districts is a common phenomenon, however. This indicates that this is an issue beyond Shanghai that many other large cities in China are also facing.
Besides the inadequacy of public hospitals, some districts face the problem of the imbalanced class structure of public hospitals, which means lacking public hospitals of a particular class. Although the overall inadequacy is confined to some suburban districts, this problem is more common across Shanghai. On the one hand, third-class public hospitals are inadequate in some districts, which leads to a lack of high-quality health care services. For example, there are only two third-class public hospitals in Changning in the central urban area and only one third-class public hospital in Chongming, Qingpu, and Fengxian in the suburban area. On the other hand, second-class public hospitals are inadequate in some districts. Pudong, for example, has sixteen third-class public hospitals, accounting for roughly 20 percent of the total third-class public hospitals in Shanghai and matching its population and acreage ratio; it only has ten second-class public hospitals, however, accounting for less than 10 percent of the total amount. Although second-class hospitals can also offer basic health care services and target normal diseases, patients are more likely to go to third-class hospitals for higher level health care services because they generally have better medical resources. On the contrary, for more common treatment and services, patients are more likely to go to second-class hospitals because their services offered can service the need and are generally less time-consuming with fewer patients. In this sense, lack of second-class hospitals pushes all patients to have no choice but to turn to third-class hospitals only, leading to longer wait times for regular patients and squeezing the already scarce medical resources for severe patients.
Imbalanced Spatial Distribution of Public Hospitals
The imbalanced spatial distribution of existing public hospitals can be attributed to the rapid urban expansion of Shanghai. As mentioned earlier, more than half of the third-class public hospitals are concentrated in the central urban area, most of which were established before the turn of the century. This leads to a low level and high disparity of accessibility, sometimes even if the public hospitals are generally sufficient. This problem exists in Pudong, Baoshan, and Chongming. For example, the public hospitals in Pudong are mainly concentrated in the western and central areas, which are mainly residential land use with a large population density. In contrast, there is a large area with no public hospital in the southern area, which is mainly under agricultural land use (Shanghai Pudong New District People’s Government Citation2016). As a result, although the public hospitals are generally sufficient, the overall accessibility level for Pudong, especially its southern area, is still relatively low. Taking into consideration population density, the current locations of hospitals do match the residential land use areas. As urban land in Pudong further expands and new subdistrict centers are being planned in the southern area, such as Nanhui New Town and Shanghai’s Pilot Free Trade Zone in Lingang New Area (Shanghai Pudong New District People’s Government Citation2016), future planning for new public hospitals should address the current imbalanced distribution of public health care resources. The third-class public hospitals in Baoshan are mainly concentrated in the eastern area along the Yangtze River, which leads to an extremely low accessibility level for public hospitals in the western part of the district, given its general insufficiency of public hospitals. In terms of the spatial distribution of public hospitals in Chongming, all public hospitals are located on the main island, and there are no public hospitals on the other two smaller islands (i.e., Changxing Island and Hengsha Island), causing a marked accessibility disparity within the district. As a designated eco-island, however, the vision toward ecodevelopment and a green economy might limit the number of residential neighborhoods and intensity of development. Even though the challenge of imbalanced spatial distribution of public hospitals exists in multiple districts, each must be examined on a case-by-case basis.
In the district-level analysis of accessibility to public hospitals, there are two groups of districts that share similar population, acreage, and the number, class structure, and density of public hospitals, but the accessibility level of one district is markedly better than the other. The more balanced spatial distribution of public hospitals of the former district is the main reason for the difference. Detailed information on the two pairs was extracted from the preceding results and summarized in and and Appendix B.
Table 3 The public hospital information of Jiading and Songjiang
Table 4 The public hospital information of Jinshan and Fengxian
Conclusions
This study focuses on the spatial distribution of public hospitals in Shanghai, which is analyzed through the spatial patterns and the accessibility indicators calculated based on the improved gravity model and the travel time generated by the Baidu Web mapping API. The main results of this study are as follows: (1) Public hospitals in Shanghai, especially the third-class facilities with better health care services, are mainly concentrated in the central urban area, although the population and acreage of the central urban area are relatively small. The population density disparity is also larger in the central urban area, however. (2) The accessibility to public hospitals gradually decreases from the central urban area to the noncentral area, although there are hotspots of high accessibility in each noncentral district.
Compared with existing studies, this study closes research gaps by integrating the big data–based Web mapping API into an improved gravity model that considers the class, capacity, and nearby population’s competition for public hospitals to improve the precision of accessibility analysis without sacrificing comprehensiveness. Such methodology has been seldom seen in relevant studies, especially in the Chinese context. Also, this study follows a sensitivity analysis approach in the accessibility analysis from city level to district level. For example, in the city-level analysis, the relatively poor accessibility of Changning to its central urban district peers is not evident because patients in Changning can also go to other nearby hospitals in nearby districts. In the district-level analysis, however, its lack of high-level hospitals is clearer because the assumption is that patients in Changning can only go to hospitals in Changning. As we addressed in the Discussion, this can cause problems, such as putting extra pressure on hospitals in nearby districts and also resucing the accessibility for patients in Changning.
This study has some limitations, however, and needs to be further improvedFootnote7 in the following four ways. First, confined by the availability of the quantity and distribution of population, the smallest research unit is the subdistrict when calculating the accessibility indicator in this study, and it is hypothesized that all residents in the same subdistrict depart from the same subdistrict government office, which is not necessarily the geographic center of the subdistrict. Second, this study does not compare the results with land use patterns of Shanghai. Land use plays a great part, however, in deciding the location of public hospitals. Third, this study only includes public hospitals, but private hospitals are an important part of the health care system and an important choice for patients when seeking medical treatment. Thus, the planning of public hospitals will also take the existing private hospitals into consideration. Therefore, only focusing on the spatial distribution balance of public hospitals cannot accurately reflect the rationale of health care resource planning in Shanghai. Fourth, all of the analyses in this study are quantitative, and the situations on the ground are estimated based on points through the interpolation model with no concrete case or example for support.
Supplemental Material
Download Zip (33.7 KB)Supplemental Material
Supplemental data for this article can be accessed on the publisher’s site at: http://dx.doi.org/10.1080/00330124.2021.2000445. Data and code used in this article can be found at https://drive.google.com/drive/folders/1HgpTe-eqmfExn3kFSVGKghY-MZSSmFUX?usp=sharing. The data that support the findings of this study are openly available in figshare at https://doi.org/10.6084/m9.figshare.16544973.
Additional information
Funding
Notes on contributors
Yiling Shi
YILING SHI is an Undergraduate Student in Social Science (Urban Studies track) and Business & Finance at New York University Shanghai, Shanghai 200122, China. E-mail: [email protected]. Her professional and academic interest lies at the intersection of urban planning, economic development, and public policy in the Chinese context.
Junyan Yang
JUNYAN YANG is a Professor in the Department of Urban Planning, School of Architecture, Southeast University, Nanjing 210096, China. E-mail: [email protected]. He is also the Director of the Urban Center Research Institute at Southeast University. His research focuses on smart city big data, from basic theory to key technology to engineering practice and big data forecasting and smart city design.
Michael Keith
MICHAEL KEITH is a Professor at COMPAS, University of Oxford, Oxford OX2 6QS, UK. E-mail: [email protected]. He is the Director of the PEAK Urban Research program, Coordinator of Urban Transformations (The ESRC portfolio of investments and research on cities), and Codirector of the Oxford Programme for the Future of Cities. His research focuses on migration-related processes of urban change.
Kun Song
KUN SONG is an Assistant Professor at School of Ecological and Environmental Sciences at East China Normal University, Shanghai, China 200241. E-mail: [email protected]. His research interests include urban biodiversity conservation and ecological restoration, and urban vegetation mapping.
Ying Li
YING LI is an Assistant Professor of Practice and Codirector of the Shanghai Urban Lab at New York University Shanghai, Shanghai, China 200133. E-mail: [email protected]. Her research interests focus on the emerging challenges and opportunities in the process of urbanization. Her expertise lies in urban renovation of historical districts in Chinese cities.
ChengHe Guan
CHENGHE GUAN is an Assistant Professor of Urban Science and Policy at New York University Shanghai, Shanghai, China 200122. E-mail: [email protected] His research interests include urban big data and space–time computation on digital smart cities in a multidisciplinary context and sustainable urban planning and simulation of low-carbon cities from a human mobility perspective.
Notes
1 Shanghai is one of the four provincial-level municipalities in China. With an area of 6,340.50 km2, Shanghai is located at the mouth of the Yangtze River in eastern China. Shanghai is regarded as one of the most developed cities in China with a population of 24.24 million, a gross domestic product of 3.27 trillion RMB (US$467 billion), and an urbanization rate of 88.1 percent at the end of 2018 (Shanghai Bureau of Statistics Citation2019). The Annual Report on China’s Hospitals Competitiveness (2018–2019) provides a Top 100 chart of Chinese hospitals, in which, geographically speaking, Shanghai ranks second only to the capital city of Beijing (Zhuang et al. Citation2019). By the end of 2018, there were 364 public and private hospitals and 246 community health care centers in Shanghai (NHCPRC Citation2019). With 139,029 patient beds in total, the average patient bed number per thousand people in Shanghai was only 5.74 in 2018, below the national average of 6.03 and tied for twentieth among thirty-one provinces with Beijing. It is noteworthy that although the eastern China region included quantitatively more hospitals and had a higher portion of high-level hospitals than the middle and the western regions, the average patient bed number per thousand people in the eastern region was the lowest among the three at 5.60 (NHCPRC Citation2019). Therefore, Shanghai is a fair representative of the eastern provinces facing the allocation problem of medical resources to the mass population. This study covers all of the 166 public hospitals located in Shanghai, including all of the branch public hospitals. The Evaluation Methods for Medical Institutions of China categorized all health institutions into third-, second-, and first-class mainly on the basis of the health care service level and the scale of the hospital, with third-class the best and first-class the least; each class is further classified into three subclasses—A, B, and C—with A the best and C the least (NHCPRC Citation2018). In the public health system of Shanghai, there are only five available classes. All public hospitals are either third-class (3A or 3B) or second-class (2A or 2B). The first-class public health institutions, with no further subclassification, are community health care centers that are not classified as public hospitals by Shanghai Regional Health Planning (2011–2020; SMPG 2010). The location, number of patient beds, and class of the public hospitals are obtained from the Shanghai Healthcare Service Searching System Web site sponsored by the Shanghai Municipal Health Commission (see http://jg.soyi.sh.cn/). Table B.2 provides a summary of the public hospitals. For branch hospitals without class and patient bed data, the class is set the same as the corresponding parent hospital, and the patient bed data are obtained from the official Web site of the corresponding parent hospital. Among the 166 public hospitals, 58 are 3A public hospitals, 16 are 3B public hospitals, 65 are 2A public hospitals, and 27 are 2B public hospitals.
2 When a route is requested between a starting point and a destination in Baidu Map, the system can come up with an ideal route, and the time taken for this route based on real-time traffic conditions. To eliminate all possible errors, prewritten code (Code S2) was adopted in Python that (1) inserts a Microsoft Excel file of all route requests with the coordinates of the starting position and the destination (coordinates are generated by the geocoding module of Baidu’s Web mapping API [Code S1]), (2) sends all of the requests to the route planning module of Baidu’s Web mapping API and runs, and (3) downloads all of the resulting data and saves them in a new Excel file.
3 The survey shows that third-class public hospitals are generally larger in scale and better in health care provision, so they can attract potential patients despite the distance. Second-level public hospitals are generally smaller in scale and limited in health care provision, so they are not attractive to distant patients and the average maximum time patients would like to spend traveling is thirty minutes. The accessibility indicators of all subdistricts are imported into ArcGIS and hierarchically displayed on the maps with the inverse distance weighting (IDW) analysis. IDW is a deterministic method for multivariate interpolation with some known points and works by assigning weighted values to unknown points based on available values at the known points. IDW assumes that points decrease in influence with distance from the measured location. The higher the accessibility indicator, the better accessibility level of the area.
4 The average public hospital density of Shanghai is 0.0262/km2. The density in the central urban area is more than ten times higher than the Shanghai average, whereas the density in the noncentral area is half of the Shanghai average. Among the central districts, Huangpu has the highest density (0.6843/km2) and Putuo has the lowest (0.1277/km2). Among the suburban districts, Baoshan has the highest density (0.0369/km2) and Chongming the lowest (0.0051/km2). The average occupancy of public hospitals per thousand people in Shanghai is 0.0068. Huangpu has the highest occupancy level of (0.0214) and Qingpu has the lowest (0.0033).
5 The third-class public hospitals with wide coverage also account for a relatively high proportion in these districts. The overlapping of multiple wide coverage areas brings about the spillover effect of high-quality public health care services, effectively improving the accessibility level. As a result, even though the spatial distribution of public hospitals is not well balanced, the accessibility indicator in more than half of the area exceeds 350, the threshold for high accessibility, in these three districts. The overall average of central urban districts is 379, higher than 350, the floor boundary of the highest section. Huangpu District has the highest accessibility level and is at the center of the central urban area, but other central urban districts surrounding it generally present a descending pattern of accessibility. The accessibility levels of Hongkou and Jing’an are in the middle-high section with indicator values mainly between 250 and 350. In these two districts, the accessibility level gradually decreases from the area close to the city center to the area far away from the city center. Although the number and class composition of public hospitals in these two districts are different, they both concentrate in the area closer to the city center, leading to a significant accessibility disparity. Putuo and Changning are the two districts with the lowest accessibility level in the central urban area with indicator values mainly in the middle range (150–250). The numbers of third-class public hospitals in these two districts are the smallest among the central urban area, causing the sparse distribution patterns of the public hospitals. Consequently, the overall accessibility level is low. On the other hand, the disparity is high. There are some areas with very low accessibility levels in the low-middle section (75–150) far away from the city center, such as the northwest of Putuo and the northwest and the southwest of Changning.
6 Minhang, Jiading, Songjiang, and Jinshan have relatively higher accessibility levels within the suburban area, which is mainly in the middle section (150–250). In Minhang, the total number of third-class public hospitals is the highest in the suburban area, and the spatial distribution of public hospitals is relatively balanced. Although the number of public hospitals is limited in Jiading, Songjiang, and Jinshan, they exhibit different spatial arrangements of public hospitals. For example, the public hospitals in Jiading and Songjiang are located in the geographic center so that the accessibility levels in the districts are relatively balanced and gradually decrease from the center to the periphery. Moreover, Jiading allocates some public hospitals in the western part, the farthest away from the city center, to alleviate the imbalance of accessibility. Jinshan is in a flat shape in the east–west direction, and the public hospitals are distributed along the border of the district. Therefore, the accessibility level of Jinshan has very low disparity. Fengxian, Baoshan, Qingpu, and Chongming have a low accessibility level, which is mainly in the low and low-middle range (9.7–150). The limited third-class public hospitals lead to the overall low level of accessibility in Baoshan, and the concentration of public hospitals in the central and the southern sections causes extremely low accessibility level in the northern area. With large geographic areas to cover, third-class public hospitals in Fengxian, Qingpu, and Chongming are inadequate, and the spatial distribution of the existing public hospitals is not balanced, causing low accessibility levels and high disparity in these districts.
7 In future studies, the smallest research unit can be set at the community level, the administrative unit one level smaller than the subdistrict. The quantity and distribution of population at the community level can further improve the accuracy of density distribution and accessibility analysis. Also, land use will be included, not only for a more accurate and comprehensive analysis of the public hospital spatial distribution pattern but also as a crucial factor to offer optimizing suggestions that are more feasible and practical. Moreover, future studies should include private hospitals as well as community services in the study scope and offer more comprehensive suggestions for optimizing the health care system. Finally, a comparison between the estimated situation and the actual situation should be added to ensure the accuracy of models. Qualitative research methods such as interviews and field trips can be supplemented to validate the results and reflect user experiences. Also, we plan to test sensitivity of different weighting systems, apply location-based digital devices to reveal temporal variation of accessibility to public hospitals, and consider the emergent telemedicine and digital health care delivery online services to provide a more comprehensive evaluation.
Related Research Data
Literature Cited
- Alam, F., V. Chongsuvivatwong, H. Mahmud, and P. Sen Gupta. 2013. Comparison of accessibility among vision-impaired patients visiting mobile and stationary hospitals in rural Bangladesh. Journal of Health, Population and Nutrition 31:223–30.
- Braveman, P. 2006. Health disparities and health equity: Concepts and measurement. Annual Review of Public Health 27:167–94. doi: https://doi.org/10.1146/annurev.publhealth.27.021405.102103.
- Buchmueller, T. C., M. Jacobson, and C. Wold. 2006. How far to the hospital? The effect of hospital closures on access to care. Journal of Health Economics 25 (4):740–61.
- Cheng, G., X. Zeng, L. Duan, X. Lu, H. Sun, T. Jiang, and Y. Li. 2016. Spatial difference analysis for accessibility to high level hospitals based on travel time in Shenzhen, China. Habitat International 53:485–94. doi: https://doi.org/10.1016/j.habitatint.2015.12.023.
- Cheng, M., and Y. Lian. 2018. Spatial accessibility of urban medical facilities based on improved potential model: A case study of Yangpu District in Shanghai. Progress in Geography 37:266–75. doi: https://doi.org/10.18306/dlkxjz.2018.02.009.
- Dalvi, M. Q., and K. M. Martin. 1976. The measurement of accessibility: Some preliminary results. Transportation 5 (1):17–42. doi: https://doi.org/10.1007/BF00165245.
- Daniels, N. 1983. Health care needs and distributive justice. In In search of equity: Health needs and the health care system, ed. R. Bayer, A. L. Caplan and N. Daniels, 1–41. Boston: Springer.
- Daniels, N. 2001. Justice, health, and healthcare. American Journal of Bioethics 1 (2):2–16. doi: https://doi.org/10.1162/152651601300168834.
- De Mello-Sampayo, F. A. 2016. Spatial analysis of mental healthcare in Texas. Spatial Economic Analysis 11 (2):152–75. doi: https://doi.org/10.1080/17421772.2016.1102959.
- Fransen, K., T. Neutens, P. De Maeyer, and G. Deruyter. 2015. A commuter-based two-step floating catchment area method for measuring spatial accessibility of daycare centers. Health & Place 32:65–73.
- Guan, C. 2019. Spatial distribution of high-rise buildings and its relationship to public transit development in Shanghai. Transport Policy 81:371–80. doi: https://doi.org/10.1016/j.tranpol.2018.09.004.
- Guan, C., J. Song, M. Keith, B. Zhang, Y. Akiyama, L. Da, R. Shibasaki, and T. Sato. 2021. Seasonal variations of park visitor volume and park service area in Tokyo: A mixed-method approach combining big data and field observations. Urban Forestry & Urban Greening 58:126973. doi: https://doi.org/10.1016/j.ufug.2020.126973.
- Hou, S., and H. Jiang. 2014. An analysis on accessibility of hospitals in Changchun based on urban public transportation. Geographical Research 33:915–25. doi: https://doi.org/10.11821/dlyj201405010.
- Jiao, J., A. Moudon, J. Ulmer, P. Hurvitz, and A. Drewnowski. 2012. How to identify food deserts: Measuring physical and economic access to supermarkets in King County, Washington. American Journal of Public Health 102 (10):e32–e39. doi: https://doi.org/10.2105/AJPH.2012.300675.
- Kanuganti, S., A. K. Sarkar, and A. P. Singh. 2016. Evaluation of access to health care in rural areas using enhanced two-step floating catchment area (E2SFCA) method. Journal of Transport Geography 56:45–52. doi: https://doi.org/10.1016/j.jtrangeo.2016.08.011.
- Liu, L., and L. Wang. 2020. A study on spatial distribution of fever clinics in Shanghai during the epidemic of COVID-19 pneumonia. Shanghai Urban Planning Review 2:87–93.
- Liu, S., and S. M. Griffiths. 2011. From economic development to public health improvement: China faces equity challenges. Public Health 125 (10):669–74.
- Luo, W., and Y. Qi. 2009. An enhanced two-step floating catchment area (E2SFCA) method for measuring spatial accessibility to primary care physicians. Health & Place 15 (4):1100–1107. doi: https://doi.org/10.1016/j.healthplace.2009.06.002.
- Mansour, S. 2016. Spatial analysis of public health facilities in Riyadh governorate, Saudi Arabia: A GIS-based study to assess geographic variations of service provision and accessibility. Geo-Spatial Information Science 19 (1):26–38. doi: https://doi.org/10.1080/10095020.2016.1151205.
- McGrail, M. R., and J. S. Humphreys. 2009. Measuring spatial accessibility to primary care in rural areas: Improving the effectiveness of the two-step floating catchment area method. Applied Geography 29 (4):533–41. doi: https://doi.org/10.1016/j.apgeog.2008.12.003.
- National Health Commission of the People’s Republic of China. 2018. The evaluation methods for medical institutions (2018 edition). Accessed August 25, 2020. http://www.nhc.gov.cn/fzs/s3576/201808/0415d028c18a46c4a316d8339edcdf44.shtml.
- National Health Commission of the People’s Republic of China. 2019. The 2019 China health statistics yearbook. Beijing: Peking Union Medical College Press. https://cdi.cnki.net/Titles/SingleNJ?NJCode=N2019030282.
- National Health Commission of the People’s Republic of China. 2020. Notice on the comprehensive pilot reform of county-level public hospitals. Accessed August 25, 2020. http://www.nhc.gov.cn/wjw/gfxwj/201304/f48adade90e243af8cd5f9d1bd55351f.shtml.
- Ngui, A. N., and A. Vanasse. 2012. Assessing spatial accessibility to mental health facilities in an urban environment. Spatial and Spatio-Temporal Epidemiology 3 (3):195–203. doi: https://doi.org/10.1016/j.sste.2011.11.001.
- Office of Shanghai Chronicles (OSC). 2020. The 2019 Shanghai almanac. Accessed August 25, 2020. http://www.shtong.gov.cn/dfz_web/DFZ/Info?idnode=258402&tableName=userobject1a&id=437531.
- Ouyang, W., B. Wang, L. Tian, and X. Niu. 2017. Spatial deprivation of urban public services in migrant enclaves under the context of a rapidly urbanizing China: An evaluation based on suburban Shanghai. Cities 60:436–45. doi: https://doi.org/10.1016/j.cities.2016.06.004.
- Pan, J., H. Zhao, X. Wang, and X. Shi. 2016. Assessing spatial access to public and private hospitals in Sichuan, China: The influence of the private sector on the healthcare geography in China. Social Science & Medicine 170:35–45. doi: https://doi.org/10.1016/j.socscimed.2016.09.042.
- Reshadat, S., A. Zangeneh, S. Saeidi, R. Teimouri, and T. Yigitcanlar. 2019. Measures of spatial accessibility to health centers: Investigating urban and rural disparities in Kermanshah, Iran. Journal of Public Health 27 (4):519–29. doi: https://doi.org/10.1007/s10389-018-0966-9.
- Shanghai Bureau of Statistics. 2019. The 2018 Shanghai national economy and social development statistical report. Accessed August 25, 2020. http://www.tjj.sh.gov.cn/tjgb/20191115/0014-1003219.html.
- Shanghai Municipal People’s Government. 2009. The key implementation plan of deepening the medical and health system reform in Shanghai. Accessed August 25, 2020. http://www.shanghai.gov.cn/nw2/nw2314/nw2319/nw2404/nw26256/nw26257/u26aw27894.html.
- Shanghai Municipal People’s Government. 2010. Shanghai regional health planning (2011–2020). Accessed August 25, 2020. http://www.shanghai.gov.cn/nw2/nw2314/nw2319/nw10800/nw11407/nw30984/u26aw34501.html.
- Shanghai Municipal People’s Government. 2019. Measures of Shanghai municipality on the basic medical insurance on employees. Accessed August 25, 2020. http://www.shanghai.gov.cn/nw2/nw2314/nw2319/nw2407/nw31294/u26aw37349.html.
- Shanghai Pudong New District People’s Government. 2016. The comprehensive plan and general land-use plan of Pudong New Area, Shanghai, 2017–2035. Accessed August 25, 2020. http://www.pudong.gov.cn/shpd/news/20181205/006002_f920401d-e3bb-44b2-8505-3d497788475a.htm.
- Socharoentum, M., and H. A. Karimi. 2015. A comparative analysis of routes generated by web mapping APIs. Cartography and Geographic Information Science 42 (1):33–43. doi: https://doi.org/10.1080/15230406.2014.976656.
- The State Council of the People’s Republic of China. 2009. Opinions on deepening the reform of medical and health system. Accessed August 25, 2020. http://www.gov.cn/gongbao/content/2009/content_1284372.htm.
- Tan, J., and C. Guan. 2021. Are people happier in locations of high property value? Spatial temporal analytics of activity frequency, public sentiment and housing price using Twitter data. Applied Geography 132:102474. doi: https://doi.org/10.1016/j.apgeog.2021.102474.
- Tao, Z., Z. Yao, H. Kong, F. Duan, and G. Li. 2018. Spatial accessibility to healthcare services in Shenzhen, China: Improving the multi-modal two-step floating catchment area method by estimating travel time via online map APIs. BMC Health Services Research 18 (1):345.
- Weibull, J. W. 1976. An axiomatic approach to the measurement of accessibility. Regional Science and Urban Economics 6 (4):357–79. doi: https://doi.org/10.1016/0166-0462(76)90031-4.
- World Health Organization. 2017. Health is a fundamental human right. Accessed August 25, 2020. https://www.who.int/mediacentre/news/statements/fundamental-human-right/en/.
- World Health Organization. 2020. Increasing access to health workers in remote and rural areas through improved retention: Global policy recommendations. Accessed August 25, 2020. https://www.who.int/hrh/retention/guidelines/en/.
- Xiao, R., X. Huang, W. Yu, M. Lin, and Z. Zhang. 2019. Interaction relationship between build-up land expansion and demographic–social–economic urbanization in Shanghai–Hangzhou Bay metropolitan region of eastern China. Photogrammetric Engineering & Remote Sensing 85 (3):231–40. doi: https://doi.org/10.14358/PERS.85.3.231.
- Yan, N. 2013. Development of Western hospitals in Shanghai in modern times: Study of hospitals affiliated to the municipal council. Europe EMC 43:39–45.
- Yang, N., S. Chen, W. Hu, Z. Wu, and Y. Chao. 2016. Spatial distribution balance analysis of hospitals in Wuhan. International Journal of Environmental Research and Public Health 13 (10):971. doi: https://doi.org/10.3390/ijerph13100971.
- Yao, Z., J. Yang, J. Liu, M. Keith, and C. Guan. 2021. Comparing Tweet sentiment in megacities using machine learning techniques: In the midst of COVID-19. Cities 116:103273. doi: https://doi.org/10.1016/j.cities.2021.103273.
- Yiannakoulias, N., W. Bland, and L. W. Svenson. 2013. Estimating the effect of turn penalties and traffic congestion on measuring spatial accessibility to primary health care. Applied Geography 39:172–82. doi: https://doi.org/10.1016/j.apgeog.2012.12.003.
- Yin, C., Q. He, Y. Liu, W. Chen, and Y. Gao. 2018. Inequality of public health and its role in spatial accessibility to medical facilities in China. Applied Geography 92:50–62. doi: https://doi.org/10.1016/j.apgeog.2018.01.011.
- Yin, P. 2019. Urban–rural inequalities in spatial accessibility to prenatal care: A GIS analysis of Georgia, USA, 2000–2010. GeoJournal 84 (3):671–83. doi: https://doi.org/10.1007/s10708-018-9884-1.
- Zhang, S., X. Song, Y. Wei, and W. Deng. 2019. Spatial equity of multilevel healthcare in the metropolis of Chengdu, China: A new assessment approach. International Journal of Environmental Research and Public Health 16 (3):493. doi: https://doi.org/10.3390/ijerph16030493.
- Zhang, Y., W. Li, H. Deng, and Y. Li. 2020. Evaluation of public transport-based accessibility to health facilities considering spatial heterogeneity. Journal of Advanced Transportation, 7645153 https://doi.org/https://doi.org/10.1155/2020/7645153.
- Zheng, Z., H. Xia, S. Ambinakudige, Y. Qin, Y. Li, Z. Xie, L. Zhang, and H. Gu. 2019. Spatial accessibility to hospitals based on web mapping API: An empirical study in Kaifeng, China. Sustainability 11 (4):1160–73. doi: https://doi.org/10.3390/su11041160.
- Zhu, L., S. Zhong, W. Tu, J. Zheng, S. He, J. Bao, and C. Huang. 2019. Assessing spatial accessibility to medical resources at the community level in Shenzhen, China. International Journal of Environmental Research and Public Health 16 (2):242. doi: https://doi.org/10.3390/ijerph16020242.
- Zhuang, Y., X. Liao, X. Wang, and S. Yao. 2019. The annual report on China’s hospitals competitiveness (2018–2019). Beijing: Social Science Academic Press (China).
Appendix A:
The District-Level Accessibility to Public Hospitals of Shanghai
Figure A1 Accessibility of Jing’an, Yangpu, Hongkou, Putuo, Changning, and Pudong.
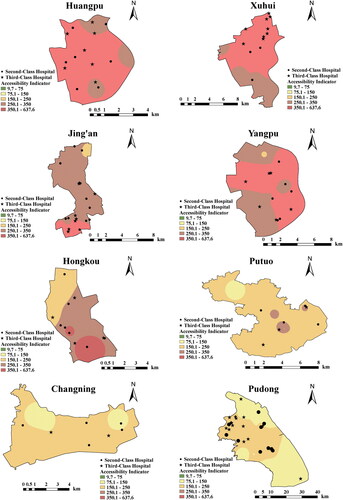
Figure A2 Accessibility of Jiading, Minhang, Songjiang, Jinshan, Fengxian, Baoshan, Qingpu, and Chongming.
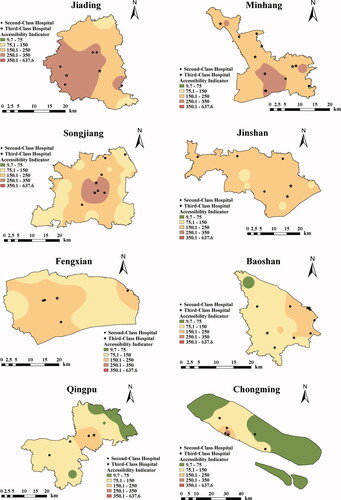
The first group is Jiading and Songjiang. Their occupancy of public hospitals per thousand people values are similar, but the accessibility level of Jiading is higher than that of Songjiang. In addition to deploying public hospitals in the geographical center of the district like Songjiang, Jiading deploys three public hospitals in the southwest area with a large population. Anting Town in southwestern Jiading has the second highest population density of roughly 1,213 people/km2 among the subdistricts on the periphery of Jiading. In Jiading, this area is the farthest away from the city center and thus has the greatest demand for accessible public hospitals in the area. Strengthening the accessibility level of this area can effectively reduce the accessibility disparity and thus improve the average level of accessibility.
The second group is Jinshan and Fengxian. With a similar population, the occupancy of public hospitals per thousand people in Jinshan is higher than that in Fengxian, and the accessibility level of Jinshan is also higher than that of Fengxian. Jinshan decides the deployment of public hospitals based on the geographic shape of the district instead of the common strategy that deploys public hospitals in the geographic center. The geographic shape of Jinshan is narrow from east to west and its eastern area is comparatively wider from north to south. Based on this shape, the public hospitals in Jinshan are basically evenly deployed along the border, with three public hospitals on the north border, east border, and northwest–southeast border if double-counted. There is no point in the district that is significantly farther away from public hospitals than other points. Therefore, the average accessibility level of Jinshan is high with limited disparity.
Appendix B:
Statistical Information
Table B.1 Patient beds per 1,000 population in Mainland China