
 ?Mathematical formulae have been encoded as MathML and are displayed in this HTML version using MathJax in order to improve their display. Uncheck the box to turn MathJax off. This feature requires Javascript. Click on a formula to zoom.
Abstract
Air tour management plans for U.S. national park units are developed by the Federal Aviation Administration (FAA) and the National Park Service (NPS). The FAA recommends pilots fly higher than 2,000 feet above ground level (AGL) over parks, wildlife refuges, and areas with wilderness characteristics. Management of air tours is important for mitigating visual and noise impacts. Understanding air tour travel patterns has been problematic because objective location data have been difficult to obtain. A newer technology, Automatic Dependent Surveillance–Broadcast (ADS–B), can be used to accurately track overflights. Prior ADS–B studies of air tours conducted limited analysis with respect to altitude characteristics. Thus, the purpose of this study was to determine how overflights spatially vary across altitudes and determine altitude trends for primary flight corridors. Results suggest overflights trend along the east side of the park and 74.59 percent of waypoints within a 0.5-mile buffer around the park boundary had altitudes less than 2,000 feet above ground level (AGL). Results revealed that as altitude increased, overflight density decreased. Using hot spot clustering analysis, overflight lateral pattern differences were determined for altitudes lower than 2,000 feet AGL compared to altitudes higher than 2,000 feet AGL. This study also identified one primary flight corridor with average altitudes mostly below 2,000 feet AGL. Managers can use these results to inform the development of air tour management plans and monitor compliance.
美国联邦航空管理局(Federal Aviation Administration, FAA)和国家公园管理局制定了美国国家公园的航空旅行管理规划。FAA建议, 在公园、野生动物保护区和荒漠地区的飞行高度应高于地面(Above Ground Level, AGL)2,000英尺。航空旅行管理对降低视觉和噪音影响非常重要。由于难以获取客观的位置数据, 我们对航空旅行模式的理解一直有缺陷。自动相关监控广播(Automatic Dependent Surveillance-Broadcast, ADS-B)这种新技术可用于精确地跟踪飞越。ADS-B航空旅行的研究仅仅开展了对高度特征的少量分析。因此, 本研究旨在确定飞越高度的空间变化, 确定主要飞行走廊的高度趋势。结果揭示了沿公园东侧的飞越趋势, 公园周围0.5英里内74.59%航路点的高度低于2,000英尺AGL。随着高度的增加, 飞越密度降低。热点聚类分析确定了低于和高于2,000英尺AGL的飞越横向模式差异。确定了一条主要飞行走廊, 其平均高度低于2,000英尺AGL。这些结果有助于管理人员制定和监管空中旅行管理规划。
Los planes de manejo de los desplazamientos aéreos en las unidades de parques nacionales de los EE.UU. son función de la Administración Federal de la Aviación (FAA) y del Servicio de Parques Nacionales (NPS). La FAA recomienda a los pilotos volar por encima de los 2.000 pies sobre el nivel del suelo (AGL) sobre los parques, los refugios de vida silvestre y las áreas con características silvestres. El manejo controlado de los desplazamientos aéreos es importante para mitigar los impactos visuales y acústicos. Entender los patrones de los recorridos de viaje aéreo ha sido problemático por la dificultad de obtener datos objetivos de localización. Una tecnología más reciente, la Vigilancia Dependiente Automática–Difundida (ADS–B), puede usarse para rastrear sobrevuelos con precisión. Los estudios anteriores de ADS–B sobre recorridos aéreos realizaron un análisis limitado respecto a las características de altitud. Por eso, el propósito de este estudio fue determinar cómo varía la espacialidad de los sobrevuelos a través de las altitudes y determinar las tendencias en cuanto a altitud para los corredores primarios de vuelo. Los resultados sugieren la tendencia de los sobrevuelos a lo largo del borde oriental del parque, y que el 74.59 de los puntos de referencia dentro de una zona de amortiguación de 0.5 millas alrededor del borde del parque tenían altitudes inferiores a 2.000 pies sobre el nivel del suelo (AGL). El estudio también identificó un corredor primario de vuelo con altitudes medias principalmente por debajo de los 2.000 pies AGL. Los encargados del manejo pueden usar estos resultados para informar sobre el desarrollo de los planes de manejo de los viajes aéreos y el monitoreo de su cumplimiento.
In 1916, President Woodrow Wilson signed the Organic Act, which created the U.S. National Park Service (NPS Citation2018b). The NPS was established as a federal government bureau in the Department of the Interior and was charged with protecting national parks and monuments. Only three years later, the first recorded air tour occurred at Grand Canyon National Park in 1919 (NPS Citation2021b). Through the years, air tours over NPS units became increasingly popular and presently there are estimated to be more than 150,000 annual air tours across national park units in the United States (Beeco and Joyce Citation2019).
In 1987, Congress passed the National Parks Overflights Act (Public Law 100-91), which required the Federal Aviation Administration (FAA), the NPS, and other agencies to conduct studies to determine the severity of issues related to aircraft overflights and report findings to Congress (National Parks Overflight Act 1987). In a 1995 report to Congress, it was concluded that overflights produce impacts to both visitors and park resources (NPS Citation1995). The FAA has sole jurisdiction to regulate and manage airspace over the lands and waters of the United States, meaning the NPS does not have the authority to manage air tours even when directly over NPS lands. To address these issues, the National Parks Air Tour Management Act (NPATMA) was passed in 2000 (49 U.S. Code § 40128), requiring the FAA and the NPS to collaboratively create air tour management plans, or agreements, to manage air tours at national park units with more than fifty annual air tours and for air tour operators to report their number of air tours on a quarterly and annual basis. NPATMA only applies to air tours within a half-mile of a park boundary and excludes flights over Grand Canyon National Park (regulated by Public Law 100-91) and all Alaska park units. During 2019, the latest year reporting data are available, seventy-eight NPS units received a total of 48,760 reported air tours that are governed by NPATMA (Lignell Citation2020).
Despite the requirements of NPATMA, the FAA and NPS have made little progress on developing plans or agreements for air tours over NPS units. This management issue is evident from the recent writ of mandamus lawsuit the FAA and NPS lost for not developing management plans for air tours at twenty-three NPS units (Public Employees for Environmental Responsibility, 957 F.3d 267 [D.C. Cir. 2020]). As the NPS and FAA work to create air tour management plans, aircraft tracking information can be used to better understand current air tour operations and can be used in the future to ensure compliance with forthcoming air tour management plans. Operators are required to report air tour numbers. Accurate tracking is necessary, however, to understand routes and altitudes of air tours that fly above national park units. This information can help managers target locations and identify strategies for protecting the acoustic environment.
Congress also mandated protection of acoustic environments at national parks (Lynch, Joyce, and Fristrup Citation2011). This mandate aligns with the mission of the NPS to conserve park unit resources and provide public enjoyment while leaving parks unimpaired for future generations (Department of Justice Citation2015). Conservation is the NPS’s predominant duty (Department of Justice Citation2015; Jones, Shipley, and Ul-Hasan Citation2017), which includes protecting park units from anthropogenic noise. Accordingly, the NPS has identified anthropogenic noise sources and has conducted sound level measurements at hundreds of sites. Despite national parks having some of the most pristine soundscapes, anthropogenic noise widely infiltrates these natural settings, with aircraft constituting one of the most ubiquitous noise sources (Buxton et al. Citation2019).
Aircraft Noise
Noise refers to undesired or unwanted sounds (Pilcher, Newman, and Manning Citation2009). Overflight noise can degrade the acoustic environment (Beeco, Joyce, and Anderson Citation2020), which has been shown to have adverse experiential effects for visitors (McDonald, Baumgarten, and Iachan Citation1995). Buxton et al. (Citation2019) analyzed thousands of hours of acoustic recordings at national park units and found aircraft noise was spatially extensive. Rapoza, Sudderth, and Lewis (Citation2015) evaluated the relationship between aircraft noise exposure and national park visitor experiences by distributing 4,600 surveys at seven backcountry sites in four national parks simultaneously with taking sound measurements and found that aircraft noise annoyance in national parks increases with increasing aircraft noise level. Research at Hawai‘i Volcanoes National Park (HAVO) also determined that visitors found it annoying to hear overflight noise (Lawson et al. Citation2007). These findings are concerning because research shows that natural sounds improve health, increase positive affect, and lower stress and annoyance (Buxton et al. Citation2021). Yet, only 11.3 percent of national parks have low audibility of anthropogenic sounds (i.e., < 25 percent of time; Buxton et al. Citation2021).
Altitude and lateral standoff requirements are commonly used strategies to reduce aircraft noise to protect specific noise-sensitive sites, such as critical habitat or cultural resources. In an attempt to mitigate aircraft noise heard from the ground at noise-sensitive natural settings, the FAA recommends pilots fly above 2,000 feet above ground level (AGL) over parks, wildlife refuges, and areas with wilderness characteristics; but this is a recommendation, not a regulation (FAA Citation2004). An area is considered noise-sensitive if noise interferes with regular activities where a quiet setting is a feature (FAA Citation2004). Recently, proposed draft air tour management plans for several national park units have been written and include both altitude and lateral standoff stipulations (via specifically approved routes; NPS Citation2021a, Citation2021c). Lateral stipulations are also used by national and state-level governance as a protection measure against noise (U.S. Fish and Wildlife Service Citation2007; Colorado Division of Wildlife Citation2008).
Aircraft Tracking
A newer technology, Automatic Dependent Surveillance–Broadcast (ADS–B), can be used to understand aircraft travel patterns (Beeco and Joyce Citation2019). The ADS–B system provides operators the ability to continuously and precisely navigate crowded airspace (Habler and Shabtai Citation2018) and is effective in remote areas that lack radar coverage, such as areas within the Gulf of Mexico and Alaska (FAA Citation2020a). Benefits include real-time precision, shared situational awareness, visualization of where other aircraft are located, exact locations of hazardous weather and terrain, and current flight information (e.g., temporary flight restrictions; FAA Citation2020a). As of 1 January 2020, the FAA requires all aircraft that enter designated airspace to have ADS–B technology (14 Code of Federal Regulations [CFR] § 91.225 and 14 CFR § 91.227; see also Beeco and Joyce Citation2019 for details about designated airspace).
The ADS–B system derives its position from the navigation satellite system and then broadcasts a radio signal, twice per second (Zha, Tian, and Lin Citation2020), that other aircraft receive for monitoring purposes, which improves airspace safety and air traffic efficiency (FAA Citation2018). Broadcasted information includes position, velocity, and aircraft identification (Duong et al. Citation2019). These data are unencrypted, publicly accessible, and can be collected using a terrestrial data logger (Beeco and Joyce Citation2019). Prior studies have used ADS–B data loggers to record latitude, longitude, altitude, and unique identification code (Beeco and Joyce Citation2019; Beeco, Joyce, and Anderson Citation2020; Peterson et al. Citation2022). The unique identification code can be connected to the FAA Releasable Database, which provides additional metadata, such as aircraft owner and registration number. A terrestrial data logger with an expansive skyward exposure is effective at collecting voluminous ADS–B data that include millions of waypoints (Beeco, Joyce, and Anderson Citation2020).
Thus far, three studies have been published using ADS–B data to track overflights above NPS units (Beeco and Joyce Citation2019; Beeco, Joyce, and Anderson Citation2020; Peterson et al. Citation2022). The first study was a proof-of-concept study that explored the feasibility of collecting and analyzing ADS–B data for accurately tracking overflights (Beeco and Joyce Citation2019). The findings of that study confirmed the efficacy of using ADS–B data to understand overflight routes, altitudes, types of aircraft, and aircraft owners. Although this study successfully demonstrated collection of ADS–B data and mapped aircraft routes, it did not take into consideration how routes vary across altitudes. The second study was conducted at Haleakalā National Park and focused on overflight compliance (Beeco, Joyce, and Anderson Citation2020). The findings of this study found that overflight compliance was generally adhered to for lateral offsets but compliance for minimal altitude requirements was generally lacking. The third study focused on time series analysis of the ADS–B data over HAVO, but detailed analysis of flight altitudes was not included.
Study Objectives
The three prior studies that used ADS–B data to track overflights above NPS units mostly focused on two locational dimensions (x,y) rather than three dimensions (x,y,z). When altitude was considered in Beeco, Joyce, and Anderson (Citation2020), the analysis was binary, focusing simply on whether overflights were above or below a specific threshold of 300 feet AGL. To fully understand overflight travel patterns, a three-dimensional perspective is needed. Therefore, the purpose of this study was to determine how overflights vary across altitudes, determine altitude characteristics for major flight corridors, and understand which aircraft owners typically fly at low altitudes. Specifically, the following research questions guided this study:
How does overflight density vary across altitudes?
What are the overflight lateral patterns across altitudes?
What are the major overflight corridors and their altitude characteristics?
Which aircraft owners most frequently fly lower than 2,000 feet AGL (this is below the FAA’s recommendation for flights over parks, wildlife refuges, and areas with wilderness character)?
Methods
Study Site
The study site was HAVO, which is located on the island of Hawai‘i. HAVO encompasses 335,259 acres and is comprised of 130,790 acres of designated wilderness protected under the provisions of the Wilderness Act of 1964 (Public Law 88-577, 16 U.S.C. 1131–1136). Such designated wilderness areas are managed to provide visitors with “outstanding opportunities for solitude or a primitive and unconfined type of recreation” (Public Law 88-577, 16 U.S.C. 1131–1136). HAVO is also designated as a World Heritage Site deemed by the United Nations Educational, Scientific and Cultural Organization (UNESCO) to possess “outstanding universal value to humanity” (UNESCO Citation2022). Finally, the entirety of HAVO is also an important cultural place to Native Hawaiians due to the diversity of cultural resources found within the park boundary that expand across the entire park landscape, the Native Hawaiian Traditional Cultural Properties, and the many sacred areas that continue to be actively used by cultural practitioners.
The park features two active volcanoes (Mauna Loa and Kīlauea), volcanic craters, lava flows, rift zones, approximately 136 miles of hiking trails, cabins, campgrounds, wilderness areas, and expansive vistas. A notable attraction for air tours is Kīlauea Volcano, which continuously erupted from 1983 to 2018, then from 20 December 2020 to 23 May 2021, and began erupting again on 29 September 2021 (U.S. Geological Survey Citation2021a). Along the eastern rift zone of Kīlauea Volcano is the Pu‘u‘ō‘ō volcanic cone and crater, which had the longest rift zone eruption at Kīlauea (U.S. Geological Survey Citation2021b). The researchers chose HAVO as the study site because it is a popular destination for both air tour visitors and terrestrial visitors and is currently in the process of establishing an air tour management plan (FAA Citation2020b).
Data Collection
ADS–B data were collected using a terrestrial data logger positioned with an unimpeded and expansive skyward exposure that was deployed on the summit of Kīlauea (19.421, −155.288 decimal degrees). Data were collected from 1 November to 18 December 2019, included twenty-six days of data, and represented a noneruptive period in which there were no air tour limitations caused by volcanic activity. Generally, air tour reporting data suggest air tour activity is sustained year-round at HAVO, with the month of November and early December representing median activity. ADS–B signals were recorded as text files comprised of waypoints.
The design of the logger included a uAvionix PingRX ADS–B receiver, Arduino-based microcontroller, RTC and microSD card logging shield, DC-DC regulator, and PVC housing. The uAvionix Ping RX receiver is dual-band, collecting both 978-MHz and 1090-MHz radio signals. The total cost to build a receiver unit was approximately $300. This design represents an improvement over prior loggers (Beeco and Joyce Citation2019; Beeco, Joyce, and Anderson Citation2020; Peterson et al. Citation2022).
Data Cleaning
Using R, data were cleaned and screened. To prevent inclusion of high-altitude commercial air traffic, ADS–B data higher than 16,000 feet above mean sea level (MSL) were excluded. This altitude was chosen because the highest peak on the Big Island is Mauna Kea at 13,803 feet. Having a cutoff 2,000 feet above the highest peak seemed like a reasonable but conservative cutoff. Overflights were then segmented by unique identifiers, which were connected to the FAA Releasable Database to obtain overflight metadata (FAA Citation2021). Overflight events were further segmented using a fifteen-minute interval (in conjunction with unique identifiers) to differentiate multiple flights per day by the same aircraft. If the ADS–B signal was not detected for fifteen minutes or longer, then that aircraft likely left airspace over the park to return to an airport or helipad. Each segment was then considered a single overflight. To manage the voluminous data set, waypoints were prepped for shapefile creation by grouping each overflight into singular flight features that contained multipart features of waypoints.
Using ArcGIS Pro 2.9.2, data were cleaned of low-level flights determined to be irregular in nature and clearly not air tours. For example, civil patrol flights (e.g., Hawai‘i County Fire Department) and survey flights were removed from further analysis due to their known purpose (not air tours) and irregular travel patterns (survey flights). Waypoints were then converted into single-part features using the Multipart to Singlepart tool. The NPS provided a HAVO perimeter polygon shapefile and data were clipped to a half-mile buffer around the park perimeter. This half-mile distance was used because NPATMA applies to air tours within a half-mile of the park. Analyses were conducted using ArcPro.
Analysis for Research Question 1
A 10 × 10 m digital elevation model (DEM; U.S. Geological Survey Citation2019) was used to determine AGL altitudes of flights. The AGL altitudes were calculated by the reported altitudes of the ADS–B logger minus the elevation of the DEM for every point location (x,y; see Beeco, Joyce, and Anderson Citation2020 for exact method). Using a 1,000 foot AGL altitude interval, data were segmented (0–1,000 feet AGL; 1,000–2,000 feet AGL; 2,000–3,000 feet AGL; 3,000–4,000 feet AGL; and > 4,000 feet AGL) and point density analysis was conducted for each altitude interval. Because each altitude interval had different amounts of waypoints, density classifications were standardized across altitude intervals. To do this, the altitude interval with the most waypoints (0–1,000 feet AGL) was used to standardize density classification, which required two steps. First, the 0 to 1,000 feet AGL altitude point density was classified using equal interval percentage breaks with five intervals of 20 percent. These percentage breaks were determined using the maximum waypoints per square kilometer as the 100 percent value. Second, the maximum number of waypoints per each 20 percent interval were then applied to point density classifications for the other altitude intervals. After these steps were accomplished, point density outputs were statistically compared for relatedness using the Band Collection Statistics tool, which conducted a correlation test. This correlation test measured the dependency between density raster layers (Akintomide et al. Citation2021). The correlation test is the ratio of the covariance between layers divided by the product of their standard deviations (see following equation). This calculation produces a correlation matrix similar to a normal correlation matrix (ESRI Citation2019).
where Cov is the covariance between layers, i and j are layers of the stack, and δ is the standard deviation of each layer.
Analysis for Research Question 2
Using the Grid Index Features tool, a digital grid was constructed to the size of a half-mile buffer around the park perimeter with a grid cell size of 0.5 square miles. The digital grid was then joined to each AGL altitude data set to produce five grids and number of waypoints was aggregated for each grid cell. Using the Hot Spot Analysis (Getis–Ord Gi*) tool, waypoint cluster analysis was conducted for each AGL altitude data set to identify overflight spatial patterns with statistically similar waypoint counts.
Hot spot analysis considers a hot spot in relation to neighboring data. An area considered a hot spot is not always a statistically significant hot spot unless it is surrounded by other hot spots. Hot spot analysis outputs p values and z scores for each grid cell, which provides information on statistical significance (p value) and hot spot intensity (z score).
Next, z scores of the hot spot analysis for each grid cell were statistically compared for relatedness using a correlation test. The Band Collection Statistics tool, however, does not conduct a correlation test for z scores produced by hot spot analysis. To conduct a correlation test, the z scores were analyzed using SPSS 27.0.
Analysis for Research Question 3
Using the Split by Attribute tool, the shapefile comprised of all ADS–B point data was segmented into individual shapefiles for each overflight. Using ArcMap’s Model Builder, an automated and iterative model was constructed to create line shapefiles using the Points to Line tool. The line shapefiles were then merged into a single shapefile and line density analysis was conducted using the Line Density tool. Next, a polygon shapefile was constructed to match the area of the line density output. Using the Grid Index Features tool, a digital grid was constructed using the polygon of the line density output and a grid cell size of 0.5 square miles. The grid was then joined to the shapefile that was comprised of all point data (not the line shapefile) and average AGL altitudes for each grid cell were calculated.
Analysis for Research Question 4
Using the FAA Releasable Database, metadata for each waypoint were determined, including aircraft owner. Waypoints with AGL altitudes below 2,000 feet were summarized using the attribute table. Using the Statistics tool within the attribute table, frequencies of waypoints were tabulated and relative numbers of waypoints below 2,000 feet AGL per aircraft owner were determined.
Results
Research Question 1
After the data were cleaned, the data set consisted of 660 overflights comprised of 375,903 waypoints (). The overflights were segmented into altitude intervals consisting of the following numbers of waypoints: 0 to 1,000 feet AGL had 145,989 waypoints (38.84 percent of the total sample), 1,000 to 2,000 feet AGL had 134,391 waypoints (35.75 percent), 2,000 to 3,000 feet AGL had 63,221 waypoints (16.82 percent), 3,000 to 4,000 feet AGL had 27,492 waypoints (7.31 percent), and > 4,000 feet AGL had 4,810 waypoints (1.28 percent).
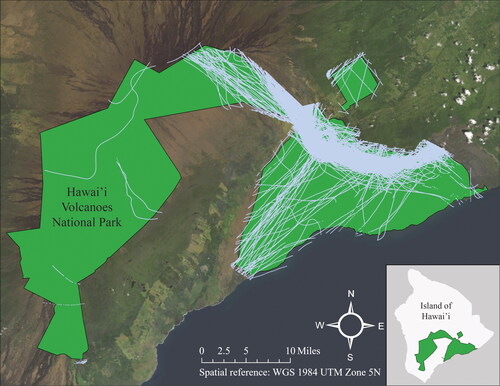
Figure 1 Overflight routes within a half-mile of Hawai‘i Volcanoes National Park (the polygon represented in green).
Next, point density analysis was conducted for each altitude interval. Density figures were overlaid with overflight routes respective to each altitude interval. shows dense overflight trends along the east side of HAVO for altitudes less than 1,000 feet AGL. Additionally, point density analysis revealed an inverse relationship between altitude and density. As overflight altitude increases, density decreases. The point density figures were statistically compared using a correlation test and three altitude intervals were highly correlated: 2,000 to 3,000 feet, 3,000 to 4,000 feet, and > 4,000 feet ().
Figure 2 Point density of flights at different above ground level altitudes.
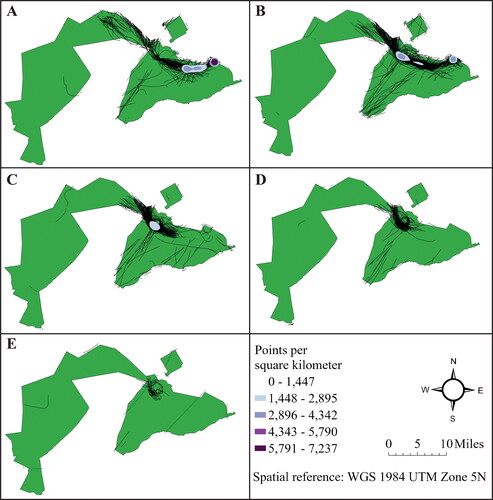
Table 1 Spatial correlation matrix of above ground level (AGL) altitude point densities
Research Question 2
Hot spot analysis revealed statistically significant spatial patterns that trend along the east side of HAVO (). Red grid cells represent statistically significant hot spot clustering at p < 0.01 (99 percent confidence) and orange grid cells represent statistically significant hot spot clustering at p < 0.05 (95 percent confidence). Similar to the density figures, hot spot figures were overlaid with overflight routes respective to each altitude interval. The z scores for each grid cell were statistically compared using a correlation test and three altitude intervals were highly correlated: 2,000 to 3,000 feet, 3,000 to 4,000 feet, and > 4,000 feet, which aligned with the density correlations (). This finding shows that overflight spatial patterns are different for low AGL altitudes (0–1,000 feet and 1,000–2,000 feet) compared to high AGL altitudes (2,000–3,000 feet, 3,000–4,000 feet, and > 4,000 feet).
Figure 3 Hot spot analysis of flights at different above ground level altitude intervals.
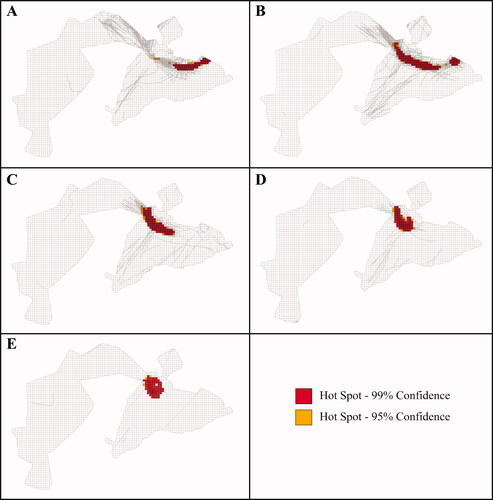
Table 2 Spatial correlation matrix of above ground level (AGL) altitude hot spot analysis z scores
Research Question 3
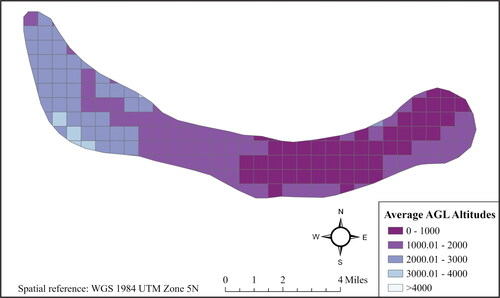
Line density analysis identified one overflight corridor along the east side of the park (). This corridor has an area of 89.70 square kilometers (22,166 acres). shows each side of the corridor has different average AGL altitude trends. The right side of the corridor (the east side) has average AGL altitudes mostly below 1,000 feet. The left side of the corridor (the west side) shows average AGL altitudes mostly between 1,000 and 3,000 feet.
Figure 4 Primary flight corridor located on the east side of Hawai‘i Volcanoes National Park.
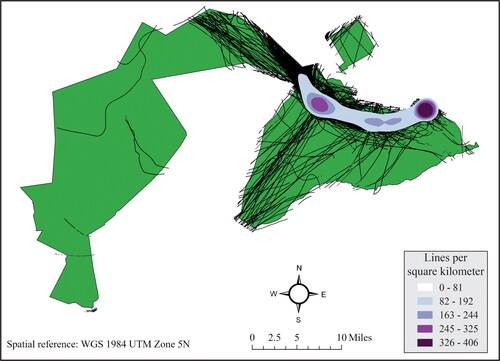
Figure 5 Average above ground level (AGL) altitudes across the primary flight corridor.
Research Question 4
Assessing the entire sample population’s waypoints (n = 375,903), the three owners with the highest frequencies of waypoints below 2,000 feet AGL were Nevada Helicopters Leasing LLC (73.11 percent of all waypoints), K & S Helicopters, Inc. (16.24 percent), and Sunshine Helicopters, Inc. (7.86 percent). Next, the relative number of waypoints for each owner below 2,000 feet AGL were calculated by dividing each owner’s waypoints below 2,000 feet AGL by their total number of waypoints (number of operator X waypoints <2,000 feet AGL/total number of waypoints for operator X). For these three owners, their relative number of waypoints below 2,000 feet AGL were 74.60 percent for Nevada Helicopters Leasing LLC, 83.55 percent for K & S Helicopters, Inc., and 78.85 percent for Sunshine Helicopters, Inc.
Discussion
Understanding spatial patterns of air tours is an important step toward developing air tour management strategies and ensuring compliance with established and future plans (Beeco, Joyce, and Anderson Citation2020). This study provided lateral and vertical patterns for low-level overflights at HAVO. Our findings advance the methodological and analytical processes for aircraft tracking at NPS units and advances park-specific findings and broad implications for low-level flights across the NPS system.
Park-Specific Findings
The majority of waypoints within a 0.5-mile buffer of the park boundary (74.59 percent) were below 2,000 feet AGL altitude and the primary flight corridor showed average AGL altitudes mostly below 2,000 feet AGL. This finding reveals the amount of points below the FAA’s recommendation for aircraft to fly above 2,000 feet AGL over parks, wildlife refuges, and areas with wilderness characteristics. The results also revealed lateral location differences at different altitude ranges. Specifically, the lower AGL altitudes (0–1,000 feet) were found on the most eastern portion of the park over Pu‘u‘ō‘ō, Nāpau Crater, Makaopuhi Crater, and Maunaulu (). As flight AGL altitudes increased, flight patterns shift west toward Kīlauea and the crater (). The correlation matrices ( and ) support the finding that lateral flight patterns change as AGL altitudes change. Based on this information, the NPS and FAA could deduce that noise from air tours would be greatest along the primary flight corridor and that the Pu‘u‘ō‘ō area might experience the most intense noise due to the higher density of sub-1,000-feet AGL air tours. Noise monitors could be used to verify these assertions. Furthermore, these findings could be used to design an acoustic monitoring strategy across the park and also refine route and altitude assumptions used for noise modeling. Also, overflight metadata analysis was useful in determining differences between aircraft owner travel patterns and can be used to understand differences in travel patterns per aircraft type.
Broad Management Implications
Prior studies focusing on the use of ADS–B data to understand airspace usage above NPS units have focused on proof of concept (Beeco and Joyce Citation2019), compliance with air tour management agreements (Beeco, Joyce, and Anderson Citation2020), and time series analysis (Peterson et al. Citation2022). This study complements and advances findings of prior studies by focusing on the relationship between lateral and vertical travel patterns. The findings, as mentioned earlier, revealed that there were differences between the lateral patterns as vertical patterns changed. This three-dimensional finding greatly informs decision-making for managing air tours over parks because lateral and vertical offsets are two of the primary means of managing airspace. Further, segmenting flights by 1,000-foot intervals proved to be an effective range because there were significant differences between patterns at that scale and air traffic corridors are often separated vertically by 500 to 1,000 feet to deconflict airspace in congested areas. Understanding the vertical spacing of aircraft is equally as important as understanding the lateral spacing.
Methodological and Analytical Improvements
Effectively and efficiently cleaning ADS–B data continues to be time consuming. Successful analysis of ADS–B data depends on efficient data management and automated data processing because these data sets often include millions of waypoints (Beeco, Joyce, and Anderson Citation2020). Flexible and effective queries should be designed to isolate data patterns and automated techniques should be used to isolate additional attributes of interest from the raw ADS–B data.
Future studies should consider distance traveled between waypoints, velocity recorded for each waypoint (horizontal velocity and vertical velocity), heading of each waypoint (direction in degrees in which the aircraft is pointed during movement), and sinuosity (the degree of meandering compared to straight line) as functional or automated data cleaning variables. Distances and headings can be determined using the haversine formula, which determines distance between two points in a sphere (i.e., planet Earth) based on their latitudes and longitudes. This information can be used to understand exactly how air tours are approaching attraction sites. Sinuosity is a measure of how much a linear feature deviates from a straight-line condition and can be calculated as the ratio of total flight path length to the straight-line distance between a flight’s initial and final waypoint. A perfectly straight flight path would have a sinuosity of one, but as the number of meanders in the path increases (e.g., the characteristic back-and-forth of survey flight behavior) sinuosity will begin to approach zero. Sinuosity could be used to boost efficiency of data cleaning by identifying straight-line flights that are not air tours.
Visualization of data should continue to improve. This study presents side-by-side density maps at various altitudes, which visualizes airspace in a novel and informative way. Future studies should consider creating space time cubes that could be constructed to understand how flight density changes in accordance with time. Three-dimensional data with time analysis could further help managers better understand air tour flight patterns (i.e., x, y, z, m).
Aircraft Noise
Soundscapes are a human perception of the acoustic environment and are spatially conditioned (Pilcher, Newman, and Manning Citation2009). Recreation (e.g., air tours) is also spatially conditioned (Beeco and Brown Citation2013). Spatially conditioned processes involve a relationship between space (location) and human-related phenomena. Because both soundscapes and recreation are spatially conditioned processes, recreation known to emit a high magnitude of noise (e.g., air tours) can help managers identify areas where soundscapes could be compromised. Therefore, management of areas that receive overflights below 2,000 feet AGL also contributes toward management of the soundscape because of their spatial alignment.
Conceptually, soundscapes are perceptional, but acoustic measurements are also important. These types of measurements can help managers understand overflight noise duration and how the landscape interacts with overflight noise. Research at Muir Woods National Monument found that when visitor-caused noise surpasses approximately 38 A-weighted decibels dB(A) it is judged as unacceptable by visitors (Pilcher, Newman, and Manning Citation2009). Noise duration is also an important consideration. Noise that is heard for longer durations diminishes the visitor experience more than noise heard for short durations (Miller Citation2008).
Landscape attributes, such as vegetation, topography, and atmospheric conditions also affect soundscapes. Heavily vegetated areas absorb more sound than barren landscapes and sound travels more easily through barren canyons where an echo effect is possible (Lugten et al. Citation2018). Conversely, it is also important for managers to understand the duration of noise-free intervals. These types of noise considerations are of interest to the NPS’s Natural Sounds and Night Skies Division (NPS Citation2021d), including relationships and interactions between acoustical environments and soundscapes. The identification of these relationships can be used by park managers to provide opportunities for quality experiences for both air tour visitors and terrestrial visitors (NPS Citation2018a) and for wildlife management. HAVO is home to several types of animals that are threatened or endangered, including songbirds that vocally communicate for survival (NPS Citation2019); aircraft noise has been shown to mask songbird communication (Gallardo Cruz, Paxton, and Hart Citation2021).
Ultimately, the goal of aircraft tracking should be to couple tracks with noise modeling. Currently, noise models can be produced by identifying average routes across aircraft types and modeling the noise. This method, however, does not account for spatial variation of air tours and also excludes other non-air-tour aircraft. A more comprehensive approach is needed to understand the impact aircraft have on the acoustic environment across the landscape. This research and the three prior studies that used ADS–B data to track overflights occurred at national park units. Aircraft tracking research that uses ADS–B data could be extended beyond national park units to other types of parks and protected areas and to gateway communities.
Limitations
Although only three studies have been published about the use of ADS–B technology in monitoring overflights, the possibilities for using this data source to benefit NPS management are evident. One potential limitation of this study is that aircraft are not required to be equipped with ADS–B technology in the airspace over or around HAVO. Despite this limitation, our study had a sample size of 660 flights, indicating that many aircraft in this area are equipped with the technology. Another limitation is that overflight purpose cannot be determined with certainty. This limitation can be overcome if flight purpose is confirmed by the aircraft operator or objective flight tracking data are submitted by operators. Another limitation is that ADS–B altitude data can be drawn from two sources: barometric altitude derived from the aircraft’s avionics or geometric altitude derived from Global Positioning System. Barometric altitude is known to include measurement error due to the sensitivity to atmospheric pressure. This study did not distinguish between the two different types of altitude data. Future studies should explore effective ways of dealing with barometric altitude errors.
This study’s unit of analysis was waypoints except for when overflight routes were used to determine the primary flight corridor. Although this study could not determine overflight purpose with certainty, the study was designed to gain as much insight as possible into air tour altitude characteristics. Air tours typically traverse across altitudes when nearing attraction sites, changing altitudes so air tour visitors can gain a preferred view. Using waypoints as the unit of analysis provides insight into altitude characteristics and can be analyzed for overflights that traverse across altitudes. Future research might want to use smaller altitude intervals than those used in this study to gain a finer understanding of altitude characteristics.
Conclusion
Managing for air tours, terrestrial visitors, and wildlife is challenging because parks present opportunities for recreational exploration of sight-seeing attractions, including exploration by air tours, opportunities to experience natural settings, and wildlife viewing. Hence, the NPS and the FAA were mandated by Congress to collaboratively mitigate and prevent adverse impacts, if any, to park resources from air tours. Data-driven decision-making can help managers determine multidimensional strategies such as suitable overflight routes, temporal requirements (number of flights per hour and when flights are not allowed), lateral requirements, and altitude requirements. The methods described in this study, along with other sources of information, can assist NPS units that are similarly challenged with determining appropriate management of air tours. In conclusion, it is not easy to manage for air tours, terrestrial visitors, and natural and cultural resource protection, but as more information becomes available, managers can make informed decisions that are in alignment with the NPS’s mission to conserve park unit resources and provide public enjoyment while leaving parks unimpaired for future generations.
Acknowledgments
The authors would like to acknowledge Danielle Foster and Catherine Sullivan for their help with deploying the ADS–B logger and downloading data, Warren Deeds for his support building the logging units, and Vicki Ward and Danielle Foster for their presubmission reviews.
Additional information
Notes on contributors
Brian A. Peterson
BRIAN A. PETERSON is a Research Assistant Professor in the Department of Horticulture and Natural Resources, Kansas State University, Manhattan, KS 66506. E-mail: [email protected]. His research interests include human dimensions of natural resources and visitor use management of parks and protected areas.
Rachel D. Shively
RACHEL D. SHIVELY is a Graduate Research Assistant in the Department of Horticulture and Natural Resources at Kansas State University, Manhattan, KS 66506. E-mail: [email protected]. Her research interests include human dimensions of wildlife along with mammal nutrition and habitat quality.
Sarah K. Jackson
SARAH K. JACKSON is a Postdoctoral Research Associate in the School of Forest Resources, University of Maine, Orono, ME 04469. E-mail: [email protected]. Collectively, her research interests involve investigating progressive, proactive, and creative measures regarding natural resource protection in the context of visitor experience facilitation within parks and protected areas. Further, she is also interested in evaluating the intrinsic aspect(s) of these experiences through understanding how faith, religion, and spirituality bring forth in situ and ex situ outcomes in relation to human–environmental connections and resulting environmental mindsets.
Julianna Rogowski
JULIANNA ROGOWSKI is a Research Assistant in the Applied Park Science Lab, Kansas State University, Manhattan, KS 66506. E-mail: [email protected]. Her research interests include visitor use management in parks and protected areas and outdoor recreation behavior.
J. Adam Beeco
J. ADAM BEECO is a Program Manager for Planning, Policy, and Compliance at the Natural Sounds and Night Skies Division of the U.S. National Parks Service, Fort Collins, CO 80525. His research focus is based around the protection of the natural acoustic and nighttime environments.
Damon Joyce
DAMON JOYCE is a Physical Scientist for the Natural Sounds and Night Skies Division of the U.S. National Parks Service, Fort Collins, CO 80525. His work focuses on providing hardware and software solutions to complex problems related to the protection of the natural acoustic and nighttime environments.
Literature Cited
- Akintomide, O. A., R. M. Amer, J. S. Hanor, S. Datta, and K. H. Johannesson. 2021. Pleistocene sands of the Mississippi River alluvial aquifer produce the highest groundwater arsenic concentrations in southern Louisiana, USA. Journal of Hydrology 595:125995. doi: 10.1016/j.jhydrol.2021.125995.
- Beeco, J. A., and G. Brown. 2013. Integrating space, spatial tools, and spatial analysis into the human dimensions of parks and outdoor recreation. Applied Geography 38:76–85. doi: 10.1016/j.apgeog.2012.11.013.
- Beeco, J. A., and D. Joyce. 2019. Automated aircraft tracking for park and landscape planning. Landscape and Urban Planning 186:103–11. doi: 10.1016/j.landurbplan.2019.03.001.
- Beeco, J. A., D. Joyce, and S. Anderson. 2020. Evaluating the use of spatiotemporal aircraft data for air tour management planning and compliance. Journal of Park and Recreation Administration 39 (1):2–21. doi: 10.18666/JPRA-2020-10341.
- Buxton, R. T., M. F. McKenna, D. Mennitt, E. Brown, K. Fristrup, K. R. Crooks, L. M. Angeloni, and G. Wittemyer. 2019. Anthropogenic noise in US national parks–sources and spatial extent. Frontiers in Ecology and the Environment 17 (10):559–64. doi: 10.1002/fee.2112.
- Buxton, R. T., A. L. Pearson, C. Allou, K. Fristrup, and G. Wittemyer. 2021. A synthesis of health benefits of natural sounds and their distribution in national parks. Proceedings of the National Academy of Sciences 118 (14):1–6. doi: 10.1073/pnas.2013097118.
- Colorado Division of Wildlife. 2008. Recommended buffer zones and seasonal restrictions for Colorado raptors. Accessed June 21, 2022. https://cpw.state.co.us/Documents/WildlifeSpecies/LivingWithWildlife/Raptor-Buffer-Guidelines.pdf.
- Department of Justice. 2015. NPS Organic Act. Accessed June 21, 2022. https://www.justice.gov/enrd/nps-organic-act.
- Duong, Q., T. Tran, D. T. Pham, and A. Mai. 2019. A simplified framework for air route clustering based on ADS–B data. Paper presented at the 2019 IEEE-RIVF International Conference on Computing and Communication Technologies (RIVF), IEEE, March 20-22, Danang, Vietnam. doi: 10.1109/RIVF.2019.8713685.
- ESRI. 2019. An overview of the Multivariate toolset. Accessed June 21, 2022. https://desktop.arcgis.com/en/arcmap/106/tools/spatial-analyst-toolbox/an-overview-of-the-multivariate-tools.htm.
- Federal Aviation Administration (FAA). 2004. Advisory circular: Visual flight rules (VFR) flight near noise-sensitive areas. Accessed June 21, 2022. https://www.faa.gov/regulations_policies/advisory_circulars/index.cfm/go/document.information/documentid/23156.
- Federal Aviation Administration (FAA). 2018. ADS–B, research, airspace. Accessed June 21, 2022. https://www.faa.gov/air_traffic/technology/equipadsb/.
- Federal Aviation Administration (FAA). 2020a. Automatic Dependent Surveillance–Broadcast (ADS– B). Accessed June 21, 2022. https://www.faa.gov/air_traffic/technology/adsb/.
- Federal Aviation Administration (FAA). 2020b. Termination of previously initiated processes for the development of air tour management plans and environmental assessments/environmental impact statements for various national park units and notice of intent to complete air tour management plans at 23 national park units. Accessed June 21, 2022. https://www.federalregister.gov/documents/2020/09/03/2020-19490/termination-of-previously-initiated-processes-for-the-development-of-air-tour-management-plans-and.
- Federal Aviation Administration (FAA). 2021. Aircraft registration releasable aircraft database download. Accessed June 21, 2022. https://www.faa.gov/licenses_certificates/aircraft_certification/aircraft_registry/releasable_aircraft_download/.
- Gallardo Cruz, K. V., K. L. Paxton, and P. J. Hart. 2021. Temporal changes in songbird vocalizations associated with helicopter noise in Hawai'i’s protected natural areas. Landscape Ecology 36 (3):829–43. doi: 10.1007/s10980-020-01179-2.
- Habler, E., and A. Shabtai. 2018. Using LSTM encoder–decoder algorithm for detecting anomalous ADS–B messages. Computers & Security 78:155–73. doi: 10.1016/j.cose.2018.07.004.
- Jones, C., N. Shipley, and S. Ul-Hasan. 2017. Bringing parks back to the people: Revisiting the dual mandate and core values of the National Park Service. The George Wright Forum 34 (1):45–52.
- Lawson, S., K. Hockett, B. Kiser, N. Reigner, A. Ingrm, J. Howard, and S. Dymond. 2007. Social science research to inform soundscape management in Hawai‘i Volcanoes National Park. Final report, Department of Forestry, College of Natural Resources, Virginia Polytechnic Institute and State University, Blacksburg, VA.
- Lignell, B. W. 2020. Reporting information for commercial air tour operations over units of the National Park System: 2019 annual report. Natural Resource Report NPS/NRSS/NSNSD/NRR— 2020/2193, National Park Service, Fort Collins, CO.
- Lugten, M., M. Karacaoglu, K. White, J. Kang, and K. Steemers. 2018. Improving the soundscape quality of urban areas exposed to aircraft noise by adding moving water and vegetation. The Journal of the Acoustical Society of America 144 (5):2906–17.
- Lynch, E., D. Joyce, and K. Fristrup. 2011. An assessment of noise audibility and sound levels in US national parks. Landscape Ecology 26 (9):1297–1309. doi: 10.1007/s10980-011-9643-x.
- McDonald, C. D., R. M. Baumgarten, and R. Iachan. 1995. Aircraft management studies: National Park Service visitors survey. HMMH Report 290940.12, 94-2, National Park Service, Department of the Interior.
- Miller, N. P. 2008. US national parks and management of park soundscapes: A review. Applied Acoustics 69 (2):77–92. doi: 10.1016/j.apacoust.2007.04.008.
- National Parks Overflight Act. 1987. The National Parks Overflight Act of 1987. Accessed June 21, 2022. https://www.faa.gov/about/office_org/headquarters_offices/arc/programs/grand_canyon_overflights/more_grand_canyon_overflights.cfm#:∼:text=The%20National%20Parks%20Overflights%20Act,protection%20of%20Park%20and%20.
- National Park Service. 1995. Report on the effects of aircraft overflights on the National Park System. Accessed June 21, 2022. https://archive.org/details/reportoneffectso00nati/page/n1/mode/2up.
- National Park Service. 2018a. The natural sounds and night skies division interpretive handbook. Accessed June 21, 2022. https://www.nps.gov/subjects/sound/teaching.htm.
- National Park Service. 2018b. Quick history of the National Park Service. Accessed June 21, 2022. https://www.nps.gov/articles/quick-nps-history.htm.
- National Park Service. 2019. On the brink of extinction. Accessed June 21, 2022. https://www.nps.gov/havo/learn/nature/onthebrink.htm.
- National Park Service. 2021a. Bryce Canyon NP draft air tour management plan. Accessed June 21, 2022. https://parkplanning.nps.gov/document.cfm?parkID=34&projectID=103148&documentID=114723.
- National Park Service. 2021b. Grand Canyon National Park. Accessed June 21, 2022. https://www.nps.gov/grca/index.htm.
- National Park Service. 2021c. Great Smoky Mountains National Park air tour management plan. Accessed June 21, 2022. https://parkplanning.nps.gov/document.cfm?parkID=382&projectID=100689&documentID=114585.
- National Park Service. 2021d. Natural Sounds and Night Skies Division. Accessed June 21, 2022. https://www.nps.gov/orgs/1050/index.htm.
- Peterson, B. A., M. T. Brownlee, J. A. Beeco, J. C. Hallo, D. L. White, and D. Joyce. 2022. Spatiotemporal analysis to understand overflight travel patterns at Hawaii Volcanoes National Park. Journal of Outdoor Recreation and Tourism 37:100476. doi: 10.1016/j.jort.2021.100476.
- Pilcher, E. J., P. Newman, and R. E. Manning. 2009. Understanding and managing experiential aspects of soundscapes at Muir Woods National Monument. Environmental Management 43 (3):425–35.
- Rapoza, A., E. Sudderth, and K. Lewis. 2015. The relationship between aircraft noise exposure and day-use visitor survey responses in backcountry areas of national parks. The Journal of the Acoustical Society of America 138 (4):2090–2105.
- U.S. Fish and Wildlife Service. 2007. National bald eagle management guidelines. Accessed June 21, 2022. https://www.aphis.usda.gov/plant_health/plant_pest_info/emt/downloads/EaglePrtctnGuidance.pdf.
- U.S. Geological Survey. 2019. Kīlauea. Accessed June 21, 2022. https://volcanoes.usgs.gov/volcanoes/kilauea.
- U.S. Geological Survey. 2021a. Kīlauea—Volcano updates. Accessed June 21, 2022. https://www.usgs.gov/volcanoes/kilauea/volcano-updates.
- U.S. Geological Survey. 2021b. The Pu‘u‘ō‘ō eruption lasted 35 years. Accessed June 21, 2022. https://www.usgs.gov/volcanoes/kilauea/pu-u-eruption-lasted-35-years.
- United Nations Educational, Scientific and Cultural Organization (UNESCO). 2022. What is world heritage? Accessed June 21, 2022. https://whc.unesco.org/en/faq/19.
- Zha, H., Q. Tian, and Y. Lin. 2020. Real-world ADS–B signal recognition based on radio frequency fingerprinting. Paper presented at 2020 IEEE 28th International Conference on Network Protocols (ICNP), October 13-16, Madrid, Spain. doi: 10.1109/ICNP49622.2020.9259404.