
Abstract
Intersectionality and Black feminist thought invite cartographic thinking. Black feminist thinkers evoke cartographic metaphors and imaginaries like intersectionality and the matrix of domination to better illuminate and challenge systems of power and oppression. Such cartographic frameworks contribute toward an evolving feminist mapping toolkit and a growing expanse of feminist interventions in mapping. Yet, there remains a need to engage with the commitments of Black feminist thought in everyday mapping practices. I introduce the gallery of possibilities as a tangible methodological mapping intervention that materializes Black feminist thought and cartographic metaphors by retooling existing cartographic techniques, specifically small multiples, grounding and contextualizing them in questions within Black feminist thought. By engaging with intersecting systems of power and their operation, and the multiplicity of ways power emerges, the gallery of possibilities destabilizes the stasis encoded in traditional mapping solutions. I outline five core elements of the gallery of possibilities and illustrate the method with a case study—a workshop series on feminist map icons. In sum, the gallery of possibilities, along with Black feminist thought, expands the range and availability of feminist mapping methods and tools. Together, the gallery of possibilities and Black feminist thought transform everyday contemporary mapping practice.
交叉性和黑人女权主义思想引发了对制图学的思考。利用制图隐喻和想象(例如, 交叉性和支配矩阵), 黑人女权主义思想家能更好地阐明和挑战权力体系和压迫系统。这些制图学框架, 有助于女权主义制图工具的不断进步, 能扩大女权主义者对制图的干预。然而, 仍然需要在常规制图工作中采纳黑人女权主义思想。我介绍了“可能性展示”, 在方法论上对制图进行有形干预, 调整现有制图技术(特别是小而多图)并在制图中考虑黑人女权主义思想中的问题, 实现黑人女权主义思想和制图隐喻的具体化。“可能性展示”考虑多重权力系统及其作用、各种权力产生方式, 打破传统制图方法的停滞。我概述了“可能性展示”的五个核心要素, 并通过案例研究(女权主义地图图标系列研讨会)阐述了其方法。总之, “可能性展示”与黑人女权主义思想拓展了女权主义制图方法和工具的范畴和可用性, 改变了目前的常规制图方法。
La interseccionalidad y el pensamiento feminista negro invitan a pensar cartográficamente. Los pensadores feministas negros evocan metáforas e imaginarios cartográficos, como la interseccionalidad y la matriz de dominación, para iluminar y cuestionar mejor los sistemas de poder y opresión. Tales marcos cartográficos contribuyen a construir una caja de herramientas de mapeo feminista en evolución, y a la creciente expansión de las intervenciones feministas en cartografía. No obstante, sigue vigente la necesidad de involucrarse con los compromisos del pensamiento feminista negro en las prácticas cotidianas de mapeo. Presento la galería de posibilidades como una intervención de mapeo metodológico tangible que materializa el pensamiento feminista negro y las metáforas cartográficas, renovando las herramientas para las técnicas cartográficas existentes, específicamente los pequeños múltiplos, basándolas y contextualizándolas en cuestiones dentro del pensamiento feminista negro. Al involucrarse con la intersección de los sistemas de poder y su operación, y con la multiplicidad de formas como emerge el poder, la galería de posibilidades desestabiliza la inmovilidad codificada en las soluciones tradicionales de mapeo. Presento el esquemas de cinco elementos medulares de la galería de posibilidades e ilustro la metodología con un estudio de caso –una serie de talleres sobre iconos cartográficos feministas–. En síntesis, la galería de posibilidades, junto con el pensamiento feminista negro, amplía el ámbito y la disponibilidad de métodos y herramientas de mapeo feminista. Juntos, la galería de posibilidades y el pensamiento feminista negro, transforman la práctica de mapeo cotidiana contemporánea.
Intersectionality and Black feminist thought invite cartographic thinking. Feminist scholars have long challenged rejective claims that mapping is inherently incompatible with critical, feminist frameworks by recognizing the situatedness of mapmakers and the view from above (Haraway Citation1988), subverting top-down perspectives (Kwan Citation2002a), embracing qualitative data and methods (Knigge and Cope Citation2006), and acknowledging the inherent tensions within representational practice (Schuurman and Pratt Citation2002). Beyond the material application of feminist frames in mapping, Black feminist engagements with intersectionality and the matrix of domination expand cartographic thinking by embracing imaginative mapping metaphors as feminist praxis. In other words, Black feminist thinkers (along with transnational feminists like Chandra Mohanty) evoke cartographic metaphors and imaginaries to better illuminate and transform geographies of difference (e.g., Mohanty Citation2003 in “Cartographies of Struggle: Third World Women and the Politics of Feminism”; McKittrick Citation2006 in Demonic Grounds: Black Women and the Cartographies of Struggle; Bailey and Shabazz Citation2014 on “New Black Cartographies of Resistance and Survival”). In a legal studies piece, for example, Crenshaw (Citation1989) articulated (and coined) intersectionality as intersecting roads, a spatial metaphor that places race and gender on two distinct paths meeting at a crossroads. This imaginative, mental map is an important and evocative visual metaphor illustrating the compounding forces of oppression. Building spatial complexity, Collins (Citation2009) envisioned the matrix of domination or, for me, a multidimensional and multiscale map that recognizes the various domains (e.g., interpersonal, hegemonic, disciplinary, and structural) whereby systems of power like racism, sexism, classism, and ablism, among others, differentially intersect, generating and reinforcing positions of privilege and oppression. These metaphorical and imaginative cartographies offer tools and frameworks for a feminist mapping toolkit that not only examines but challenges and transforms intersecting systems of oppression through mapping practices. The gallery of possibilities, shared here, is a tangible methodological mapping method that materializes Black feminist thought and cartographic metaphors by retooling existing cartographic techniques, grounding and contextualizing them in questions of intersectionality and power within Black feminist thought.
In what follows, I introduce feminist interventions in mapping, illustrating their application across geospatial data, map design, and mapping processes (i.e., three sites for intervention). Throughout, I employ the terms cartography and mapping in their most expansive forms to include examples and ideas that fall in- and outside the bounds of academia (see Edney Citation2019 and Bosse Citation2020 for reconceptualizations of cartography). I only refer to related or analogous terminology like geographic information systems (GIS) when engaging with others’ words. Next, I frame and outline the gallery of possibilities as a feminist methodological intervention in mapping that retools traditional mapping techniques, specifically small multiples, to engage the multiplicities of intersectionality and systems of power while also destabilizing the singularity and stasis encoded in “objective” mapping solutions. I illustrate this method with a case study—a workshop series on feminist map symbolization—and conclude by recognizing that there remains a need to engage and materialize the commitments of Black feminist thought within existing mapping techniques and everyday mapping practices, more broadly.
Feminist Mapping
Although a comprehensive recount is out of scope for this methodological intervention, the brief history of feminist mapping outlined here is inherently incomplete given my epistemological leanings and my shifting position and privilege within the matrix of domination.Footnote1 I draw inspiration from Elwood and Leszczynski (Citation2018), who continually expand preconceptions of feminist digital geographies, which includes mapping, by centering theoretical “horizons” (both past and emerging) and those strategically marginalized or erased in mapping spaces. Within this context, feminist mapping is by no means new (Kwan Citation2002a; Schuurman and Pratt Citation2002; Knigge and Cope Citation2006; Brown and Knopp Citation2008; Jung and Elwood Citation2010; Elwood and Leszczynski Citation2018; Yang et al. Citation2021). Feminist GIS as a concept in Western academic arenas is often attributed to a 2002 special issue of Gender, Place and Culture where the authors refuted the supposed incompatibility of GIS and feminist geographies through exemplary work (see Kwan Citation2002b for an overview). Together, the authors engaged with underlying tensions and challenges of mapping as they relate to activism and power (McLafferty Citation2002), everyday geographies and urban environments (Pavlovskaya Citation2002), and situatedness of maps and their mapmakers (Schuurman and Pratt Citation2002; Kwan Citation2002a). This special issue provided a launch pad for future work that expanded their lines of inquiry in new methodological (e.g., Knigge and Cope Citation2006 on ground visualization; Elwood Citation2006 on participatory GIS; Jung and Elwood Citation2010 on expanding GIS software) and theoretically rich directions (e.g., Gilbert and Masucci Citation2006; Pavlovskaya 2006; Brown and Knopp Citation2008) that engage with epistemological tensions, power relations, and alternative ways of knowing.
Acknowledging the power granted by visuality as well as the critiques of such a gaze,Footnote2 mapping offers opportunities for making the intricacies of Black feminist thought and cartographic metaphors like intersectionality tangible. Recent work in data feminism and design justice along with race critical code studies and digital humanities has sparked renewed energy and motivation for feminist mapping by centering Black feminist thought (Benjamin Citation2019; Costanza-Chock Citation2020; D’Ignazio and Klein 2020; Kelly Citation2020; COVID Black n.d.). Feminist thinkers and makers in these spaces challenge the perceived objectivity of maps by revealing deeply situated practices indoctrinated within interlocking systems of power, systems that differentially privilege and oppress (Combahee River Collective 1977; Crenshaw Citation1989; Collins Citation2009; Nash 2018). Data Feminism, a book and feminist framework proposed by D’Ignazio and Klein (2020), centers on power and intersectional practices across data science and visualization. Rodó-de-Zárate (Citation2014), for example, reenvisions relief mapsFootnote3 to “collect, analyze, and display intersectional data.” Moving beyond cross-tabulations of specific demographic variables, Rodó-de-Zárate (Citation2014) inputs power structures, personal experiences, and place, data points frequently erased within mapping. Gallon (Citation2020a, Citation2020b) further offers Black feminist data analytics as an intersectional approach to data decision-making, revealing and challenging the relations between racism and critical analysis of COVID-19 data. Like Rodó-de-Zárate (Citation2014), Gallon (Citation2020b) stresses the importance of looking beyond intersectionality as data cross-tabulations or simply overlapping identities and, instead, investigated the broader systems that generate domination in data practices. Such an approach recognizes that all data are relational and requires an ethics of caring for data, a “precarious prospect that equally holds the possibility of liberation and oppression” (Gallon Citation2020a).
Beyond questions of intersectionality and systems of power in data, maps also creatively explore new ways of visualizing intersecting systems of power (i.e., the matrix of domination). Mapping projects like Million Dollar Hoods (n.d.) examine and resist such systems of power by challenging conventional visualizations of criminalization that work to dehumanize and by centering individuals most affected by the carceral state. Transforming Justice (Bley et al. Citation2022) is another collaborative project that included a mapping workshop to challenge and visually reimagine common narratives of policing and segregation in Milwaukee, Wisconsin (i.e., narratives that produce and reinforce racialized landscapes through criminalization and surveillance). Mapmakers in the workshops replaced prevalent heat mapsFootnote4 showing supposed hot spots of crime with maps that subvert systems of power (Bley et al. Citation2022). In one example, the mapmakers manually stack personal stories of policing and segregation on top of a transparent redlining map and another map with disparaging descriptors of redlined areas. By bringing past and present together, the mapmakers expose multiple domains within the matrix of domination. In other words, the combined map layers place the interpersonal experiences of oppression in direct conversation with structural policies like redlining that generated racialized landscapes and were reinforced by disciplinary and hegemonic or social domains. The Transforming Justice mapping project emphasizes the importance of systems of power within mapping processes and collaboration. The Design Justice Network (Costanza-Chock Citation2020) follows suit, recognizing the power of “who’s doing the mapping” and the material impacts of data and mapping on everyday livelihoods. Costanza-Chock (Citation2020) further calls for feminist mapping processes that are grounded by those most affected by spatial phenomenon to challenge systems of power that determine who maps and what narratives are mapped.
Like intersecting systems of power, maps are not static objects and require contextualization. Kitchin and Dodge (Citation2007) and Pearce (Citation2014), among others, examine maps as emergent processes where maps, their makers, and their readers are coconstitutive knowledge producers that are always in a state of becoming. Black feminists and their engagements with intersectionality and the matrix of oppression similarly engage processual approaches and require accountability and not simply transparency (see D’Ignazio and Klein [Citation2020] for a discussion). In their work, Kelly and Bosse (Citation2022) introduce a feminist toolkit for building reflexivity into mapping, a process that calls mapmakers from all arenas to make time and space for considerations of intersecting power structures and their differential complicities within such power structures. Such an approach demands work to dismantle dominant power structures. Reflexive orientations that directly engage power relations build on recent calls for expanded metadata practices (Schuurman and Leszczynski Citation2006; Ricker Citation2018; CIVIC Citation2020; Gebru et al. Citation2020) that recognize the importance of context (D’Ignazio and Klein 2020) and the partialities of knowledge production (Harding Citation1986; Haraway Citation1988; Collins Citation2009). When viewed as processes embedded within power relations, feminist mapping requires reflexive accountability and contextualization, often pairing maps with text or other modes of communication or expression that work toward more equitable futures (Kelly and Bosse Citation2022).
As introduced, Black feminist thinkers evoke cartographic metaphors and imaginaries like intersectionality and the matrix of domination to better illuminate systems of power and oppression and transform geographies of difference. These cartographic imaginaries or frameworks inform a growing expanse of feminist interventions in mapping. Despite the examples outlined here (and many others), maps and everyday mapping techniques often remain rooted in unexamined perspectives of power and privilege. As such, there remains a need to expand our feminist mapping toolkit and engage and materialize the commitments of Black feminist thought within everyday mapping practices.
Curating a Gallery of Possibilities
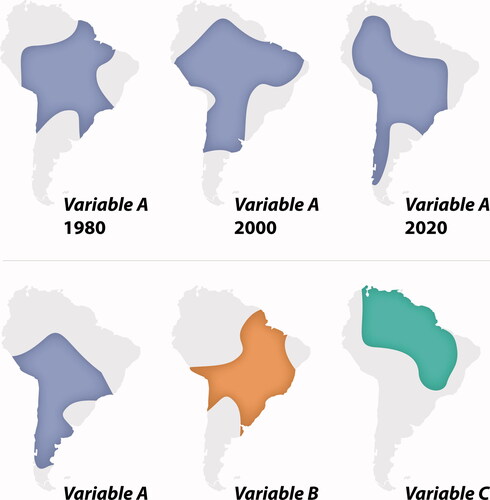
The gallery of possibilities is a mapping method that materializes Black feminist thought by retooling small multiples, a traditional thematic mapping technique commonly used to compare spatial phenomena. More specifically, a small multiple map presents “a series of small data visualization instances varying in a key attribute” like time or other spatial variables (Nelson Citation2020; ). Unlike more visually complex mapping techniques that stack or combine multiple spatial or temporal variables into one frame, small multiple maps present individual variables or moments in time across multiple frames. This allows viewers to engage with a series of mini maps at their own pace. Despite some disadvantages (see Fish Citation2018 for a discussion), the small multiples mapping technique inadvertently embraces feminist considerations of pluralism that bring multiple perspectives together (D’Ignazio and Klein Citation2018, 2020). Like small multiples, the gallery of possibilities presents multipart or multiple visualizations for comparison, but, more importantly, to recognize the process and partiality of any singular data set, attribute, or visualization. Bringing multiple perspectives and multiple maps together allows the reader to better understand the nuance and complexities within intersecting systems of power and the context from which each map arises.
Figure 1 Two imaginary examples of small multiples, a traditional thematic mapping technique commonly used to compare spatial phenomenon including the same variable over time (see top example in purple) or multiple variables over space (see bottom example in purple, orange, and green).
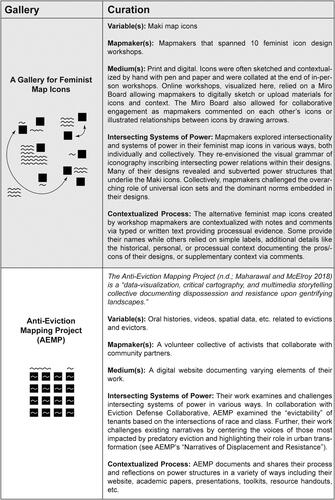
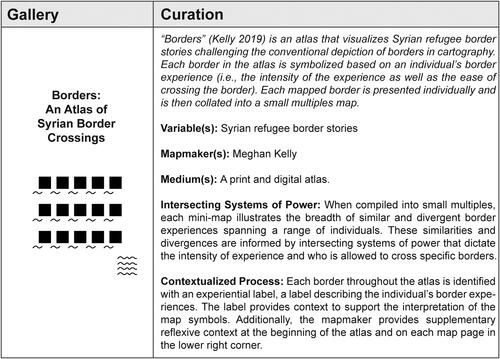
Beyond its pluralistic form (i.e., retooled small multiples), there are five core elements within the gallery of possibilities: variables, mapmakers, mediums, intersecting systems of power, and contextualized process. These elements, however, are not prescriptive. They can take shape in numerous ways (), and I encourage others to retool this frame.
Figure 2 Galleries of possibilities take many forms. These examples illustrate various configurations with a series of black boxes (i.e., maps or visualizations), squiggly lines (i.e., annotations and context), and arrows (i.e., dynamic media like Miro Boards). Further, the five core elements of each gallery are detailed to illuminate and inspire alternative possibilities.
Variables: Like small multiples mapping, the gallery of possibilities examines one or more variables. These variables can be spatial (or even aspatial, like map icons), temporal, qualitative, or quantitative. Variables serve as the object or phenomenon that is being mapped or visualized through a feminist lens and presented in gallery form.
Mapmakers: The gallery of possibilities can be curated by one or more mapmakers. When curated by one mapmaker, the gallery of possibilities might focus on process through iteration or distillation. For example, a mapmaker might iteratively approach a single data set or map by creating multiple maps from differing angles or perspectives. Alternatively, a mapmaker could distill a map into its substantive parts to break down or deconstruct the mapping process. When curated by more than one mapmaker, the gallery of possibilities brings together multiple voices and perspectives. When collectivized, mapmakers might focus on a particular data set and illustrate the multiple angles of analysis and potential mappings. Mapmakers can also focus on one particular theme assembling multiple data sets, approaches, and mapped stories into the gallery of possibilities.
Mediums: Galleries of possibilities can be curated both as tangible, nondigital objects (e.g., atlases, in-person galleries, notebooks) and digital objects (e.g., online atlases, Web sites, Miro Boards). Each medium offers opportunities and challenges. Digital tools and spaces allow for galleries that continually update, expand, or evolve. This supports galleries focused on ongoing, real-time processes and collaboration. Nondigital galleries can also support process-based galleries, albeit in different forms. Further, both mediums offer varying modes of engagement (i.e., tactile, multisensory, collaborative), another consideration for curating a gallery of possibilities.
Intersecting systems of power: Geospatial data, map design and analysis, tools, technologies, mapmakers, and collaborations are imbued within intersecting systems of power like racism, sexism, classism, and ablism, among others. The gallery of possibilities prioritizes, reveals, and challenges these systems within the mapping process. There are several ways to do this. For example, the gallery of possibilities takes the role of the mapmaker(s) and their positions with intersecting systems of power seriously. Additionally, the gallery of possibilities could reveal (in)visibilities within mapping that can be attributed to differentials in privilege and oppression. The gallery of possibilities can challenge differential power structures within map symbolization by rethinking and retooling traditional mapping practices. Finally, the gallery of possibilities acknowledges and works toward centering data and narratives that have been placed at the margins of mapping as well as the mapmaker(s) that are most affected by the variables being mapped.
Contextualized process: The gallery of possibilities makes process visible by adding context. This processual approach rejects the stasis encoded in singular map outcomes, and instead, prioritizes multiplicity, complexity, nuance, iteration, repetition, messiness, and works in progress. The gallery of possibilities is more than a transparent process that “shows” your work (D’Ignazio and Klein 2020). Instead, the gallery of possibilities shows contentious power relations within often messy or nonlinear workflows. It shows limits, possibilities, and more equitable alternatives, as well as trial, error, and iteration. The gallery of possibilities engages viewers by understanding their encounters as extensions of the mapping process.
In sum, the gallery of possibilities as a method itself is not static. Just as my thinking has changed over time,Footnote5 the utility and frame of the gallery of possibilities is an ongoing negotiation. It is one part of any ever-evolving feminist mapmaking toolkit that is meant to nudge everyday mapping practices and related conversations forward. The gallery of feminist map icons in the following section details one configuration of the method, and offers alternative possibilities.
A Gallery of Feminist Map Icons
Map icons are tiny map symbols used to locate spatial features like people, places, things, and events (see Bell Citation2020 for an overview). Map icons are typically collated into icon sets or libraries. The National Park Service (Citation2018), for example, uses a custom icon set across their map products to maintain aesthetic and brand consistency. Mapping platforms like Google Maps, Apple Maps, and, of particular importance here, Mapbox use house icon sets like Maki () that can be easily incorporated into interactive maps. These icons are meant to be universally applied across mapping contexts. In previous work, I have called the supposed universality of icons and icon sets into question, arguing for feminist intervention in their design (Kelly Citation2021). I have since facilitated a series of feminist icon design workshops to answer this call (Kelly Citation2020). In each workshop, I introduced a feminist mapping framework adopted from D’Ignazio and Klein (Citation2018, 2020) that centers on intersecting systems of power. I then asked workshop designers to iteratively sketch alternate icons, drawing inspiration from the feminist framework. I also asked workshop designers to annotate their sketches, contextualizing themselves and their processes. I have collated over 1,000 feminist icons across ten workshops. Most recently, I facilitated a virtual workshop with an expansive, international audience as part of the feminist visualization workshop series (Coddington and Williams Citation2021). Here, I outline the five core elements from presented earlier that shape a gallery of feminist map icons (). showcases the entire gallery in one snapshot and zooms into the gallery, providing a more detailed perspective.
Figure 3 The Maki icon set is an open source icon set available for mapmakers. The icons were reproduced here following “CC0 1.0 Universal” status.
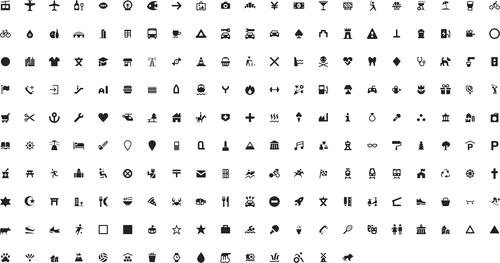
Figure 4 A Miro Board or virtual maker space was used during a feminist icon design workshop to collectively reenvision the Maki icon set. Taken as a whole, the Miro Board serves as a gallery of possibilities by bringing many variables (i.e., icons) into one frame or display. Each icon is also contextualized with notes, reflections, and comments via text providing processual evidence.
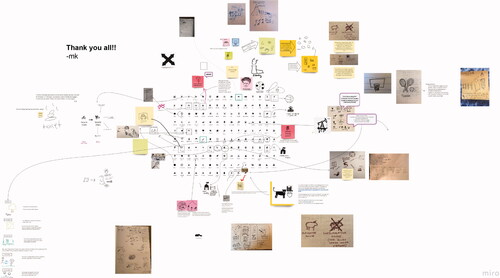
Figure 5 A closer examination of alternative icons within the gallery of feminist map icons.
Variables: Maki is a map icon set created by Mapbox, a technology company that provides an online platform for custom Web maps, applications, and navigation tools (see Kelly Citation2021 for a full biography of the icon set). Mapbox released Maki in 2013 to provide “out-of-the-box” map icons that can be used in interactive Web maps. In its current rendition, Maki consists of 204 open source map icons served as 15-pixel × 15-pixel vector files (i.e., files made up of points, lines, and polygons) allowing for digital customization. The icons are meant to be downloaded and installed directly into interactive Web maps fitting all mapping contexts. In prior work, I have outlined the need for more expansive icon sets that are grounded in feminist principles like intersecting systems of power and context (Kelly Citation2021). The gallery of feminist icons presented here uses Maki icons as key variables or objects to redesign.
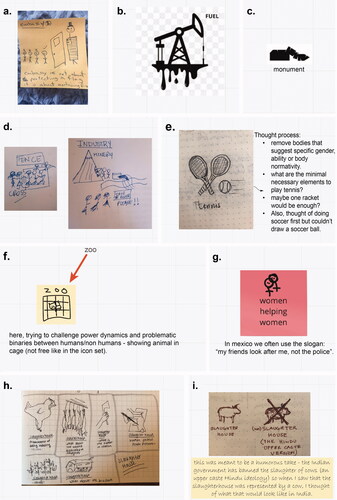
Mapmakers: The number of mapmakers attending my feminist icon design workshops ranged from 5 to 150. The virtual workshop outlined here included over 100 mapmakers from around the world. Mapmakers in this workshop generated a gallery of possibilities both individually and collectively. Individually, mapmakers iteratively redesigned individual map icons (e.g., the toilet icon), producing multiple versions fitting differing contexts. Other mapmakers redesigned more-than-one map icon (e.g., the toilet icon, the oil icon, and the soccer icon) producing a wider array of icons. When considered collectively, the gallery of possibilities reflects the multitude of voices and varying perspectives of mapmakers as they create alternative map icon designs that reflect their personal experiences.
Mediums: In the virtual workshop, designers used a Miro Board (n.d.) as a digital collaborative maker space. Miro allowed mapmakers to gather synchronously for the event from multiple time zones as well as to work independently after the event. Mapmakers digitally sketched alternative map icons and added notes and reflections directly into the maker space using Miro’s drawing and text tools. They also worked offline using pen and paper, uploading their hand-drawn materials to the Miro Board. Mapmakers engaged with one another in real time as their online cursors zoomed around the maker space, viewing, commenting, and making connections across icon designs. This engagement also occurred asynchronously after the event. In sum, the Miro Board is the gallery space. The digital maker space allowed for multiple modes of engagement using both digital and nondigital design tools, and multiple modes of collaboration, both live and asynchronous. The Miro Board brought mapmakers together to produce alternative map icons that can be viewed in one frame or snapshot, revealing individual nuance, commonality, and difference.
Intersecting systems of power: Workshop designers explored intersectionality and systems of power in their feminist map icons in various ways. Workshop mapmakers reenvisioned the visual grammar of iconography, inscribing power relations within their designs. One designer, for example, challenged the power of the carceral state by reenvisioning an icon for “embassy” (). The alternative icon depicts four stick figures waiting outside of a door and above each of their heads is a checkmark or X. A menacing, much larger figure with American paraphernalia as clothing is standing on the other side of the door. The checkmark and Xs represent the differential treatment of individuals based on systems of power and oppression. Other icons like the oil rig, fallen monument, and tennis rackets, respectively, reveal and subvert power structures that underlie their original referenced icon, oil, monument, and tennis (, and 5E). In addition to rethinking and redesigning individual map icons, workshop mapmakers collectively challenged the overarching role of universal icon sets. Universal icon sets like Maki in showcase and prescribe one particular view of the world, a default imaginary shaped by those in power (see Kelly Citation2021 for details). The gallery of possibilities offers new and expansive imaginaries, and a renewed reconceptualization of icon sets, one that challenges default norms generated through dominant mapping practices that are embedded within intersecting systems of oppression ().
Importantly, engagements with intersecting systems of power can be lacking or even dangerous. Not all mapmakers, for example, engaged directly with power in their design process or, if they did, it might not be clear how power influenced their designs. In the former scenario, this could result from mapmakers holding relative positions of power that normalize existing systems of power and oppression. In the latter scenario, mapmakers might not have provided supplemental information to help understand the mapmaker’s design process and reflections including the limits, opportunities, and suggested context for their map icons. Following Gallon (Citation2020a), both scenarios simultaneously enable possibilities for “oppression and liberation.” In other words, even with the best intentions, the gallery of possibilities and engagements with intersecting systems of power have the potential to inadvertently harm by reinforcing power structures. In the words of Costanza-Chock (Citation2020), “good intentions are not enough.” In these instances, it is imperative to remain accountable, working to repair the harm caused.
Contextualized process: The alternative feminist map icons created by workshop mapmakers are contextualized with notes and comments via typed or written text providing processual evidence. Like their engagements with power, mapmakers provided context to varying degrees (). Some relied on simple labels like “monument” (). Others provided additional details like the historical, personal, or processual context documenting the pros and cons of their designs or provided supplementary context via comments (). Several mapmakers maintained accountability by adding their names to their alternative designs, situating themselves within their work. Names, however, have been removed from the figures for publication. Contextual information or metadata are conventionally kept separate from the icon themselves. For the original Maki icon set, context on how it was made, who it was made by, and any “issues” in its making are buried within an online digital archive (i.e., Github). In contrast, the gallery of possibilities places context front and center with the feminist map icons and does not separate processual context from the icons. Instead, the icons are rendered incomplete without their underlying contexts ().
In sum, like the small multiples mapping technique, this gallery of possibilities allows viewers to engage more deeply with each icon and how they are made as well as their relationships to power and process in a collaborative environment. The alternative, feminist map icons produced in these workshops curate a gallery of possibilities as they are attentive to intersectionality, varying domains within the matrix of domination, and the underlying context in their designs.
Conclusion
Despite the growing influence of intersectionality, the matrix of domination, and Black feminist thought, more broadly, in mapping and related data and visualization fields, many maps remain rooted in unexamined perspectives of power and privilege. There remains a need to engage and materialize the commitments of Black feminist thought within existing mapping techniques and everyday mapping practices. Black feminist thought opens alternative graphic vocabularies and ways of expressing how power operates in and through data, maps, and mapping processes. When viewed as power-laden processes, feminist mapping requires reflexive accountability and contextualization. Attention to power and context disrupt perceived objectivity and stasis encoded within maps and, instead, stretch mapping as well as feminist thought in new directions. These interventions, however, remain at the margins of or are often strategically erased from mainstream mapping conversations (Kelly Citation2020). As such, there remains a need for feminist mapping methods that center the nuance and complexities of Black feminist conceptualizations of intersectionality, systems of power, and context. To fill this need and to contribute to an evolving feminist mapping toolkit (Kelly and Bosse Citation2022), I introduce a gallery of possibilities as a methodological intervention in mapping that expands traditional thematic mapping techniques, specifically small multiples. Curating in this way destabilizes the presentation of a single decontextualized map by presenting multiple or multipart visualizations that trace variations or material possibilities enabled through mapping processes. I illustrate the five elements of the gallery of possibilities using a case study on feminist map icons. At its core, the gallery of possibilities examines and challenges intersecting systems of power and the context that underpins their making. The gallery of possibilities embraces process by including context like annotations as well as multiple perspectives, iterations, and even incomplete drafts. In sum, the gallery of possibilities offers a feminist mapping method as one tool to nudge and transform contemporary mapping practice. The gallery of possibilities, along with Black feminist thought, expands the range and availability of feminist mapping methods and tools. Together, the gallery of possibilities and Black feminist thought transform everyday contemporary mapping practice.
Acknowledgments
I would like to thank Dr. Karen Falconer Al-Hindi and Dr. LaToya Eaves for the invitation to participate. Your feedback on my first draft and ongoing support throughout the editorial process were exceptionally helpful. I thank the anonymous reviewers for their deep engagement and thoughtful comments. You pushed my thinking, and the article was truly strengthened by your feedback. Special thanks to Dr. Amber Bosse for suggesting my name to the guest editors and, as part of MapBosse Co. (https://www.mapbosse.com/), providing writing support during my revisions. Finally, thank you to my collaborators during the CIVIC Structured Context Program and Catherine D’Ignazio for sparking insights into what the gallery of possibilities could become.
Additional information
Notes on contributors
Meghan Kelly
MEGHAN KELLY is an Assistant Professor in the Department of Geography at Durham University, Durham DH1 3LE, UK. E-mail: [email protected]. Her research interests include feminist and transformative mapping, feminist digital geographies, and digital storytelling.
Notes
1 My epistemological leanings recognize and embrace the situatedness and partiality of data, mapping, and historizations in academic thought, perspectives that remain at odds within GIScience conversations. Like the broader academic arena, White, cisgendered, masculinist, and ableist ideals permeate GIScience curriculum, including those in which I was indoctrinated. My own position as White, cisgendered, nondisabled, educated, middle class, woman, and settler on Indigenous land has directly benefited from and is further imbued within the matrix of domination. Yet, the power that I wield continually shifts, affecting the pressure points of my own interventions. When I submitted this article, I was a postdoctoral scholar on a one-year contract navigating a crumbling job market amidst the ongoing pandemic. My race, class, cisgendered identity, and nondisabled body along with a PhD from a “land-grab university” (see https://www.landgrabu.org/ for details) helped me secure an academic position in the United Kingdom where I now navigate academic and social structures as an immigrant, albeit an American immigrant with relative power. Given these shifting positionings, I remain accountable to the work and narratives that I produce now and into the future.
2 The visuality of mapping has been critiqued from multiple perspectives and here, I touch on two. First, feminist scholars critique presumed objectivity imbued within maps given traditional top-down perspectives, otherwise known as the God’s-eye view, that present the world from an omnipotent and “all-seeing” maker (Kwan Citation2002a; Kelly Citation2021). The visuality of maps presented in this way erases the power and influence of the mapmakers and their role in shaping partial worldviews indoctrinated within systems of power. Second, maps and mapping practices are often reliant on visual practice despite growing bodies of cartographic work that rely on alternative bodily senses like touch (Cole Citation2021). Further, the dominance of visuality in mapping or their ocular-centrism can also be critiqued from a disability justice perspective as a majority of maps produced today are not accessible to many groups of people (Lee Citation2020).
3 Relief maps are conventionally used to depict changes in elevation or terrain using a variety of techniques like shading or hachuring to provide a three-dimensional illusion (Kennelly Citation2017). They are most frequently used to illustrate mountainous landscapes (see https://www.swisstopo.admin.ch/ and http://www.mountaincartography.org/ for examples).
4 Colloquially, heat maps illustrate the magnitude of a particular spatial phenomenon using gradations or shades of a color and sometimes two or more colors. They are used to identify hot spots or areas of high concentrations of a particular spatial phenomenon (Slocum et al. Citation2008).
5 For me, this concept originated in CIVIC’s (Citation2020) Structued Context Program, an interdisciplinary working group organized and facilitated by the CIVIC Software Foundation and inspired by a Data Feminism (D’Ignazio and Klein Citation2020) reading group. Librarians, designers, educators, community organizers, and others came together to envision and develop methods and tools for “collecting, documenting, and sharing contextual information about public datasets” that are grounded in principles of intersectionality and the matrix of domination (CIVIC Citation2020). I worked with a team to devise strategies that document and share data context. To avoid prescription, we created “a catalog of possibilities” to illustrate multiple ways of bringing data context into public conversation. Our catalog prioritized data context as dynamic processes, not static objects. I revisited the catalog of possibilities while writing a feminist mapping book chapter (Kelly Citation2020) where I overviewed feminist mapping practice with real-world interventions. I drew on feminist principles for data science outlined by D’Ignazio and Klein (Citation2018, 2020), including examining and challenging power, considering context, embracing pluralism, representing uncertainty, elevating embodiment, rethinking binaries, and making labor visible. In their work on data feminism, D’Ignazio and Klein (Citation2018, 2020) distilled feminist ideas into a series of feminist principles. The number and names of these feminist principles have fluctuated and changed over time. These changes are reflected in their publications and presentations on data feminism, which further illustrates how theory and writing, much like mapping, are ongoing processes. I then adapted the principles to mapping contexts by illustrating each with multiple examples, not wanting to prioritize any singular example. I envisioned this chapter as a visual introduction to feminist mapping that I started calling a “gallery of possibilities,” a shift from “catalog,” given the visuality of mapping. The gallery collated and reappropriated “feminist perspectives in mapping and geospatial technology, perspectives lost within historical and contemporary” mainstream mapping (Kelly Citation2020, 21). In time, the gallery of possibilities became a metaphor that I routinely returned to in my writing and mapping. As I ruminated on the concept (and after some prompting from a mentor), the gallery of possibilities crystallized as a feminist mapping method.
Literature Cited
- Anti-Eviction Mapping Project. n.d. Anti-Eviction Mapping Project. Accessed February 24, 2023. https://antievictionmap.com/
- Bailey, M. M., and R. Shabazz. 2014. Gender and sexual geographies of Blackness: New Black cartographies of resistance and survival (part 2). Gender, Place and Culture 21 (4):449–52. doi: 10.1080/0966369X.2013.786303.
- Bell, S. 2020. Map icon design. In The geographic information science and technology body of knowledge, ed. J. P. Wilson. Ithaca: University Consortium for Geographic Information Science. doi: 10.22224/gistbok/2020.1.6.
- Benjamin, R. 2019. Race after technology: Abolitionist tools for the new Jim code. Cambridge, UK: Polity Press. doi: 10.1093/sf/soz162.
- Bley, K., K. Caldwell, M. Kelly, J. Loyd, R. E. Roth, T. M. Anderson, A. Bonds, J. Plevin, D. Madison, C. Spencer, et al. 2022. A design challenge for transforming justice. GeoHumanities 8 (1):344–65. doi: 10.1080/2373566X.2021.1986100.
- Bosse, A. 2020. Cartographic efficacy: Histories of the present, participatory futures. PhD diss., University of Kentucky. doi: 10.13023/etd.2020.491.
- Brown, M., and L. Knopp. 2008. Queering the map: The productive tensions of colliding epistemologies. Annals of the Association of American Geographers 98 (1):40–58. doi: 10.1080/00045600701734042.
- CIVIC. 2020. Structured context program. Accessed November 24, 2020. https:/civicsoftwarefoundation.org/posts/structured-context-data-feminism.
- Coddington, K., and J. Williams. 2021. Feminist visualization 2021: Mobilities, sovereignties, borders. Accessed February 22, 2023. https://femvizchallenge2021.weebly.com/.
- Cole, H. C. 2021. Tactile maps for flood mitigation planning: Design and evaluation. PhD diss., Pennsylvania State University.
- Collins, P. H. 2009. Black feminist thought: Knowledge, consciousness, and the politics of empowerment. London and New York: Routledge.
- Combahee River Collective. 1977. The Combahee River Collective statement. In How we get free: Black feminism and the Combahee River Collective, ed. K.-Y. Taylor, 15–27. Chicago: Haymarket Books.
- Costanza-Chock, S. 2020. Design justice: Community-led practices to build the worlds we need. Cambridge, MA: MIT Press.
- COVID Black. n.d. Home page. Accessed November 24, 2020. https://www.covidblack.org/.
- Crenshaw, K. 1989. Demarginalizing the intersection of race and sex: A Black feminist critique of antidiscrimination doctrine, feminist theory and antiracist politics. University of Chicago Legal Forum 1989 (1):139–67. http://chicagounbound.uchicago.edu/uclf/vol1989/iss1/8
- D’Ignazio, C., and L. Klein 2020. Data feminism. Cambridge, MA: MIT Press.
- D’Ignazio, C., and L. Klein. 2018. Data feminism: Collection, analysis, visualization and power. Lecture presented at University of Wisconsin–Madison. Madison, WI, February 16.
- Edney, M. H. 2019. Cartography: The ideal and its history. Chicago: University of Chicago Press.
- Elwood, S. 2006. Critical issues in participatory GIS: Deconstructions, reconstructions, and new research directions. Transactions in GIS 10 (5):693–708. doi: 10.1111/j.1467-9671.2006.01023.x.
- Elwood, S., and A. Leszczynski. 2018. Feminist digital geographies. Gender, Place and Culture: A Journal of Feminist Geography 25 (5):1–16. doi: 10.1080/0966369X.2018.1465396.
- Fish, C. S. 2018. Spatiotemporal representation. In The geographic information science & technology body of knowledge, ed. J. P. Wilson. Ithaca: University Consortium for Geographic Information Science. doi: 10.22224/gistbok/2018.4.6.
- Gallon, K. 2020a. “Care” and COVID-19: A call for Black feminist data analytics, Part II. Medium. Accessed July 4, 2022. https://medium.com/@ktgallon/care-and-covid-19-a-call-for-black-feminist-data-analytics-part-ii-77d903f0d9e2.
- Gallon, K. 2020b. A review of COVID-19 intersectional data decision-making: A call for Black feminist data analytics. Medium. Accessed March 14, 2022. https://medium.com/@ktgallon/a-review-of-covid-19-intersectional-data-decision-making-a-call-for-black-feminist-data-analytics-da8e12bc4a6b.
- Gebru, T., J. Morgenstern, B. Vecchione, J. Wortman, Vaughan, H. Wallach, H. Daumé, III, and K. Crawford. 2020. Datasheets for datasets. arXiv. http://arxiv.org/abs/1803.09010.
- Gilbert, M. R., and M. Masucci. 2006. The implications of including women’s daily lives in a feminist GIScience. Transactions in GIS 10 (5):751–61. doi: 10.1111/j.1467-9671.2006.01026.x.
- Haraway, D. 1988. Situated knowledges: The science question in feminism and the privilege of partial perspective. Feminist Studies 14 (3):575. doi: 10.2307/3178066.
- Harding, S. G. 1986. The science question in feminism. Ithaca, NY: Cornell University Press.
- Jung, J.-K., and S. Elwood. 2010. Extending the qualitative capabilities of GIS: Computer-aided qualitative GIS. Transactions in GIS 14 (1):63–87. doi: 10.1111/j.1467-9671.2009.01182.x.
- Kelly, M. 2020. Feminist mapping: Content, form, and process. Madison: University of Wisconsin–Madison.
- Kelly, M. 2021. Mapping bodies, designing feminist icons. GeoHumanities 7 (2):529–57. doi: 10.1080/2373566X.2021.1883455.
- Kelly, M., and A. Bosse. 2022. Pressing pause, “doing” feminist mapping. ACME: An International Journal for Critical Geographies 21 (4):399–415. https://acme-journal.org/index.php/acme/article/view/2083.
- Kennelly, P. 2017. Terrain representation. In The geographic information science and technology body of knowledge, ed. J. P. Wilson. Ithaca: University Consortium for Geographic Information Science. doi: 10.22224/gistbok/2017.4.9.
- Kitchin, R., and M. Dodge. 2007. Rethinking maps. Progress in Human Geography 31 (3):331–44. doi: 10.1177/0309132507077082.
- Knigge, L., and M. Cope. 2006. Grounded visualization: Integrating the analysis of qualitative and quantitative data through grounded theory and visualization. Environment and Planning A: Economy and Space 38 (11):2021–37. doi: 10.1068/a37327.
- Kwan, M.-P. 2002a. Feminist visualization: Re-envisioning GIS as a method in feminist geographic research. Annals of the Association of American Geographers 92 (4):645–61. doi: 10.1111/1467-8306.00309.
- Kwan, M.-P. 2002b. Introduction: Feminist geography and GIS. Gender, Place and Culture: A Journal of Feminist Geography 9 (3):261–62. doi: 10.1080/0966369022000003860.
- Lee, C. 2020. Data by touch. Paper presented at North American Cartographic Information Society annual conference, online, October 16.
- Maharawal, M. M., and E. McElroy. 2018. The anti-eviction mapping project: Counter mapping and oral history toward Bay Area housing justice. Annals of the American Association of Geographers 108 (2):380–89. doi: 10.1080/24694452.2017.1365583.
- McLafferty, S. L. 2002. Mapping women’s worlds: Knowledge, power and the bounds of GIS. Gender, Place and Culture 9 (3):263–69. doi: 10.1080/0966369022000003879.
- McKittrick, K. 2006. Demonic grounds: Black women and the cartographies of struggle. Minneapolis: University of Minnesota Press.
- Million Dollar Hoods. n.d. Million Dollar Hoods. Accessed August 20, 2020. https://milliondollarhoods.pre.ss.ucla.edu/.
- Miro Boards. n.d. The online whiteboard for easy collaboration. Accessed October 23, 2022. https://miro.com/online-whiteboard/.
- Mohanty, C. T. 2003. Feminism without borders: Decolonizing theory, practicing solidarity. Durham, NC: Duke University Press.
- Nash, J. C. 2019. Black feminism reimagined: After intersectionality. Durham, NC: Duke University Press.
- National Park Service. 2018. Symbol library. Accessed October 23, 2022. https://www.nps.gov/maps/tools/symbol-library/index.html.
- Nelson, J. 2020. Multivariate mapping. In The Geographic Information Science and Technology Body of Knowledge, ed. J. P. Wilson. Ithaca: University Consortium for Geographic Information Science. doi: 10.22224/gistbok/2020.1.5.
- Pavlovskaya, M. E. 2002. Mapping urban change and changing GIS: Other views of economic restructuring. Gender, Place and Culture: A Journal of Feminist Geography 9 (3):281–89. doi: 10.1080/0966369022000003897.
- Pavlovskaya, M. 2006. Theorizing with GIS: A tool for critical geographies? Environment and Planning A 38:2003–20.
- Pearce, M. W. 2014. The last piece is you. The Cartographic Journal 51 (2):107–22. doi: 10.1179/1743277414Y.0000000078.
- Ricker, B. 2018. Reflexivity, positionality and rigor in the context of big data research. In Thinking big data in geography: New regimes, new research, ed. J. Thatcher, A. Shears, and J. Eckert, 96–118. Iowa City: University of Iowa Press.
- Rodó-de-Zárate, M. 2014. Developing geographies of intersectionality with relief maps: Reflections from youth research in Manresa, Catalonia. Gender, Place and Culture: A Journal of Feminist Geography 21 (8):925–44. doi: 10.1080/0966369X.2013.817974.
- Schuurman, N., and A. Leszczynski. 2006. Ontology-based metadata. Transactions in GIS 10 (5):709–26. doi: 10.1111/j.1467-9671.2006.01024.x.
- Schuurman, N., and G. Pratt. 2002. Care of the subject: Feminism and critiques of GIS. Gender, Place and Culture: A Journal of Feminist Geography 9 (3):291–99. doi: 10.1080/0966369022000003905.
- Slocum, T. A., R. M. McMaster, F. C., Kessler, H. H. Howard, and R. B. McMaster. 2008. Thematic cartography and geographic visualization. 3rd ed. New Jersey: Prentice Hall.
- Yang, S., A. Bosse, L. Gray, K. Helena, and M. Kelly. 2021. Feminist mapping: Past, present, and futures. Panel presented at Feminist Visualization 2021: Mobilities, Sovereignty, Borders online, February 26.