
Abstract
In September 2022, Hurricane Ian made landfall in southwest Florida, causing an estimated $67 billion in damage and the loss of almost 150 lives. Before this date, demand and house prices in this area were rising faster than anywhere else in the country. What did homeowners in southwest Florida believe about flood risk to their own homes, and what did real estate agents believe about the role of flood risk in the residential housing market? The survey research summarized in this article shows that not only did residents feel that they were not particularly at risk from flooding, but also that damaging floods would not affect future home values in their neighborhoods or for their own homes. We found that political party affiliation was strongly correlated with the direction and strength of these beliefs. Real estate agents also reported strong demand for low-elevation coastal housing, noting that coastal lifestyle outweighed the prospect of flooding in residential decision-making. They also observed that the detailed maps of flood risk that are now available at realtor.com for anyone browsing for houses for sale had no effect on homebuyers, and that most of their customers were generally unconcerned with flood risk.
2022年9月, 飓风伊恩在美国佛罗里达州西南部登陆, 造成约670亿美元的损失, 近150人丧生。在飓风来临之前, 该地区住房需求和房价的上涨速度超过美国其它地区。佛罗里达州西南部的房主如何看待其住房所面临的洪水风险?房地产经纪人如何看待洪水风险在住房市场中的作用?本文的调查研究结果表明, 居民不仅觉得他们没有洪水风险, 而且认为破坏性洪水不会影响社区或个人的住房价值。我们发现, 党派归属与这些看法的指向和强度密切相关。房地产经纪人还称, 低海拔沿海住房的需求强劲, 在选择住房时沿海生活方式比洪水可能性更重要。realtor.com为浏览待售房屋的客户所提供的洪水风险详图, 并没有影响购房者, 大多数客户通常并不关心洪水风险。
En septiembre del 2022, el Huracán Ian tocó tierra en el sudoeste de Florida, ocasionando daños calculados en unos 67.000 millones de dólares y la pérdida de cerca de 150 vidas. Antes de esta fecha, la demanda y los precios de la vivienda en esta área se incrementaban más rápidamente que en cualquiera otra parte del país. ¿Qué creían los propietarios de viviendas del sudoeste de Florida sobre el riesgo de inundación que pesaba sobre sus propias casas, y qué creían los agentes inmobiliarios acerca del rol del riesgo de inundación en el mercado inmobiliario residencial? La encuesta de investigación que se resume en este artículo muestra que los residentes no solo creían estar particularmente exentos de riesgo de inundación, sino también que las inundaciones dañinas no afectarían el futuro valor de las viviendas en sus vecindarios, o el de sus propias residencias. Encontramos que la afiliación a un partido político estaba fuertemente correlacionada con la dirección y fortaleza de tales creencias. Los agentes de finca raíz también informaron de una fuerte demanda de viviendas costeras de baja elevación, haciendo notar que el estilo de vida costero tenía más peso que el prospecto de inundación en la toma de decisiones sobre localización residencial. Ellos también observaron que los mapas detallados sobre riesgo de inundación, disponibles en realtor.com para cualquiera que busque información sobre casas para la venta, no tenían ningún efecto sobre los compradores de vivienda, y que la mayoría de sus clientes generalmente estaba despreocupada por el riesgo de inundación.
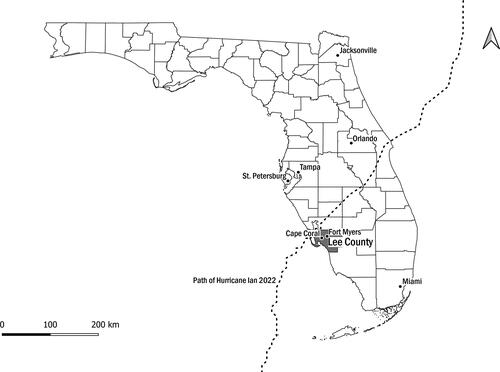
On 28 September 2022, a Category 4 hurricane with sustained winds of 150 miles per hour made landfall in southwest Florida. An investigation by NBC News reporters involving extensive reviews of local and state police agencies, medical examiners’ offices, and emergency management agencies attributed 148 deaths related to Hurricane Ian, of which 119 were caused by “flooding, winds and other dangerous conditions during the storm” (Schuppe et al. Citation2022). Although the hurricane affected some areas inland, most of the reported deaths were in Lee County, including Fort Myers and Cape Coral (). Just before this hurricane, record numbers of new residents were moving into these and other communities in southwest Florida, and coastal housing was in high demand despite rapidly rising prices.
Figure 1 Track of Hurricane Ian, 2022.
Two questions are addressed in this article: (1) Were homeowners aware of and concerned by the flood risks to their homes? (2) Did real estate professionals believe that homebuyers in southwest Florida were concerned enough about flood risks to affect the property market? To answer these questions, the authors conducted two surveys: the first in late 2018 of homeowners in south Florida, and the second in late 2020 of real estate agents in south Florida. Before reporting on the survey results, we review previous research concerning perceived risk of increased storm intensity and flooding associated with climate change, with particular reference to the influence of partisanship, as well as a description of the landscape of available risk information in southwest Florida.
Perceived Vulnerability to Climate Change and Flood Risks
Sea-level rise linked to global climate change threatens coastal regions across the world and could displace millions of people and cause massive economic and environmental damage (Hinkel et al. Citation2014; Hauer, Evans, and Mishra Citation2016). Yet the threats posed by flooding because of rising seas are not viewed as a salient issue among much of the U.S. public due to, at least in part, perceptions that it will only affect populations in distant locations or future generations (Rayner and Malone Citation1997; Leiserowitz Citation2005; Moser and Dilling Citation2007; Akerlof et al. Citation2010; Lewandowsky Citation2021). Nonetheless, experiencing storms, flooding, or wildfires firsthand has been shown to increase the salience of climate-related risk perceptions, particularly if these events are attributed to climate change (Spence et al. Citation2011; Egan and Mullin Citation2012; Akerlof et al. Citation2013; Howe and Leiserowitz Citation2013; Myers et al. Citation2013; Ogunbode et al. Citation2019). Therefore, “personalizing climate risk messages” by emphasizing local and concrete impacts has been recommended as a way to increase its salience and decrease its psychological distance (Spence and Pidgeon Citation2010; McDonald, Chai, and Newell Citation2015).
The empirical evidence that has accumulated on the effects of personalizing the risks of climate change yields mixed results. Some studies demonstrate increased awareness resulting from exposure to messages that emphasize the local impacts of climate change (Spence et al. Citation2011; Scannell and Gifford Citation2013; Brügger et al. Citation2015). Other studies report no effect of exposure to such information (Shwom, Dan, and Dietz Citation2008; Schuldt, Rickard, and Yang Citation2018), whereas still others have found this type of information can reduce concern among those likely to be affected by climate change (Spence and Pidgeon Citation2010; Devine-Wright Citation2013). Mildenberger, Lubell, and Hummel (Citation2019), for instance, showed that providing locally resolved sea-level rise risk information (e.g., a flood map based on zip code) to individuals decreased concern that sea-level rise would affect them personally.
One hurdle to effective communication about the local effects of climate change, such as flooding due to sea-level rise in coastal locations, is that individuals’ political and ideological orientations can have a greater influence on risk perceptions than physical environmental factors (Howe et al. Citation2014; Howe et al. Citation2015; Cutler et al. Citation2018). A 2022 survey of Americans, for instance, reported that 46 percent of those who identified as “conservative Republican” reported believing that climate change is happening compared to 97 percent of those who identify as a “liberal Democrat.” Similarly, 96 percent of liberal Democrats expressed concern about the effects of climate change causing “harm to future generations” compared with 42 percent of conservative Republicans (Yale Program on Climate Change Communication and George Mason University Center for Climate Change Communication Citation2022). Because preexisting beliefs about climate change and ideological attachments can influence perceived vulnerability to specific risks and how people evaluate personalized risk information, it is important to recognize the psychological, cultural, and political characteristics of audiences and to identify the contexts in which personalized flood risk messages are mostly likely to succeed (McCright and Dunlap Citation2011; Howe and Leiserowitz Citation2013; Mildenberger et al. Citation2017; Druckman and McGrath Citation2019; Egan, Konisky, and Mullin Citation2022).
Should Southwest Florida Residents Be Aware of Flood Risk?
It has been argued that providing more detailed and specific information about flood risk to prospective homebuyers can affect their decisions and make them safer (Rollason et al. Citation2018; Snel et al. Citation2019; Snyder and Kulesza Citation2020; Yi and Choi Citation2020; Hino and Burk Citation2021; Huang and Lubell Citation2022). The State of Florida, along with the states of Missouri, New York, and New Jersey, has been characterized as having among the “worst disclosure laws” with respect to flood history for a property (Rabb Citation2018): No law in Florida requires home sellers or landlords to disclose to new residents that there has been damage to the property from previous floods (Kaufman Citation2021; Harris Citation2022). Despite this, Florida homebuyers have several sources of information about the flood risks associated with any property. These include (1) prior familiarity with the area, (2) information freely available on government Web sites, (3) information obtained in the process of buying the mandatory flood insurance required of those seeking a mortgage loan from a federally insured lender, and (4) information from the real estate industry itself.
Most Florida homebuyers have prior familiarity with the neighborhood because most are moving only a short distance. For example, between 2020 and 2021, 14.4 percent of the population of Lee County changed residence. Of these 104,000 movers, most had lived in a different county but within Florida (65,531) and almost 18 percent were moving within Lee County (19,031; Census Reporter.org Citation2021).
Government Web sites also provide flood maps based on a combination of canal and stream flows, tides associated with storms, rainfall, hydraulic analysis, and topographic surveys. The Federal Emergency Management Agency (FEMA) Web site, as well as those of county governments, provides detailed information about the risks associated with specific properties. For example, for the City of Sanibel, one can view a FEMA map with detailed information on base elevation and flood insurance classification by simply entering an address at the Web site “mysanibel.com” under “FEMA flood insurance rate maps.” Maps of projected flooding are also available from independent organizations such as Climate Central, which has produced “surging seas” risk maps for U.S. coastal areas.
Prospective homebuyers of properties located within a Special Flood Hazard Zone, one that has been designated by FEMA as having at least a 1 percent chance of being flooded in any given year, must obtain flood insurance as a condition of completing the home purchase. In this process, the buyer must obtain an “elevation certificate” containing information about the elevation of the bottom floor or basement, the garage, and the machinery or equipment that services the building such as the heating system. From this elevation certificate, the reader can deduce the effect of storm surge likely to affect the property.
Finally, detailed information about flood risk is available to anyone doing an Internet search of properties for sale. In August 2020, the First Street Foundation reached an agreement with the National Association of Realtors to include their maps, now known as “Flood Factor,” on all listings (First Street Foundation Citation2021). Maps of estimated depth of flooding from a combination of rain, rivers, tides, and storm surge is displayed for individual property listings. Each property is also assigned a risk number ranging from 1 to 10 based on the probability of “inundation of 5 cm or more to the building in the 500-year return period” or 0.2 percent annual risk (First Street Foundation Flood Model). In sum, despite the absence of state or federal law mandating the disclosure of previous flooding to the particular house, flood risk information is easily available to prospective Florida homebuyers.
Homeowner Perception of Flood Risk in Southwest Florida
To assess the response of south Florida residents to an environment susceptible to rising sea levels and an increasing intensity of devastating storms, we administered a survey to approximately 1,000 residents in 166 coastal zip codes (Palm and Bolsen Citation2020). In the last three months of 2018, Qualtrics solicited panel respondents residing in the zip codes that we had identified, leveraging the “routers” of its partners to “select respondents for surveys where respondents are highly likely to qualify” (Qualtrics Citation2014). We prespecified quotas with respect to party and gender: Half of the respondents were to be women, and one-third of the respondents were to be Republicans, one-third Democrats, and one-third independents. Of the full set of approximately 1,000 respondents, 461 were homeowners living in southwest Florida, and we focus on this subset of respondents in the analyses reported here. Most of the southwest Florida respondents were long-term residents, with the median time in Florida being twenty-two years. Notably, despite their location in flood-prone areas, only 38 percent responded that they had flood insurance in addition to their homeowner’s policy.
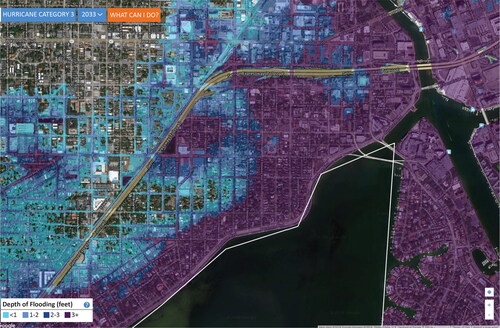
We embedded a randomized experiment within the survey of homeowners to evaluate the effects of exposure to local visual information from the FloodIQ.com Web site (FloodIQ.com 2018). Respondents were randomly assigned to a treatment (n = 230) or control condition (n = 231). Individuals in the control condition received the questionnaire but with no supplemental information about projected flooding. Individuals in the treatment group were provided with a local map detailing storm-surge-related flooding associated with a Category 3 hurricane on the Saffir-Simpson scale projected for fifteen years from now, given present rates of sea-level rise. Treated respondents in southwest Florida were presented with one of three maps corresponding with their location: Fort Myers-Cape Coral, St. Petersburg, or Tampa.Footnote1 Thus, we were testing two conditions: respondents not presented with a map within the questionnaire and respondents who were presented with such a local map. The maps were at a scale that would permit the respondents to easily locate their own residence if they lived within the area portrayed Some of the respondents lived in outlying suburbs of these cities, and although they would have been familiar with the area portrayed, they would not have been able to visualize their own home. They were also provided with the source Web site information (FloodIQ.com) where they could have looked up their own home address for more detailed information. We expected an effect from such a treatment based on the results of previous research that has shown that maps, moving pictures, and photos have been shown to have powerful impacts on public opinion, particularly when they reduce the “psychological distance” between the viewer and the impacts of flooding (Leiserowitz Citation2006; Sheppard et al. Citation2011; O’Neill Citation2013; Hart and Feldman Citation2016). For example, images have been found to have a greater impact if they portray the local effects of sea-level rise and climate change on audiences rather than portrayals of effects on exotic species or locations such as polar bears at the North Pole (Lorenzoni, Nicholson-Cole, and Whitmarsh Citation2007; Pidgeon and Fischhoff Citation2011; Myers et al. Citation2012; Bolsen, Kingsland, and Palm Citation2018; Feldman and Hart Citation2018; Retchless Citation2018).
We asked about homeowners’ beliefs that climate change is happening (on a scale from 1 [definitely not] to 7 [definitely happening]), that it is responsible for more intense storms (on a scale from 1 [not at all] to 5 [a great deal]), that sea-level rise is related to climate change (on a scale from 1 [definitely is not] to 7 [definitely is]), that their home is susceptible to sea-level rise (on a scale from 1 [definitely not] to 7 [definitely yes]), and the extent that sea-level rise would have an effect on their property’s value (on a scale from 1 [none at all] to 5 [a great deal]). The survey questionnaire appears in the Appendix.
For the full set of respondents (“all”), we found that exposure to the image showing the projected flooding that would occur from a direct hit from a Category 3 hurricane had virtually no impact on homeowners’ beliefs about whether climate change is happening, whether it is causing more intense storms, or the degree to which sea-level rise is related to climate change (). Instead, political affiliation had a dramatic effect. The sample in southwest Florida included 191 homeowners who identified as Republicans, 142 who identified as independents, and 128 who identified as Democrats. For Democrat homeowners in the control and treatment conditions, mean scores were 4.3 and 4.2, respectively (on a 5-point scale), on the question that asked if climate change is responsible for more intense coastal storms, in other words, an average score of between a lot and a great deal. Average scores for Republican homeowners on this question in the control and treatment conditions were 2.8 and 2.3, respectively (i.e., between a little and a moderate amount on the response scale). In other words, consistent with national opinion trends, we observe significant levels of partisan polarization in comparing Democrats’ and Republicans’ beliefs in both the treated and control conditions in these areas of southwest Florida directly threatened by coastal flooding due to climate change. We also found differences in the effect of the treatment on climate change beliefs by party. There was a significant negative shift among Republican homeowners who were exposed to the projected flood map of their local communities. In other words, the treated Republican respondents were less likely than Republican homeowners in the control condition to believe that climate change is happening (p = .05, two-tailed t test), that it is causing more intense coastal storms (p = .01, two-tailed t test), or that sea-level rise is related to climate change (p = .09, two-tailed t test).Footnote2
Table 1 Experimental treatment effect on homeowners’ beliefs
Finally, we asked respondents if their own “home is susceptible to sea-level rise,” and, if sea-level rise occurs, the “extent to which will it reduce the property value of your own home.” The experimental treatment (i.e., the local flood map) had no effect on any respondents’ beliefs about the threat of sea-level rise to their own home or its impact on their property’s value. The party identification of respondents had an influence on reported susceptibility to sea-level rise, however (). Across the entire sample of homeowners in southwest Florida, 38 percent of Republicans, 42 percent of Democrats, and 55 percent of independents believed that their home is susceptible to flooding due to sea-level rise. Party identification also affected homeowners’ views as to whether their property values would be reduced by sea-level rise. For Republican homeowners, 55 percent reported that sea-level rise would affect their property’s value either not at all or a little, whereas only 38 percent of Democrats and 36 percent of independents expressed the same view. Further, only a quarter of Republicans reported that sea-level rise would affect their property’s value moderately or a great deal, whereas 37 percent of Democrats and 44 percent of independents expressed those views. The results from our survey of homeowners living in southwest Florida reveal high levels of partisan polarization on climate change and toward localized flood risks; consequently, it might not be surprising that we did not observe any positive effect of providing information about flood risks to residents who live and own property in these coastal locations. This polarization can also generate resistance to public policies seeking to address the environmental and social impacts that will occur even in local areas where people’s property and lives are directly at risk (Egan, Konisky, and Mullin Citation2022).
Table 2 Belief that own home is susceptible to sea-level rise and will affect property’s value
Real Estate Agent Opinions before the Hurricane
Several studies have found evidence of the negative impact of sea-level rise on low-elevation coastal property values (Kropp Citation2012; Keenan, Hill, and Gumber Citation2018; McAlpine and Porter Citation2018; Ortega and Taspinar Citation2018; Bernstein, Gustafson, and Lewis Citation2019; Harrison, Smersh, and Schwartz Citation2011; Fu and Nijman Citation2021). These studies are based on econometric analyses of house price trends, comparing areas that are relatively more or less vulnerable to flooding. In contrast to these findings, our survey of homeowners had found little concern about future home values, even when the respondents were shown flood maps of their own neighborhood. Because of this discrepancy, we wanted to get another perspective on how the housing market is currently integrating flood hazard by seeking the perspective of those professionals working in the real estate market every day who monitor the changing preferences of homebuyers: the real estate agents.
From September through November 2020, we administered an Internet-based survey to real estate brokers and sales associates with office addresses in thirteen counties in south Florida (Palm and Bolsen Citation2022). The names and e-mail addresses of these agents were obtained from the Email List Company, one of many companies that compile listings of e-mail addresses of various occupational groups to sell to marketers. The cover letter inviting the real estate brokers to respond promised a $10 Amazon gift card for completing the survey, and the letter to the sales associates promised a $1 gift card. Over the course of 19 October to 4 November, we e-mailed surveys to the list of all 15,388 brokers, and from 16 to 23 November, to the list of 80,059 sales associates with business offices in South Florida.Footnote3 Individuals who had not contacted us to “opt out” and who had not submitted the survey were recontacted twice after three days and after seven days to remind them to complete the survey.
The south Florida-wide respondent pool consisted of 330 brokers and 350 sales associates, all affiliated with the Florida Association of Realtors. Of these, 94 brokers and 104 sales associates listed and sold property in southwest Florida. In this article, we analyze the responses of 198 southwest Florida real estate agents, focusing on the cities including Tampa, St. Petersburg, Fort Myers, Cape Coral, Sarasota, and Venice that were particularly affected by Hurricane Ian.
The respondents were experienced real estate agents, 62 percent of whom had been in the profession for more than ten years. Most (72 percent) had lived in Florida for more than ten years. Their median age was fifty-eight, they were almost equally divided between male and female, and 71 percent identified their race as White, with another 17 percent identified as Hispanic. Almost all reported having had at least some college (95 percent) and most at least a bachelor’s degree (78 percent). Most described themselves as Republican (43 percent) or independent (31 percent). The respondents were very experienced with the housing market and their responses were of high quality, including comments on several open-ended questions.
The key issue we were investigating in this survey was whether real estate agents found that prospective buyers were avoiding low-lying areas susceptible to flooding, and whether they agreed that house prices in low-elevation coastal areas were either falling or not rising as rapidly as houses elsewhere. Related to these questions, we wanted to see whether they had experienced either lenders or appraisers considering property elevation or susceptibility to coastal flooding in their decisions.
The real estate agents who responded to this survey generally reported that buyers were not avoiding low-elevation property, with a total of 28 percent saying “somewhat frequently,” “very frequently,” or “all the time.” Respondents explained that:
There is only so much water and beach, and the demand remains strong.
Coastal properties will always be a luxury in demand items and people with money will pay for them.
We are six feet above sea level and drain very quickly. My city even as a peninsula has never flooded.
Most buyers who are looking in flood-prone neighborhoods know the risks that come with it and realize south Florida in general is flood prone. It is a way of life that buyers recognize.
Buyers consider the proximity of waterfront homes. The closer to the river, the better it is for boating. Flood insurance is available, and they are willing to take the risk.
Not too often do they avoid these areas. Flood insurance is not near as expensive as people are led to believe. The issue is basically irrelevant to cash buyers.
The cost of homeowners insurance and flood insurance is more of a deterrent, than the possibility of property loss due to flooding.
The cost of flood insurance is a HUGE factor.
One of the services commonly performed by real estate agents is the linkage of buyers with mortgage lenders and home appraisers (Weintraub Citation2020). They would therefore have had opportunities to observe the response of these groups to low-lying property, with lenders declining loan applications or increasing charges, and appraisers considering elevation or the likelihood of flooding in their assessment of home value. Previous econometric research on this issue has produced conflicting results, with Nguyen et al. (Citation2020) identifying a “sea-level rise premium” in interest rates, whereas Keys and Mulder (Citation2020) concluded that lenders have not been responding to this risk. The real estate agents reported little concern from lenders, with 81 percent saying that they rarely or never observed a lender response. Sixty percent said that they rarely or never observed appraisers considering elevation or flood susceptibility.
Real Estate Agent Perspective on the Five- to Ten-Year Future
Finally, we wanted their perspective on how flooding would affect the housing market in southwest Florida over the next five to ten years. We expected that the real estate agents might be unduly optimistic about the future of flood-prone areas because such optimism serves their interests in selling houses. We asked, “How do you see the near-term future for residential property in low-elevation coastal areas? Will the residential property market see less demand and lower prices in areas prone to flooding in the next five to ten years?” Response options ranged from little or no effect to large effects of flooding. Less than 10 percent of the survey respondents predicted a large or very large effect of flooding on the housing market, and almost 30 percent predicted no effect or almost no effect.
We found no impact of either political affiliation or belief in the reality of climate change or sea-level rise in differentiating the distribution of this response. In a supplemental survey conducted in December 2020 to seek elaborations on these responses, we got these explanations:
I don’t believe the demand for coastal property will diminish. Humans LOVE their water, sports, boating, the peace and the tranquility of the ocean waves, a sunset over the water. Water has always been a draw for humans, I don’t see that changing.
The Sarasota area is absolutely gorgeous, breathtaking even; it was in the 1970s, is currently, and I’m betting it will continue to be in the future. I truly do not believe humans will ever give up their need to be near the water.
For now, coastal property will be in high demand as a luxury item for many years, but only for homeowners who have a lot of discretionary funds to pay for the additional flood insurance, repairs, and newer, elevated construction projects. Even if they don’t have flood insurance, homeowners with enough cash will be able to repair any flood damage or rebuild newer elevated homes. Wealthy buyers will spend a lot of money to live on the water and I don’t see that changing.
Demand will remain strong. South Florida proved to be an exceedingly strong real estate market this past year, with no indication of that demand slowing anytime soon.
Conclusions
Hurricane Ian wreaked havoc on coastal properties in southwest Florida, hitting communities such as Sanibel Island, Captiva, Fort Myers Beach, Cape Coral, and Fort Myers particularly hard. Before the hurricane, this area had been an attractive destination for homebuyers from abroad as well as from Florida and other parts of the United States, as prospective homebuyers continued to seek coastal property. In our survey, real estate agents reported that lenders and appraisers seemed not to discount property even if it was highly susceptible to coastal flooding.
Our surveys of homeowners and real estate agents in southwest Florida reflect not only the optimism of the market before Hurricane Ian, but also the effect of politicization on the extent to which these actors take flood risk seriously. Republicans in the “treated group” of homeowners (who had been shown flood risk maps) were even less likely than their counterparts in the control condition to believe that their own neighborhoods or homes were at risk or that their property values would not decline. Confirming this view, most real estate agents responded that they had never or rarely had a customer show concern with flood-prone areas, even with house-specific flood maps available from their national trade association, the National Association of Realtors. We note that some of the optimism of the real estate agent respondents to our surveys is likely due to the effects of COVID on the Florida real estate market, given the timing of that survey (late 2020). Writing from this perspective of the spring of 2022, Shwedel (Citation2022) noted that the pandemic accelerated the moves of homebuyers from northern states who were taking advantage of both fewer COVID restrictions and new opportunities for remote working. The recent rise in mortgage interest rates might bring a decrease in such demand from out-of-state buyers, although Florida’s appeal is still projected to result in an increase in new migrants and investors (Kolaj Citation2022).
As estimates of the total flood damage associated with Hurricane Ian mount, homeowners will struggle with insurance reimbursements or face the fact that having no flood insurance has made them liable for high repair costs. This might, at least temporarily, put a halt to price inflation and demand for housing in southwest Florida, although if experience is a guide, this effect could be relatively short in duration (Gallagher Citation2014; Kousky et al. Citation2020). In fact, less than one month following the hurricane’s landfall, the Wall Street Journal included a story with the headline “Home Buyers Flock to Florida Cities Devasted by Hurricane Ian” (Friedman Citation2022). The report noted some of these prospective buyers are seeking distressed or discounted properties, but others are simply continuing to purchase homes in what they have decided is a desirable environment. The housing market in Florida is not immune to other contextual factors such as changes in home mortgage rates or the impacts of the popularity of remote work on household location decisions. Whether or not the reality of the risk of coastal living becomes more integrated into the views of residents and real estate agents will be important to continue to monitor.
Acknowledgments
We would like to thank December Weir, Justin Kingsland, Jeremy Kopkas, Laura Villo, and Chip Hill for their contributions to this research project. Maisunath Amin created the map of the path of Hurricane Ian through the state of Florida. We thank the First Street Foundation for permission to use images from Flood Factor in the questionnaire.
Additional information
Notes on contributors
Risa Palm
RISA PALM is a Professor of Urban Studies and Past Provost, Georgia State University, Atlanta, GA 30303. E-mail: [email protected]. Her research interests include urban geography and environmental hazards.
Toby Bolsen
TOBY BOLSEN is the Zoukis Professor of Politics and Justice in the Department of Political Science, Georgia State University, Atlanta, GA 30303. E-mail: [email protected]. His research interests include political communication, public opinion, political behavior, and energy and environmental politics.
Notes
1 The three maps are included with the questionnaire in the Appendix.
2 We found nearly identical estimates of the treatment effect using ordinary least squares regression with the inclusion of demographic covariates (see Appendix, ).
3 The original list contained errors in e-mail addresses, as well as contact information for individuals who had retired or were no longer in real estate sales, as well as those who specialized in commercial rather than residential sales. The respondents are not a “random sample” of Florida real estate agents, but the sample was of sufficient size and their answers were of high quality, particularly with respect to open-ended questions. Age and demographic characteristics of this sample were comparable to the national average as reported by the National Association of Realtors (Linsell 2020).
Literature Cited
- Akerlof, K., R. DeBono, P. Berry, A. Leiserowitz, C. Roser-Renouf, K. L. Clarke, A. Rogaeva, M. C. Nisbet, M. R. Weathers, and E. W. Maibach. 2010. Public perceptions of climate change as a human health risk: Surveys of the United States, Canada, and Malta. International Journal of Environmental Research and Public Health 7 (6):2559–2606. doi: 10.3390/ijerph7062559.
- Akerlof, K., E. W. Maibach, D. Fitzgerald, A. Y. Cedeno, and A. Neuman. 2013. Do people “personally experience” global warming, and if so how, and does it matter? Global Environmental Change 23 (1):81–91. doi: 10.1016/j.gloenvcha.2012.07.006.
- Bernstein, A., M. T. Gustafson, and R. Lewis. 2019. Disaster on the horizon: The price effect of sea-level rise. Journal of Financial Economics 134 (2):253–72. doi: 10.1016/j.jfineco.2019.03.013.
- Bolsen, T., J. Kingsland, and R. Palm. 2018. The impact of frames highlighting coastal flooding in the USA on climate change beliefs. Climatic Change 147:359–68. doi: 10.1007/s10584-018-2143-0.
- Brügger, A., S. Dessai, P. Devine-Wright, T. A. Morton, and N. F. Pidgeon. 2015. Psychological responses to the proximity of climate change. Nature Climate Change 5 (12):1031–37.
- Census Reporter.org. 2022. Lee County, FL. Accessed October 11, 2022. https://censusreporter.org/profiles/05000US12071-lee-county-fl/.
- Cutler, M. J., J. R. Marlon, P. D. Howe, and A. Leiserowitz. 2018. The influence of political ideology and socioeconomic vulnerability on perceived health risks of heat waves in the context of climate change. Weather, Climate, and Society 10 (4):731–46. doi: 10.1175/WCAS-D-17-0105.1.
- Devine-Wright, P. 2013. Think global, act local? The relevance of place attachments and place identities in a climate changed world. Global Environmental Change 23 (1):61–69. doi: 10.1016/j.gloenvcha.2012.08.003.
- Druckman, J. N., and M. C. McGrath. 2019. The evidence for motivated reasoning in climate change preference formation. Nature Climate Change 9 (2):111–19. doi: 10.1038/s41558-018-0360-1.
- Egan, P. J., D. M. Konisky, and M. Mullin. 2022. Ascendant public opinion: The rising influence of climate change on Americans’ attitudes about the environment. Public Opinion Quarterly 86 (1):134–48.
- Egan, P. J., and M. Mullin. 2012. Turning personal experience into political attitudes: The effect of local weather on Americans’ perceptions about global warming. The Journal of Politics 74 (3):796–809.
- Federal Emergency Management Agency (FEMA). 2021. Risk Rating 2.0: Equity in action. Accessed October 11, 2022. https://www.fema.gov/flood-insurance/risk-rating.
- Feldman, L., and P. S. Hart. 2018. Is there any hope? How climate change news imagery and text influence audience emotions and support for climate mitigation policies. Risk Analysis: An Official Publication of the Society for Risk Analysis 38 (3):585–602. doi: 10.1111/risa.12868.
- First Street Foundation. 2021. The cost of climate: America’s growing flood risk. Accessed October 11, 2022. https://assets.firststreet.org/uploads/2021/02/The_Cost_of_Climate_FSF20210219-1.pdf.
- Friedman, R. A. 2022. Home buyers flock to Florida cities devasted by Hurricane Ian. Wall Street Journal. Accessed January 7, 2023. https://www.foxbusiness.com/real-estate/homebuyers-flock-florida-cities-devastated-hurricane-ian.
- Fu, X., and J. Nijman. 2021. Sea level rise, homeownership, and residential real estate markets in south Florida. The Professional Geographer 73 (1):62–71. doi: 10.1080/00330124.2020.1818586.
- Gallagher, J. 2014. Learning about an infrequent event: Evidence from flood insurance take-up in the United States. American Economic Journal: Applied Economics 6 (3):206–33. doi: 10.1257/app.6.3.206.
- Harris, A. 2022. Has your house or apartment flooded before? In Florida, good luck finding out. Accessed October 11, 2022. https://wusfnews.wusf.usf.edu/environment/2022-06-25/has-your-house-or-apartment-flooded-before-in-florida-good-luck-finding-out.
- Harrison, D. T., G. Smersh, and A. Schwartz. 2011. Environmental determinants of housing prices: The impact of flood zone status. Journal of Real Estate Research 21 (1–2):3–20. doi: 10.1080/10835547.2001.12091045.
- Hart, P. S., and L. Feldman. 2016. The impact of climate change–related imagery and text on public opinion and behavior change. Scientific Communication 38 (4):415–41. doi: 10.1177/1075547016655357.
- Hauer, M. E., J. M. Evans, and D. R. Mishra. 2016. Millions projected to be at risk from sea-level rise in the continental United States. Nature Climate Change 6 (7):691–95. doi: 10.1038/nclimate2961.
- Hinkel, J., D. Lincke, A. T. Vafeidis, M. Perrette, R. J. Nicholls, R. S. Tol, B. Marzeion, X. Fettweis, C. Ionescu, and A. Levermann. 2014. Coastal flood damage and adaptation costs under 21st century sea-level rise. Proceedings of the National Academy of Sciences 111 (9):3292–97. doi: 10.1073/pnas.1222469111.
- Hino, M., and M. Burk. 2021. The effect of information about climate risk on property values. Proceedings of the National Academy of Sciences 118 (17):e2003374118. doi: 10.1073/pnas.2003374118.
- Howe, P. D., H. Boudet, A. Leiserowitz, and E. W. Maibach. 2014. Mapping the shadow of experience of extreme weather events. Climatic Change 127 (2):381–89. doi: 10.1007/s10584-014-1253-6.
- Howe, P. D., and A. Leiserowitz. 2013. Who remembers a hot summer or a cold winter? The asymmetric effect of beliefs about global warming on perceptions of local climate conditions in the US. Global Environmental Change 23 (6):1488–1500.
- Howe, P. D., M. Mildenberger, J. R. Marlon, and A. Leiserowitz. 2015. Geographic variation in opinions on climate change at state and local scales in the USA. Nature Climate Change 5 (6):596–603. doi: 10.1038/nclimate2583.
- Huang, C. S., and M. Lubel. 2022. Household flood risk response in San Francisco Bay: Linking risk information, perception, and behavior. Regional Environmental Change 22 (1):1–14. doi: 10.1007/s10113-022-01875-6.
- Katz, L., and B. Walzer. 2021. Florida frenzy: America’s hottest neighborhoods of 2022. Redfin News. Accessed October 11, 2022. https://www.redfin.com/news/hottest-neighborhoods-2022/.
- Kaufman, L. 2021. Florida’s flood disclosure rules leave homebuyers in the dark. Bloomberg News, March 1. Accessed October 11, 2022. https://www.bloomberg.com/news/articles/2021-03-01/florida-s-flood-disclosure-rules-leave-homebuyers-in-the-dark.
- Keenan, J. M., T. Hill, and A. Gumber. 2018. Climate gentrification: From theory to empiricism in Miami-Dade County, Florida. Environmental Research Letters 13 (5):054001. doi: 10.1088/1748-9326/aabb32.
- Keys, B. J., and P. Mulder. 2020. Neglected no more: Housing markets, mortgage lending, and sea-level rise. National Bureau of Economic Research, Report No. w27930. doi: 10.3386/w27930.
- Kolaj, A. 2022. Florida’s housing market cooling after hot pandemic run. TD Economics. Accessed January 7, 2023. https://economics.td.com/domains/economics.td.com/documents/reports/ak/Florida_Housing_Market_Cooling_After_Hot_Pandemic_Run.pdf.
- Kousky, C., H. Kunreuther, M. LaCour-Little, and S. Wachter. 2020. Flood risk and the U.S. housing market. Journal of Housing Research 29 (Suppl. 1):S3–S24. doi: 10.1080/10527001.2020.1836915.
- Kropp, S. 2012. The influence of flooding on the value of real estate. Journal of Building Survey, Appraisal & Valuation 1 (4):318–24.
- Leiserowitz, A. 2005. American risk perceptions: Is climate change dangerous? Risk analysis: An International Journal 25 (6):1433–42. doi: 10.1111/j.1540-6261.2005.00690.x.
- Leiserowitz, A. 2006. Climate change risk perception and policy preferences: The role of affect, imagery, and values. Climatic Change 77 (1–2):45–72. doi: 10.1007/s10584-006-9059-9.
- Lewandowsky, S. 2021. Climate change disinformation and how to combat it. Annual Review of Public Health 42:1–21. doi: 10.1146/annurev-publhealth-090419-102409.
- Lorenzoni, I., S. Nicholson-Cole, and L. Whitmarsh. 2007. Barriers perceived to engaging with climate change among the UK public and their policy implications. Global Environmental Change 17 (3–4):445–59. doi: 10.1016/j.gloenvcha.2007.01.004.
- McAlpine, S. A., and J. R. Porter. 2018. Estimating recent local impacts of sea-level rise on current real estate losses: A housing market case study in Miami-Dade, Florida. Population Research and Policy Review 37 (6):871–95. doi: 10.1007/s11113-018-9473-5.
- McCright, A. M., and R. E. Dunlap. 2011. The politicization of climate change and polarization in the American public’s views of global warming, 2001–2010. The Sociological Quarterly 52 (2):155–94.
- McDonald, R. I., H. Y. Chai, and B. R. Newell. 2015. Personal experience and the “psychological distance” of climate change: An integrative review. Journal of Environmental Psychology 44:109–18. doi: 10.1016/j.jenvp.2015.10.003.
- Mildenberger, M., M. Lubell, and M. Hummel. 2019. Personalized risk messaging can reduce climate concerns. Global Environmental Change 55:15–24. doi: 10.1016/j.gloenvcha.2019.01.002.
- Mildenberger, M., J. R. Marlon, P. D. Howe, and A. Leiserowitz. 2017. The spatial distribution of Republican and Democratic climate opinions at state and local scales. Climatic Change 145 (3):539–48. doi: 10.1007/s10584-017-2128-4.
- Moser, S. C., and L. Dilling. 2007. Toward the social tipping point: Creating a climate for change. In Creating a climate for change: Communicating climate change and facilitating social change, ed. S. C. Moser and L. Dilling, 491–516. Cambridge, UK: Cambridge University Press. doi: 10.1017/CBO9780511535871.035.
- Myers, T. A., E. W. Maibach, C. Roser-Renouf, K. Akerlof, and A. A. Leiserowitz. 2013. The relationship between personal experience and belief in the reality of global warming. Nature Climate Change 3 (4):343–47. doi: 10.1038/nclimate1754.
- Myers, T. A., M. C. Nisbet, E. W. Maibach, and A. A. Leiserowitz. 2012. A public health frame arouses hopeful emotions about climate change: A letter. Climatic Change 113:1105–12. doi: 10.1007/s10584-012-0513-6.
- Nguyen, D. D., S. Ongena, S. Qi, and S. Vathunyoo. 2020. Climate change risk and the cost of mortgage credit. Swiss Finance Institute Research Paper Series 20–97. Accessed October 11, 2022. SSRN-id3738234.pdf.
- Ogunbode, C. A., C. Demski, S. B. Capstick, and R. Gennaro. 2019. Attribution matters: Revisiting the link between extreme weather experience and climate change mitigation responses. Global Environmental Change 54:31–39. doi: 10.1016/j.gloenvcha.2018.11.005.
- O’Neill, S. J. 2013. Image matters: Climate change imagery in US, UK, and Australian newspapers. Geoforum 49:10–19. doi: 10.1016/j.geoforum.2013.04.030.
- Ortega, F., and S. Taspinar. 2018. Rising sea-levels and sinking property values: The effects of Hurricane Sandy on New York’s housing market. Journal of Urban Economics 106:81–100. doi: 10.1016/j.jue.2018.06.005.
- Palm, R., and T. Bolsen. 2020. Climate change and sea level rise in South Florida: The view of coastal residents. Cham, Switzerland: Springer International. doi: 10.1007/978-3-030-32602-9.
- Palm, R., and T. Bolsen. 2022. Housing market response to sea-level rise in Florida. Cham, Switzerland: Springer International. doi: 10.1007/978-3-030-88435-2.
- Pidgeon, N., and B. Fischhoff. 2011. The role of social and decision sciences in communicating uncertain climate risks. Nature Climate Change 1:35–41. doi: 10.1038/nclimate1080.
- Qualtrics, L.L.C. 2014. ESOMAR 28. Published by Qualtrics.
- Rabb, W. 2018. States with best, worst home flood damage disclosure laws. Insurance Journal, August 16. Accessed January 7, 2023. https://www.insurancejournal.com/news/national/2018/08/16/498388.htm.
- Rayner, S., and E. L. Malone. 1997. Zen and the art of climate maintenance. Nature 390:332–34. doi: 10.1038/36975.
- Redfin. 2022. United States housing market. Accessed October 11, 2022. https://www.redfin.com/us-housing-market.
- Retchless, D. P. 2018. Understanding local sea-level rise risk perceptions and the power of maps to change them: The effects of distance and doubt. Environment and Behavior 50 (5):483–511. doi: 10.1177/0013916517709043.
- Rollason, E., L. J. Bracken, R. J. Harcy, and A. R. G. Large. 2018. Rethinking flood risk communication. Natural Hazards 92:1665–86. doi: 10.1007/s11069-018-3273-4.
- Scannell, L., and R. Gifford. 2013. Personally relevant climate change: The role of place attachment local versus global message framing in engagement. Environment and Behavior 45 (1):60–85. doi: 10.1177/0013916511421196.
- Schuldt, J. P., L. N. Rickard, and Z. J. Yang. 2018. Does reduced psychological distance increase climate engagement? On the limits of localizing climate change. Journal of Environmental Psychology 55:147–53.
- Schuppe, J., E. Chuck, M. Chan, L. Kamb, and N. Chiwaya. 2022. Ian was one of the most lethal hurricanes in decades. NBC News. Accessed January 7, 2023. https://www.nbcnews.com/news/us-news/hurricane-ian-florida-death-toll-rcna54069.
- Sheppard, S. R. J., A. Shaw, D. Flanders, S. Burch, A. Wiek, J. Carmichael, J. Robinson, and S. Cohen. 2011. Future visioning of local climate change: A framework for community engagement and planning with scenarios and visualization. Futures 43:400–12. doi: 10.1016/j.futures.2011.01.009.
- Shwedel, Y. 2022. The post-COVID real estate market in South Florida. GS2Law. Accessed January 7, 2023. https://www.gs2law.com/blog/the-post-covid-real-estate-market-in-south-florida-what-kinds-of-deals-are-leading-the-way-in-2022/.
- Shwom, R., A. Dan, and T. Dietz. 2008. The effects of information and state of residence on climate change policy preferences. Climatic Change 90 (4):343–58.
- Snel, K., P. A. Witte, T. Hartmann, and S. C. M. Geertman. 2019. More than a one-size-fits-all approach—Tailoring flood risk communication to plural residents’ perspectives. Water International 44 (5):554–70. doi: 10.1080/02508060.2019.1663825.
- Snyder, E., and C. Kulesza. 2020. Let the buyer beware: A comparison of flood-related real estate disclosure laws of Virginia and other states. Accessed October 11, 2022. https://law.wm.edu/academics/programs/jd/electives/clinics/practicum_list/vacoastal/reports/realestatedisclosures.pdf.
- Spence, A., and N. Pidgeon. 2010. Framing and communicating climate change: The effects of distance and outcome frame manipulations. Global Environmental Change 20 (4):656–67.
- Spence, A., W. Poortinga, C. Butler, and N. F. Pidgeon. 2011. Perceptions of climate change and willingness to save energy related to flood experience. Nature Climate Change 1 (1):46–49. doi: 10.1038/nclimate1059.
- Weintraub, E. 2020. Using your agent’s recommended mortgage lender. The Balance. Accessed October 11, 2022. https://www.thebalance.com/using-your-agent-s-recommended-mortgage-lender-1798449.
- Yale Program on Climate Change Communication and George Mason University Center for Climate Change Communication. 2022. Climate change in the American mind: National survey data on public opinion (2008-2022). New Haven, CT: Yale Program on Climate Change Communication. doi: 10.17605/OSF.IO/JW79P.
- Yi, D., and H. Choi. 2020. Housing market response to new flood risk information and the impact on poor tenant. The Journal of Real Estate Finance and Economics 61:55–99. doi: 10.1007/s11146-019-09704-0.
Appendix
Selected Questions from 2018 Survey of Coastal Residents of Southwest Florida
Is your home susceptible to sea-level rise?
Definitely NOT (1)
Very likely NOT (2)
Probably NOT (3)
Not sure (4)
Probably YES (5)
Very likely YES (6)
Definitely YES (7)
Table A.1 Estimated treatment effects (ordinary least squares) with demographic variables
If sea-level rise occurs, to what extent will it reduce the property value of your own home?
Not at all (1)
A little (2)
Somewhat (3)
A moderate amount (4)
A great deal (5)
Do you think that climate change is happening?
Definitely is NOT happening (1)
Very likely is NOT happening (2)
Probably is NOT happening (3)
Not sure (4)
Probably is happening (5)
Very likely is happening (6)
Definitely is happening (7)
To what extent do you think sea-level rise is related to climate change?
Definitely is NOT related to climate change (1)
Very likely is NOT related to climate change (2)
Probably is NOT related to climate change (3)
Not sure (4)
Probably IS related to climate change (5)
Very likely IS related to climate change (6)
Definitely IS related to climate change (7)
To what extent do you believe that climate change is responsible for causing more extreme storms and hurricanes?
None at all (1)
A little (2)
A moderate amount (3)
A lot (4)
A great deal (5)
Demographics
What is your age?
Are you male or female?
Male (0)
Female (1)
What is your estimate of your family’s annual household income (before taxes)?
Less than $30,000 (1)
$30,000–$69,999 (2)
$70,000–$99,999 (3)
$100,000–$200,000 (4)
Greater than $200,000 (5)
What is the highest level of education you have attained?
Less than a high school (1)
High school graduate (2)
Some college (3)
4-year college degree (4)
Advanced degree (5)
Generally speaking, which of the options on the scale below best describes your party identification?
Strong Republican (1)
Weak Republican (2)
Lean Republican (3)
Independent (4)
Lean Democrat (5)
Weak Democrat (6)
Strong Democrat (7)
Do you own your home or do you rent?
Rent (0)
Own (1)
(For owners only) Do you have a separate flood insurance policy in addition to your homeowner’s policy?
Yes (1)
No (0)
Don’t Know (9)
How long have you lived in Florida?
Maps Presented to Residents of Corresponding Areas
Figure A1 Map 1 This map shows the projected impact of flooding following a Category 3 hurricane on the Fort Myers area.
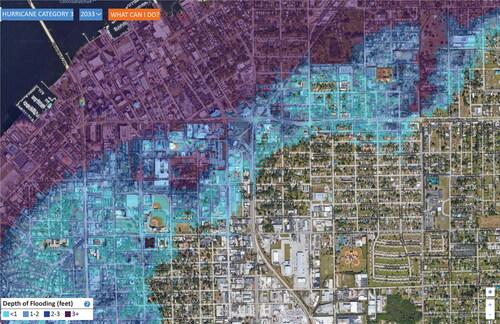
Figure A2 Map 2 This map shows the projected impact of flooding following a Category 3 hurricane on the St. Petersburg area.
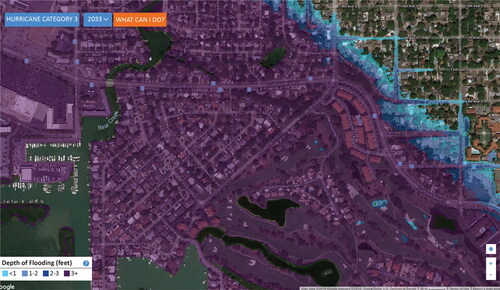
Figure A3 Map 3 This map shows the projected impact of flooding following a Category 3 hurricane on the Tampa area.
2020 Survey of Real Estate Agents Doing Business in Southwest Florida
Dependent Variables
To what extent do you believe that buyers are avoiding property in low-elevation coastal areas because of possible flooding?
Not at all (1)
Rarely (2)
A little (3)
Somewhat (4)
Somewhat frequently (5)
Very frequently (6)
All the time (7)
Do you think buyers are avoiding properties at low elevations because of possible flooding? Why or why not?
Please enter your response in the text box below.
__________________________________________
__________________________________________
__________________________________________
If some buyers are avoiding low-elevation coastal areas, this would reduce overall demand and therefore reduce prices.
To what extent have you observed that house prices are either falling or not rising as rapidly for properties at risk of flooding?
Not at all (1)
Rarely (2)
A little (3)
Somewhat (4)
Somewhat frequently (5)
Very frequently (6)
Always (7)
We might expect that buyers who are planning to live in the property year-round themselves would respond differently to possible flooding than those investing in property or buying it as a vacation home.
In a sentence or two, please elaborate. Are there differences between prospective owner-occupiers, foreign buyers, and second home buyers in how they evaluate properties with respect to their risk of flooding?
Please enter your response in the text box below.
__________________________________________
__________________________________________
__________________________________________
Have you observed mortgage lenders declining loan applications or increasing charges for loans in low-lying areas that are flood prone, in the form of points or mortgage insurance, for example?
Not at all (1)
Rarely (2)
A little (3)
Somewhat (4)
Somewhat frequently (5)
Very frequently (6)
All the time (7)
Appraisers might also consider elevation or flood likelihood in their valuation of property. To what extent do you believe that property appraisers consider elevation or the likelihood of flooding in their assessment of home value?
Not at all (1)
Rarely (2)
A little (3)
Somewhat (4)
Somewhat frequently (5)
Very frequently (6)
All the time (7)
Does elevation matter more or less for homes that are at the high end of the market as opposed to those selling for lower prices?
Elevation matters much more at the high end of the market (1)
Elevation matters somewhat more at the high end of the market (2)
There are no differences between the high end and the low end with respect to elevation (3)
Elevation matters somewhat more at the low end of the market (4)
Elevation matters much more at the low end of the market (5)
How do you see the near-term future for residential property in low-elevation coastal areas? Will the residential property market see less demand and lower prices in areas prone to flooding in the next five to ten years?
No effect of flooding (1)
Almost no effect of flooding (2)
Very small effect of flooding (3)
Small effect of flooding (4)
Moderate effect of flooding (5)
Large effect of flooding (6)
Very large effect flooding (7)
Climate Change Beliefs
Do you think that climate change is happening?
Definitely is NOT happening (1)
Very likely is NOT happening (2)
Probably is NOT happening (3)
Not sure (4)
Probably is happening (5)
Very likely is happening (6)
Definitely is happening (7)
To what extent do you believe that the sea level is rising?
Definitely is NOT rising (1)
Very likely is NOT rising (2)
Probably is NOT rising (3)
Not sure (4)
Probably IS rising (5)
Very likely IS rising (6)
Definitely IS rising (7)
Demographics
How long have you been a real estate professional?
Less than a year (1)
1–2 years (2)
3–5 years (3)
6–10 years (4)
11–20 years (5)
More than 20 years (6)
Are you a broker or a sales associate?
Broker (1)
How long have you lived in Florida?
Less than a year (1)
1–2 years (2)
3–5 years (3)
6–10 years (4)
11–20 years (5)
More than 20 years (6)
How old are you?
Under 18 (1)
18–24 (2)
25–34 (3)
35–44 (4)
45–54 (5)
55–64 (6)
65–74 (7)
75–84 (8)
85 or older (9)
Prefer not to answer (99)
What is your sex?
Male (0)
Female (1)
Prefer not to answer (999)
Which of the following do you consider to be your primary racial or ethnic group?
White (1)
African American (2)
Asian American (3)
Hispanic (4)
Other (5)
Prefer not to answer (6)
What is the highest level of education you have completed?
Less than high school (1)
High school graduate (2)
Some college (3)
2-year degree (4)
4-year degree (5)
Professional degree (6)
Doctorate (7)
Generally speaking, which of the options on the scale below best describes your party identification?
Strong Republican (1)
Weak Republican (2)
Lean Republican (3)
Independent (4)
Lean Democrat (5)
Weak Democrat (6)
Strong Democrat (7)
Real Estate Agent Supplemental Survey
Do you think that sea-level rise will weaken demand for coastal property in your market area? Why?
__________________________________________
__________________________________________
Do you think that sea-level rise will result in lower prices for coastal property in your market area? Why?
__________________________________________
__________________________________________
Does your opinion of your market area differ when you think of the demand over the next 50 to 100 years? Why?
__________________________________________
__________________________________________
Other remarks
__________________________________________
__________________________________________