
Abstract
Unequal spatial concentration is at the heart of economic imbalance in South Africa. This research aimed at spatially characterizing labor absorption patterns and exploring the link to spatial development. Labor absorption is often used as an indicator of labor market well-being and for many countries, the indicator is often more insightful than the unemployment rate. The research used secondary data to create a longitudinal data set of labor absorption, functional literacy, the ratio of urban population and gross domestic product growth rate, among others, at a municipal level. Exploratory spatial data analysis and thematic mapping were undertaken to illustrate the characteristics of the labor market, while spatial grouping created clusters of municipalities based on labor absorption. A positive upward trend was observed between labor absorption and the share of people in an urban area; that is, the more urban an area, the higher the labor absorption rate. Furthermore, the spatial clustering of municipalities highlighted linear patterns and when this was overlayed with roads and development corridors, clearly indicated the impact of regional spillovers. The findings suggest a more integrated focus on regional innovation policy to reduce spatial disparities in the economic landscape.
空间上的不均衡集中是南非经济失衡的核心问题。本研究旨在从空间上表述劳动力吸纳模式, 探索该模式与空间开发的联系。劳动力吸纳常常被用作劳动力市场健康的指标。对许多国家来说, 这一指标往往比失业率更有意义。通过次级数据, 本研究建立了城市尺度纵向数据集, 包括劳动力吸纳、职能扫盲、城市人口和GDP增长率的比例等。进行了探索性空间数据分析和专题制图, 以阐述劳动力市场的特征。根据劳动力吸纳, 采用空间聚合建立了城市集群。劳动力吸纳和城区人口之间有正上升趋势;即, 城市区域越大, 劳动力吸纳率越高。此外, 城市的空间集群呈现线性模式。通过叠加城市集群、道路和开发带, 能明显展示区域溢出的影响。结果表明, 为了减少经济格局的空间差异, 应当更加整体性地关注区域创新政策。
La desigual concentración espacial es caracterización central del desequilibrio económico en Sudáfrica. Esta investigación se orientó a caracterizar espacialmente los patrones de absorción laboral y a explorar el vínculo con el desarrollo espacial. La absorción laboral se usa a menudo como un indicador del bienestar del mercado laboral y, para muchos países, el indicador suele ser más idóneo que la tasa de desempleo. La investigación usó datos secundarios para crear un conjunto longitudinal de datos de la absorción laboral, la alfabetización funcional, la ratio de la población urbana y la tasa de crecimiento del producto interno bruto, entre otros, a nivel municipal. Se acometió el análisis exploratorio de datos espaciales y el mapeo temático para ilustrar las características del mercado laboral, en tanto que el agrupamiento espacial creó conglomerados de municipios basados en la absorción laboral. Se observó una tendencia positiva al alza entre la absorción laboral y la proporción de gente en un área urbana; es decir, entre más urbanizada sea un área, mayor será la tasa de absorción laboral. Aún más, el agrupamiento espacial de los municipios puso de relieve los patrones lineales, y cuando se superpuso con las carreteras y los corredores de desarrollo claramente indicó el impacto de los desbordamientos regionales. Los hallazgos sugieren una focalización más integrada sobre las políticas de innovación regional para reducir las disparidades espaciales del paisaje económico.
Processes of urbanization in developing countries have generated unprecedented growth in urban settlements in recent decades. This has been accompanied by the increasing concentration of economic activity in metropolitan areas (Nel and Rogerson Citation2009; World Bank Citation2009; Robbins Citation2010; Krupickaite et al. Citation2014; Sanchez Citation2016; Li et al. Citation2021). Uneven geographical development is only one aspect of economic imbalance (Stats SA Citation2018). Others include the merits of export-led growth relative to domestic-led expansion (Sanchez Citation2016). All are pertinent to the issue of spatial economic imbalance and to the role that sectoral composition plays in regional economic growth (Krupickaite et al. Citation2014; Coenen, Moodysson, and Martin Citation2015; Bhorat and Khan Citation2018). Additionally, dominance in wage employment rather than self-employment and household-based economic activity seems to drive the economies of most African cities (Robbins Citation2010). Labor absorption relates to the proportion of the working-age population that is employed and reflects the ability of an economy to create employment. In a country as economically and socially divided as South Africa, it would be unrealistic to expect uniform labor absorption trends locally and regionally (Bhorat and Khan Citation2018). International literature supports this by indicating that industrial development is firmly rooted in local socioeconomic conditions (Sikorski and Brezdeń Citation2021).
Based on the gap in the literature, the purpose of this article is, therefore, to explore the spatial characteristics of labor absorption in the country. Taking a more regional approach, the findings will focus on nuanced policy formulation to reduce spatial disparities in labor absorption in the country. The interrelational existence between labor absorption and development corridors will be explored to understand the possible linkages. Using exploratory spatial data analysis (ESDA) and spatial grouping analysis, the study seeks answers to the following questions:
What socioeconomic imbalances affect disparities in labor absorption in South Africa?
How are these disparities expressed spatially?
The literature review that follows discusses local and international literature related to socioeconomic and spatial imbalances in South Africa, how some of it has been addressed, and labor absorption patterns. We then discuss the data and methodology used for this study. The “Findings and Discussion” section considers the descriptive statistics generated from the data as well as the spatial mapping of results. We conclude with recommendations, implications, and limitations of the study.
Literature Review
For the purposes of this research, the following terms and definitions were used:
Spatial concentration does not imply a tight, everlasting linkage to a certain place but rather a conglomeration of functions that could change its location over time (Meusburger Citation2001).
Labor absorption is the proportion of the working-age population that is employed (International Labour Organization [ILO] 2016).
Unemployment is the rate of the economically active population—fifteen to sixty-four years old who are not employed (ILO Citation2016).
Regional spillovers refer to the growth generated in one area or country, carrying over to an adjacent area through trade linkages and other methods (Seck, Fall, and Aidara Citation2020).
Development corridors are areas of potential economic development as investment opportunities promoting the restructuring of economic spaces (Brand and Drewes Citation2020).
Besides the work conducted by Weir-Smith (Citation2018) on spatially modeling unemployment in South Africa, very few studies have attempted to spatially characterize labor absorption in the country. Some studies in the literature do focus on the limitations of measuring labor absorption in developing countries (Sylla Citation2013), variation by gender (Ntuli Citation2004), historical trends of labor absorption (Yu Citation2008), the factors that determine the rates of labor absorption (Mncayi and Shuping Citation2021), and general reporting by agencies like Stats SA (Citation2020, Citation2022). Others have spatially modeled South African jobless trends (Weir-Smith Citation2018). Some of these studies indicate that the unemployment rate in South Africa is acute when measured in terms of labor force absorption (Mncayi and Shuping Citation2021). The labor absorption rate is the proportion of the working-age population age fifteen to sixty-four that is employed (Stats SA Citation2020). A higher labor absorption rate means more work-seekers are getting employed, whereas a lower absorption rate shows more people are struggling to find employment (Stats SA Citation2020). The ILO indicates that this ratio provides information on the ability of an economy to create employment; for many countries, the indicator is often more insightful than the unemployment rate (ILO Citation2016). Sylla (Citation2013) conceded that even though the unemployment rate is widely used as an indicator of labor absorption, it is a controversial and much-criticized concept, as the measures of unemployment are not standardized internationally.
In South Africa, unemployment is a chronic problem; for example, in the first quarter of 2022, the official unemployment was 34.5 percent (Stats SA Citation2022). South Africa is grappling with an increase in people entering the labor market amid a shrinking economy (Mncayi and Shuping Citation2021). The patterns of labor absorption in South Africa still bear the spatial distribution brought about by the inequalities that are a legacy of apartheid. Apartheid deliberately sought the separate development of people according to race and this had socioeconomic implications, as some population groups were deprived of economic opportunities (Mncayi and Shuping Citation2021). Furthermore, contraction in the primary sector and expansion in the manufacturing sector has led to structural shifts in the economy of South Africa (Van der Berg et al. Citation2005), which is still prevalent.
Using data collected by Oosthuizen (Citation2006) and Yu (Citation2008), Festus et al. (Citation2015) investigated the changes that took place in South Africa’s postapartheid era from 1995 to 2013. This work gave an account of historical changes in labor absorption in the country. The study found that between 1995 and 2013, there was a decrease in labor absorption. At a provincial level Gauteng, KwaZulu-Natal, Western Cape, and Eastern Cape experienced the highest labor absorption rates, with an increase of 38.5 percent in net employment during this period. Remarkably Mpumalanga and Limpopo, two of the highly deprived provinces in the country, experienced increased labor absorption rates at 10.3 percent and 10.0 percent, respectively, during this period (Festus et al. Citation2015).
In addition, there is a spatial divide between rural and urban areas, skilled and unskilled labor. South Africa has high levels of inequality, which are also reflected in the rural–urban divide, and in the differences in employment rates between skilled and unskilled labor (Visagie and Turok Citation2021). Rural labor absorption rates are traditionally low, leading to sustained rural–urban migration (Visagie and Turok Citation2021). This puts severe pressure on urban infrastructure, and it also results in a large shortage of formal housing in urban areas, contributing to relatively low levels of productivity, labor and market competitiveness, and an increase in formal employment particularly among the unskilled labor force (Bhorat and Khan Citation2018). Urban areas then become areas of labor absorption inequalities themselves, with labor absorption rates being relatively lower in urban localities with high population densities, unskilled labor, and rural migrants (Bhorat and Khan Citation2018).
Besides these spatial disparities, differences in labor absorption rates are also evident in relation to race and socioeconomic groups in the country. Extant literature points to a pattern where unemployment continues to be concentrated in specific demographically and geographically defined groups, most notable in areas dominated by Black people. These areas, particularly the informal settlements and high-density residential areas, are characterized by low levels of education, general squalor, high crime levels, and heightened youth unemployment (Bhorat and Khan Citation2018). A 2017 Institute for Race Relations (IRR) study reported that poor labor absorption rates are more centered in Black communities. The report also noted a labor absorption rate of 40 percent, which was strongly correlated to levels of education, as of this 40 percent, 76 percent had a tertiary education (IRR Citation2017). This is consistent with earlier studies that found a link between levels of education, race, and labor absorption rates (Bhorat and Leibbrandt Citation1999; Van der Berg and Burger Citation2003). Spatial inequality produces further negative impacts on the delivery of basic services, housing, health outcomes, and access to employment opportunities. Coenen, Moodysson, and Martin (Citation2015) purported a more integrated focus on regional innovation policy to ensure that cross-sector issues get addressed.
Socioeconomic and Spatial Imbalances in South Africa
Socio-economic inequality is extremely high in South Africa, with some economists labeling it as the highest in the world (Bhorat and Khan Citation2018). Spatially, there are disparities at the provincial level, with some provinces much more developed than others. Over the last two decades, the share of national gross domestic product (GDP) of the three largest provinces, namely Gauteng, Western Cape, and KwaZulu-Natal, increased. These provinces have gradually pulled away from the rest, causing the economy to become more concentrated over time (Turok, Scheba, and Visagie Citation2017). Gauteng is also the most productive part of the country in terms of GDP per capita and average income. Relatively high productivity is one of the reasons why the growth in jobs in Gauteng has outpaced other provinces for the last two decades (Turok, Scheba, and Visagie Citation2017). Provinces such as Northern Cape and North-West are expected to experience long-term structural unemployment as mines, the major employer, reach their end of life. Sikorski and Brezdeń (Citation2021) expanded on this, that industrial concentration and specialization are also accompanied by structural changes. In addition, the continued mismatch between labor demand and labor supply spatially could be due to the persistence of unemployment disparities that are difficult to rectify (Turok, Scheba, and Visagie Citation2017).
Spatial disparities are also expressed in provincial variations in the Human Development Index (HDI) and Gini coefficient. The HDI is a measure of a country’s performance based on indicators such as health, knowledge, and standards of living, whereas the Gini coefficient indicates wealth inequalities. shows that Gauteng, Western Cape, and Northern Cape had the highest HDI values. The Gini coefficient, on the other hand, was almost evenly spread across the provinces in South Africa, with all the provinces having an index higher than 0.60, except for Limpopo. Eastern Cape had the highest unemployment rate at 44.0 percent, followed by Mpumalanga and Gauteng at 38.6 percent and 36.7 percent, respectively ().
Table 1 Provincial Human Development Index (HDI), Gini coefficient, and unemployment rates
Addressing Spatial Socioeconomic Imbalances
Agencies such as the South African Local Government Association (SALGA) aim at spatial transformation to enable inclusive and integrated economic growth in municipalities and provinces (SALGA Citation2022). SALGA aims to reduce spatial disparities by improving proximity to employment and economic opportunities, providing equitable access to land and housing, and providing access to infrastructure and government services. Recent research notes that inequality has increased especially at the neighborhood level, with increased polarization between rich and poor in South Africa (Lynge et al. Citation2022).
Additionally, the South African government sees the formation of development corridors as a measure of addressing spatial developmental imbalances through intranational and interregional economic integration. Development corridors are also seen as a way of increasing the spatial attractiveness of regions and cities that might provide better economic spaces in South Africa (Brand and Drewes Citation2020). Although the restructuring of economic spaces is one of the South African government’s economic development initiatives, it lacks a strategy for identifying investment opportunities to promote the restructuring of economic spaces in South Africa. shows the potential corridors being mooted:
Figure 1 Development corridors. Source: Brand (Citation2017), adapted by the authors.
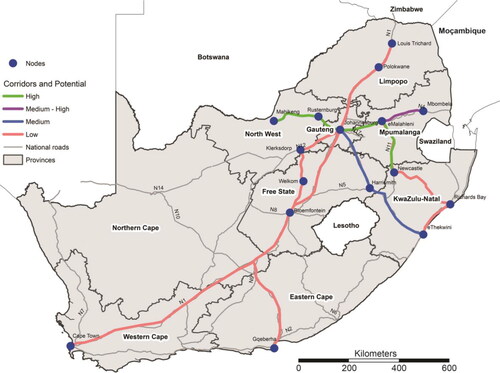
Johannesburg to Newcastle (via Emalahleni).
Johannesburg to Mbombela (via Emalahleni).
Johannesburg to Mmabatho (via Rustenburg).
It was anticipated that the most prominent developmental corridor would be from Johannesburg to Mbombela, Johannesburg to Newcastle, and Johannesburg to Mmabatho. The application of the regional corridor network model illustrates that development corridors are key considerations for the pursuit of strategies for cohesion and sustainable development and can stimulate a more balanced development policy approach (Brand Citation2017).
Labor Absorption in South Africa
The labor absorption rate (employment-to-population ratio) measures the proportion of the working-age population that is employed (Stats SA Citation2018). A high ratio means that a large proportion of a country’s population is employed, whereas a low ratio means that a large share of the population is not involved directly in market-related activities, because they are either unemployed or (more likely) out of the labor force altogether (ILO Citation2016).
In a developing world context, temporal change in labor absorption rates is an additional indicator of labor market health to consider, as traditional unemployment statistics can be underestimated (Sylla Citation2013). Between 2013 and 2018, the South African working-age population increased from 34.8 million to 37.9 million (Stats SA Citation2018). Both the unemployment rate (27.1 percent) and the absorption rate (43.2 percent) increased during this period. Economic growth declined from 2.5 percent in 2013 to 0.8 percent in 2018 (Stats SA Citation2018). Over the 2013 to 2018 period, absorption rates declined in four of the nine provinces, namely Gauteng (2.5 percent), Northern Cape (1.2 percent), KwaZulu-Natal (0.7 percent) and Mpumalanga (0.4 percent; Stats SA Citation2018).
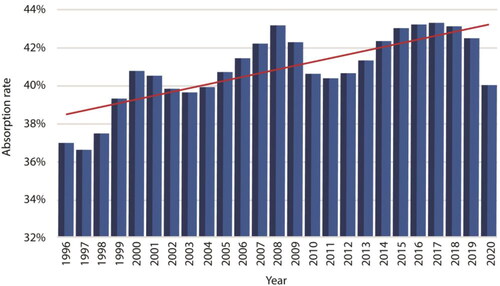
The labor absorption rate is central to poverty reduction as part of Millennium Development Goal 1 (the employment-to-population ratio was adopted as one of four indicators to measure progress toward target 1b on “achieving full and productive employment and decent work for all”; ILO Citation2016, 55). illustrates the labor absorption rates in postapartheid South Africa between 1996 and 2020. Although there were years of low absorption, for example in 2011 and 2020, the general trend is upward.
Figure 2 Labor absorption rates in South Africa. Source: Global Insight (Citation2022), adapted by the authors.
The next section deals with the data used in this research.
Data and Methods
Stats SA is the collecting agency of official statistics in South Africa (Weir-Smith Citation2013). Census data are collected every five years in South Africa and the last census was conducted in 2011. However, census collection can be extended to a ten-year period based on the discretion of the Statistical General. In the absence of a census in 2006 and 2016, the Community Survey was conducted (Weir-Smith Citation2013). Furthermore, official labor market statistics are also reflected through the Quarterly Labor Force Surveys (QLFS), but report results only at a provincial level and within that, at metro and nonmetro levels (Stats SA Citation2022). Spatial detail (e.g., municipal trends) is therefore lacking. To overcome this challenge of recent data, data were obtained from Global Insight, which uses census data together with numerous other data sources like National Accounts from the South African Reserve Bank, mining production and sales from Stats SA, mineral statistics from the Minerals Bureau, and the Eskom Annual Report (Global Insight Citation2022).
Data on labor absorption, labor participation, total population, food poverty, Gini coefficient and unemployment, GDP growth rate, and other demographics were extracted per municipality for various time periods (60 variables in total). The municipal boundaries of 2016 were used and consisted of 213 areas. The attribute data were spatially joined to the municipal boundaries using the ArcGIS Desktop 10.8 software. ESDA was undertaken to understand the relationships within the data. Frequencies and scatterplots were done using GeoDa 1.20.0.8 and these findings are reported later.
Furthermore, a grouping analysis was undertaken. This statistical technique uses a factor analysis to cluster features based on specific variables. It is an unsupervised machine learning method to determine natural groupings in data (ESRI Citation2022). In the first model using local municipalities (N = 213), the labor absorption rate of 2020 only was used, but the return output was nonsatisfactory and had low R2 values. The larger the R2 value is for a particular variable, the better that variable is at discriminating among features (ESRI Citation2022). Subsequently, the labor absorption rate of six time periods between 1996 and 2020 was used to cluster the features. As spatial constraints, the K_Nearest_Neighbors method was used to ensure groups are not spatially far apart. The distance method was Euclidean and to ensure contiguity of the resulting outcome, a minimum number of five neighbors were specified. The model was run six times and changes between the different models included varying the number of output groups and using different analysis fields as input. The final result illustrated very high R2 values and consisted of seven groups of municipalities.
Findings and Discussion
Descriptive Statistics
shows the descriptive statistics of the data and indicates a peak in labor absorption in 2016, with a mean value of 39.1 percent. The Gini coefficient was highest in 2020 at 60.0, and the share of people in the municipality who are urban showed an upward trend until 2016. GDP average annual growth remained below 4.5 percent for the period under investigation and negative growth was reported in 2016 and 2020.
Table 2 Descriptive statistics
Variations in the labor absorption rate can be ascribed to a number of factors. First, the world commodity boom between 2004 and 2012 transformed the fortunes of the mining industry. South Africa is a major commodity exporter and during this period, the growing role in the global industry for emerging economy mining companies had a great impact (Humphreys Citation2019). Second, South Africa did not escape the 2008 global financial crisis, and the economy went into recession in 2008 and 2009 for the first time in seventeen years. Nearly a million jobs were lost in 2009 (Steytler and Powell Citation2010). Third, since the end of 2007, the country has experienced electricity load shedding (Eskom Citation2023). The impact on the economy has been devastating, especially in the primary and secondary sectors, which has led to contraction in both (BNP Paribas Citation2023; Van der Nest Citation2023).
One of the main concerns in the findings is the indication of an increase in the number of people below the food poverty line. By 2020 the number had increased significantly. Part of this can be ascribed to the impact of COVID-19 due to widespread job losses, especially among low-wage workers (Chetty et al. Citation2020; Franch-Pardo et al. Citation2020).
Exploratory Spatial Data Analysis
The ESDA revealed linear relations between the labor absorption rate and a few variables, namely the share of people who live in an urban area relative to the total (urban plus rural) population within a municipality, and functional literacy, which refers to the percentage of people fifteen years and older with an education of completed Grade 7 or higher. The scatterplots indicated a positive upward trend between labor absorption and the share of people in an urban area; that is, the more urban an area tends to be, the higher the labor absorption rate. Similarly, there is a positive upward relationship between labor absorption and functional literacy, which indicates that the labor absorption increases as functional literacy increases. The only negative linear relation was between labor absorption and unemployment, indicating that labor absorption decreases as unemployment decreases.
Thematic Mapping
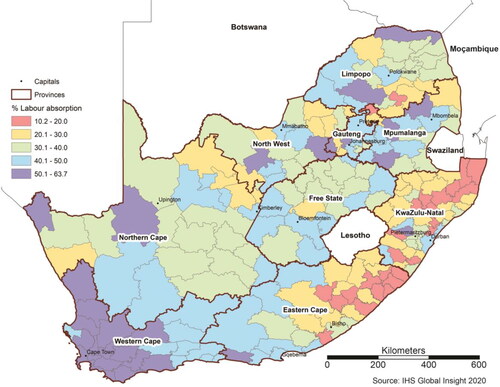
Thematic mapping of the labor absorption rates over the time period indicated provincial patterns of consistently low absorption rates below 20 percent in most municipalities in Eastern Cape and KwaZulu-Natal. The number of municipalities in the lowest category has, however, decreased since 1996 and indicates some improvement in the local economies. shows labor absorption rates above 50 percent in most parts of Western Cape, and a few municipalities in all other provinces, except Free State. The highest level of labor absorption was 63 percent in the Witzenberg municipality in the Western Cape. Absorption rates below 20 percent were prevalent in many municipalities in Eastern Cape and KwaZulu-Natal. Most of these are characterized by a predominantly rural population; for example, the share of people in municipalities who are urban is below 19 percent, and the functional literacy rate is between 63 percent and 81 percent. Interestingly, only two metropolitan areas are in the highest labor absorption category of more than 50 percent: Johannesburg and Cape Town. Over time, very high absorption rates prevailed in the Western Cape.
Figure 3 Labor absorption rates per municipality. Source: Global Insight (Citation2022), adapted by the authors.
The spatial grouping model had an average R2 value of 0.68, with the largest R2 value being 0.72 for labor absorption in 1996. Although the pseudo F-statistic indicated eleven groups as the optimal number, seven groups of municipalities were identified because of ease of interpretation and understanding the spatial landscape. illustrates the spatial groupings and Group 1 includes the western part of the Western Cape. There are seventeen municipalities included in this group. The largest group is Group 7 (N = 64) and it covers the central part of the country. Group 2 stretches along the N4 route from Mpumalanga in the east to the North West province. This route is a popular tourist corridor and also represents large-scale economic activities like the transport of coal to the country’s power stations and mining activities. Group 5 refers to an area of cattle and game farming with some remotely situated mining activities. Unique groups are seen in 4 and 5 and the first illustrates the high concentration of economic activities in KwaZulu-Natal, the province with the second highest GDP. The largest metropolitan areas are seen in Groups 1, 2, and 4 and include Cape Town, Johannesburg, Pretoria, Ekurhuleni, and Durban.
Figure 4 Spatial grouping of municipalities based on labor absorption.
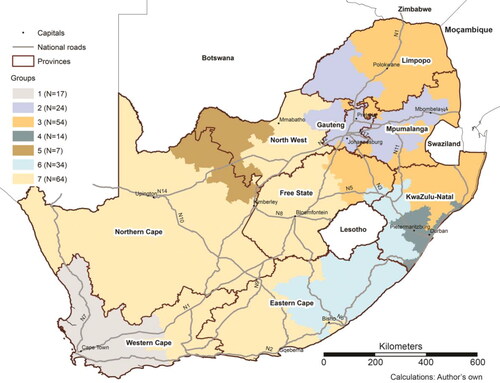
Groups 1, 2, 4, and 6 have clear linear patterns along national routes and indicate the importance of considering spatial development holistically. When overlaying proposed national development corridors with these labor absorption patterns, the linear patterns become even more pronounced. illustrates the importance of the N4 as a corridor of high-potential development and this corresponds with labor absorption patterns of Group 2. Group 4 absorption links to the medium- to high-potential corridor between Durban and Johannesburg. This corridor follows the N3, which is used to transport goods to and from the Durban port and carries the highest volume of trucks in the country—up to 6,000 daily (South African Reserve Bank Citation2021). Groups 1 and 3 labor absorption areas are located in corridors of low development potential, like the N1 between Gauteng and Polokwane and the N1 between Cape Town and Gauteng.
Figure 5 Labor absorption groups and development corridors. Corridor data source: Brand (Citation2017).
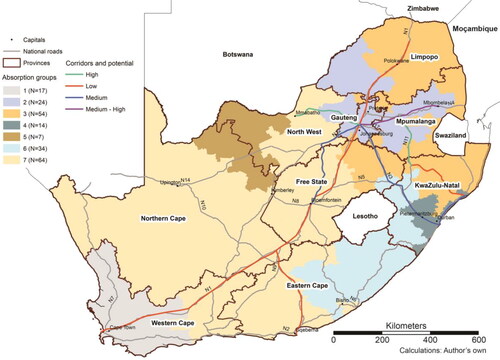
A high-potential development corridor is also seen along the N11 from the northwestern part of KwaZulu-Natal to Mpumalanga and links to the N4. Although the labor absorption varies along this road, the unique characteristics of Group 2 are emphasized.
To relate the study findings to the real world, South African education outcomes remain extremely poor, resulting in a continued stream of insufficiently educated new work-seekers (Festus et al. Citation2015). Recent results from the international Trends in Mathematics and Science Study (TIMSS) reported that South Africa was second last in Grade 8 mathematics evaluations (Mullis et al. Citation2023). The geographical distribution of these results is closely linked to provincial GDP and poverty rates (TIMSS SA Citation2023), with Gauteng and Western Cape having the best education scores. The findings of the study underscore the strong provincial character of labor absorption. The spillover effect of metros and big urban centers can be seen, however. For example, the influence of Cape Town stretches far into the Western Cape (Group 1 municipalities), and the influence of the Gauteng economy spills over to North West, Mpumalanga, and Limpopo (Group 2).
Conclusion
The findings of this research have implications at various levels. In terms of labor absorption being an indicator of economic health, municipalities in Groups 1, 2, and 4 are in the three provinces with the highest GDP and big metro areas. The extent to which Group 2 municipalities stretch further than Gauteng indicates the importance of the regional effect of economic activities. Municipalities with labor absorption rates below 30 percent were predominant in Eastern Cape and most parts of KwaZulu-Natal. Once clustered, the linkage between Eastern Cape and KwaZulu-Natal economies in the south was evident in Group 6. Similarly, KwaZulu-Natal municipal economies in the north of the province were similar to those in Limpopo and Free State (Group 3). When designing local development plans and interventions, cross-municipal policies should therefore be the basis. Such policies should be informed by the influence of major economic centers, taking distance decay into account.
In terms of regional development, the importance of national roads is clearly highlighted. Not only do these link economic activities, but also have an impact on the local labor market. A more integrated focus on regional innovation policy will assist in reducing spatial disparities in the economic landscape, because many growth impediments are due to national trends. Furthermore, the findings illustrate that cities and towns can have similar labor absorption characteristics, even though their economic base might not be the same, for example, Mbombela in the east of the N4 and Pretoria at the western end of this route.
In terms of theoretical implications, the postapartheid policies have failed to address the economic imbalances of the past. They need to be revisited and replaced with policies that take specific labor market characteristics into account. As Varga (Citation2017) argued, the impact of a country’s development policies is also dependent on its geography. In South Africa, this is evident in the fact that many municipalities in Group 7 have low population densities, are dependent on primary and secondary economic activities, and are mostly far from markets. Economic stimulus should be targeted toward midsized towns like Middelburg and Evander (Group 2), Ladysmith (Group 3), Flagstaff (Group 6), and Vryburg (Group 7).
To take the results of the study forward, it is suggested that economic policies should focus on those municipalities close to medium- and high-potential corridors. Such municipalities already have a sustainable economic base, which can expand with further incentives to diversify or strengthen it. Specific policies need to be developed based on economic strengths and possibilities. These types of interventions will assist in reducing spatial disparities by improving proximity to employment and economic opportunities, as SALGA is aiming to achieve.
The labor absorption clustering done in this research can be used for geotargeted growth interventions. Such interventions will focus resources on geographical areas where the expected return on investments will be higher and therefore have a better chance of success. Besides focusing on municipalities adjacent to high- and medium-potential corridors, those in the provinces with the highest GDP growth also need to be considered.
Besides these results, the study has also assisted in creating an understanding of how the restructuring of economic spaces in South African can be addressed, based on labor absorption. Previous literature indicated that there is a lack of development corridors as a strategic element in identifying investment opportunities, and this research clearly indicated how the link between labor absorption and development corridors can be used to harness investment.
One of the shortcomings of this study is that local municipality boundaries were used as a proxy for local economic activity and although it might be to some extent, the authors acknowledge that economic activities are not necessarily restricted to administrative boundaries. The geographic extent of economic activity should be seen in the context of regional strengths and spillover effects. This study, however, focuses on one aspect of the labor market, which was easiest to define by administrative boundaries. The linear trend of labor market absorption patterns clearly illustrates the importance of spatial clustering in economic activities.
Acknowledgment
The authors acknowledge A. Brand for the permission granted to reproduce . The authors would like to thank E. Motolwana for graphic assistance in the recreation of .
Disclosure Statement
No potential conflict of interest was reported by the authors.
Additional information
Notes on contributors
Gina Weir-Smith
GINA WEIR-SMITH is the Head of Geospatial Analytics at the Human Sciences Research Council, Pretoria 0001, South Africa, and an Honorary Research Fellow at Wits University. E-mail: [email protected]. Her research interests include the application of geographic information systems to socioeconomic phenomena like migration, unemployment, and poverty, as well as optimization of school locations and health facilities, information and communications technology access, and predictive modeling related to socioeconomic issues.
Simangele Dlamini
SIMANGELE DLAMINI is a Senior Research Specialist at the Developmental, Capable and Ethical State Division at the Human Sciences Research Council, Pretoria 0001, South Africa. E-mail: [email protected]. His research interests include identity and belonging studies, spatial analysis, poverty and inequality, and analyzing socioeconomic vulnerability in developmental settings.
Literature Cited
- Bhorat, H., and S. Khan. 2018. Structural change and patterns of inequality in the South African labour market. Working Paper No. 201801, Development Policy Research Unit, University of Cape Town, Cape Town, South Africa.
- Bhorat, H., and M. Leibbrandt. 1999. Modelling vulnerability and low earnings in the South African labour market. Working Paper No. 99/32, Development Policy Research Unit, University of Cape Town, Cape Town, South Africa.
- BNP Paribas. 2023. South Africa: An economy paralysed by load shedding. Accessed September 14, 2023. https://economic-research.bnpparibas.com/pdf/en-US/South-Africa-economy-paralysed-load-shedding-4/14/2023,48476.
- Brand, A. 2017. The use of corridor development as a strategic and supporting instrument towards the development of national space economies. PhD thesis, North West University.
- Brand, A., and E. Drewes. 2020. Structuring South Africa’s national economic space: A regional corridor network model approach. Town and Regional Planning 77:1–9. doi: 10.18820/2415-0495/trp77i1.9.
- Chetty, R., J. Friedman, N. Hendren, and M. Stepner. 2020. The economic impacts of COVID-19: Evidence from a new public database built using private sector data. NBER Working Paper No. 27431, The Opportunity Insights Team, Cambridge, MA.
- Coenen, L., J. Moodysson, and H. Martin. 2015. Path renewal in old industrial regions: Possibilities and limitations for regional innovation policy. Regional Studies 49 (5):850–65. doi: 10.1080/00343404.2014.979321.
- Eskom, N. 2023. Shift performance and grow sustainably. Accessed September 14, 2023. https://www.eskom.co.za/heritage/history-in-decades/eskom-2003-2012/.
- ESRI. 2022. ArcGIS desktop help manual (version 10.8). Redlands, CA: ESRI.
- Festus, L., A. Kasongo, M. Moses, and D. Yu. 2015. The South African labour market, 1995–2013. Pretoria: Economic Research South Africa.
- Franch-Pardo, I., B. M. Napoletano, F. Rosete-Verges, and L. Billa. 2020. Spatial analysis and GIS in the study of COVID-19: A review. The Science of the Total Environment 739:140033. doi: 10.1016/j.scitotenv.2020.140033.
- Global Insight. 2022. Regional eXplorer encyclopedia. Pretoria, South Africa: Global Insight.
- Humphreys, D. 2019. The mining industry after the boom. Mineral Economics 32 (2):145–51. doi: 10.1007/s13563-018-0155-x.
- Institute for Race Relations (IRR). 2017. Labour market absorption rate slips–IRR. Accessed October 2, 2022. https://irr.org.za/media/media-releases/labour-market-absorption-rate-slips-2013-irr/view.
- International Labour Organization (ILO). 2016. Key indicators of the labour market. 9th ed. Geneva, Switzerland: ILO.
- Krupickaite, D., B. Konecka-Szydłowska, J. Hauke, and R. Perdal. 2014. Research methodology of spatial variability of socio-economic development at the subregional level. In The social and economic growth vs. the emergence of economic growth and stagnation areas, ed. P. Churski, 189–97. Poznań, Poland: UNI-DRUK.
- Li, Z., L. Jiao, B. Zhang, G. Xu, and J. Liu. 2021. Understanding the pattern and mechanism of spatial concentration of urban land use, population and economic activities: A case study in Wuhan, China. Geo-Spatial Information Science 24 (4):678–94. doi: 10.1080/10095020.2021.1978276.
- Lynge, H., J. Visagie, A. Scheba, I. Turok, D. Everatt, and C. Abrahams. 2022. Developing neighbourhood typologies and understanding urban inequality: A data-driven approach. Regional Studies 9 (1):618–40. doi: 10.1080/21681376.2022.2132180.
- Meusburger, P. 2001. Geography of knowledge, education, and skills. In International encyclopedia of the social & behavioral sciences, ed. N. J. Smelser and P. B. Baltes, 8120–26. London: Pergamon.https://www.sciencedirect.com/science/article/abs/pii/B0080430767025614
- Mncayi, P., and K. Shuping. 2021. Factors affecting labour absorption in South Africa. Journal of Economic and Financial Sciences 14 (1):590–603. doi: 10.4102/jef.v14i1.603.
- Mullis, I. V. S., M. O. Martin, P. Foy, D. L. Kelly, and B. Fishbein. 2023. Highlights TIMSS 2019 international results in mathematics and science. Boston: Boston College, Lynch School of Education.
- Nel, E., and C. M. Rogerson. 2009. Re-thinking spatial inequalities in South Africa: Lessons from international experience. Urban Forum 20 (2):141–55. doi: 10.1007/s12132-009-9056-y.
- Ntuli, M. 2004. Determinants of South African women’s labour force participation, 1995–2004. Discussion Paper No. 3119, University of Cape Town Press and IZA, Cape Town, South Africa.
- Oosthuizen, M. 2006. The post-apartheid labour market: 1995–2004. DPRU Working Paper 06/103,Development Policy Research Unit, University of Cape Town, Cape Town, South Africa.
- Robbins, G. 2010. Beyond local economic development? Exploring municipality-supported job creation in a South African city. Development Southern Africa 27 (4):531–46. doi: 10.1080/0376835X.2010.508584.
- Sanchez, J. M. 2016. The mega urban human agglomerations (MUHA) as an expression of regional imbalance: Another facet of the modern underdevelopment. Procedia – Social and Behavioral Sciences 223:402–409. doi: 10.1016/j.sbspro.2016.05.255.
- Seck, A., F. A. Fall, and K. Aidara. 2020. Regional integration and growth spillovers: Is Africa an economic space? Journal of African Trade 7 (1–2):37–44. doi: 10.2991/jat.k.200724.001.
- Sikorski, D., and P. Brezdeń. 2021. Contemporary processes of concentration and specialization of industrial activity in post-socialist states as illustrated by the case of Wrocław and its suburbs (Poland). Land 10 (11):1140. doi: 10.3390/land10111140.
- South African Local Government Association (SALGA). 2022. Spatial transformation barometer. towards refinement of spatial transformation indicators for municipalities. Accessed October 2, 2022. https://sacplan.org.za/wp-content/uploads/Spatial-Transformation-Barometer-publication-March-2022.pdf.
- South African Reserve Bank. 2021. Occasional bulletin of economic notes. OBEN/21/01, SARB, Pretoria, South Africa. Accessed October 5, 2022. https://www.resbank.co.za/en/home/publications/publication-detail-pages/occasional-bulletin-of-economic-notes/2021/OccasionalBulletinofEconomicNotes202101ATruckometerforSouthAfrica.
- Statistics South Africa (Stats SA). 2018. Labour market dynamics in South Africa. Pretoria: Statistics South Africa.
- Statistics South Africa (Stats SA). 2020. Quarterly labour force survey Q2:2020. Accessed October 5, 2022. http://www.statssa.gov.za/publications/P0211/ Presentation% 20QLFS%20Q2_2020.pdf.
- Statistics South Africa (Stats SA). 2022. Quarterly labour force survey Q1:2022. Accessed October 5, 2022. https://www.statssa.gov.za/publications/P0211/P02111stQuarter2022.pdf.
- Steytler, N., and D. Powell. 2010. The impact of the global financial crisis on decentralized government in South Africa. L’Europe en Formation 358 (4):149–72. doi: 10.3917/eufor.358.0149.
- Sylla, N. S. 2013. Measuring labour absorption problems in developing countries: Limitations of the concept of unemployment. International Labour Review 152 (1):27–41. doi: 10.1111/j.1564-913X.2013.00167.x.
- TIMSS SA. 2023. TIMSS SA Newsletter8 (2).
- Turok, I., A. Scheba, and J. Visagie. 2017. Reducing spatial inequalities through better regulation: Diagnostic report to the high level panel on the assessment of key legislation and the acceleration of fundamental change. Accessed October 1, 2022. https://www.parliament.gov.za/high-level-panel.
- Van der Berg, S., and R. Burger. 2003. Education and socio-economic differentials: A study of school performance in the Western Cape. Working Paper No. 03/73, Development Policy Research Unit, University of Cape Town, Cape Town, South Africa.
- Van der Berg, S., R. Burger, R. Burger, M. Louw, and D. Yu. 2005. Trends in poverty and inequality since the political transition. Working Paper No. 1/2005, Bureau for Economic Research, University of Stellenbosch, Stellenbosch, South Africa.
- Van der Nest, G. 2023. The economic consequences of load shedding in South Africa and the state of the electric grid. The Trade Law Centre, Cape Town. Accessed September 14, 2023. https://www.tralac.org/discussions/article/7000-the-economic-consequences-of-load-shedding-in-south-africa-and-the-state-of-the-electrical-grid.html.
- Varga, A. 2017. Place-based, spatially blind, or both? Challenges in estimating the impacts of modern development policies: The case of the GMR policy impact modeling approach. International Regional Science Review 40 (1):12–37. doi: 10.1177/0160017615571587.
- Visagie, J., and I. Turok 2021. Rural–urban inequalities amplified by COVID-19: Evidence from South Africa. Area Development and Policy 6 (1):50–62. doi: 10.1080/23792949.2020.1851143.
- Weir-Smith, G. 2013. The geographic data of unemployment in South Africa: An overview. South African Geographical Journal 96 (2):134–52. doi: 10.1080/03736245.2013.854177.
- Weir-Smith, G. 2018. Spatiotemporal variation of South African jobless trends: Policy directions. The Professional Geographer 70 (1):94–102. doi: 10.1080/00330124.2017.1325748.
- World Bank. 2009. World development report: Reshaping economic geography. Washington, DC: World Bank.
- Yu, D. 2008. The South African labour market: 1995–2006. Working Papers 05/2008, Stellenbosch University, Department of Economics.