
Abstract
This article develops an approach to data bricolage by mixed-methods geographic information systems (GIS) to challenge assumptions that quantitative service provision data and consumer surveys are the only sources of data that can inform gaps in service accessibility. Claims of repurposing health data have long animated health geography, but methodological advances have only recently begun to open opportunities for geographical analyses of reused secondary data. In this study, we developed novel mixed-method GIS approaches to sourcing and integrating (i.e., bricolage) geolocated health consumer information produced in online mental health forums. Although digital methods have been used for some time to gather and analyze social media and other online health data, we emphasize the process of partnering with mental health organizations to generate new knowledge about place-based lived experiences that can be used to improve service provision. Using rural Australia as a case study, we geospatially analyzed qualitative lived experience data produced in online mental health forums to better understand rural peoples’ service access challenges. In doing so, we found that it is feasible to bricolage secondary reused sources of qualitative lived experience data describing rural experiences in place.
我们开发了基于混合方法地理信息系统(GIS)的数据拼接方法, 挑战了这样一个假设: 定量服务数据和消费者调查是研究服务供应可及性差距的唯一数据源。长期以来, 健康地理学一直呼吁重新运用健康数据。但是直到最近, 方法论的进步为重新分析二手数据提供了机遇。我们创新地开发了混合方法GIS, 获取和整合(拼接)在线心理健康论坛健康消费者的地理信息。尽管数字方法已被用于收集和分析社交媒体和其它在线健康数据, 但我们强调了与心理健康组织的合作过程, 从而建立了基于位置的生活体验新知识并改善服务供应。以澳大利亚农村为例, 我们在空间上分析了在线心理健康论坛的定性生活体验数据, 更好地了解农村人口获得服务所面临的挑战。拼接农村生活体验二手定性数据是可行的。
Este artículo desarrolla un enfoque del bricolaje de datos por medio de sistemas de información geográfica (SIG) de métodos mixtos para retar los supuestos de que los datos cuantitativos para la provisión de servicios y las encuestas administradas a consumidores son las únicas fuentes de datos que pueden ilustrar sobre las lagunas que se presentan en la accesibilidad al servicio. Los reclamos para dar nuevo propósito a los datos sobre salubridad durante mucho tiempo han animado la geografía de la salud, pero los avances metodológicos solo recientemente han empezado a abrir oportunidades para los análisis geográficos de datos secundarios reutilizados recientemente. En este estudio, desarrollamos nuevos enfoques SIG de métodos mixtos para documentar e integrar (esto es, bricolaje) la información geolocalizada del consumo de servicios de salud, producida en los foros en línea sobre salud mental. Aunque durante algún tiempo se han utilizado los métodos digitales para obtener y analizar datos sobre salud en las redes sociales y otros datos de este tipo en línea, hacemos énfasis sobre los procesos de compartir con organizaciones de salud mental para generar conocimiento nuevo acerca de experiencias vividas basadas en lugar, que puedan ser usados para mejorar la provisión de servicios. Usando la Australia rural como estudio de caso, analizamos geoespacialmente los datos cualitativos de experiencias vividas, generados en foros sobre salud mental en línea, para comprender mejor los retos de acceso al servicio en la población rural. Haciendo esto, hallamos que es factible bricolagear fuentes secundarias reutilizadas de datos cualitativos de experiencias vividas que describen experiencias rurales en el lugar.
The aim of this article is to apply a methodology of data bricolage to source and integrate secondary qualitative data sets from online peer support forums to explore mental health service gaps in rural Australia. In partnership with health organizations, this innovative sourcing of data can help to overcome long-standing problems of data scarcity in certain contexts, here for rural Australia (Senate Community Affairs References Committee Citation2018). A secondary aim is to demonstrate a suite of geospatial analysis techniques that can be used to identify rural areas of high forum activity to inform further qualitative inquiry.
Scarcity of rich qualitative lived experience data exists in rural areas due to time and cost constraints of collection (Kamstra et al. Citation2022). Similarly, during crisis situations where “good enough” data can make a difference to health provision (Gabrys, Pritchard, and Barratt Citation2016), traditional data collection processes are limited (Helbardt, Hellmann-Rajanayagam, and Korff Citation2010). Although digital methods (R. Rogers Citation2013) have been used for some time to leverage insights from social media and online data, this article contributes to the expansion of these techniques through innovative geospatial methods underpinned by collaborative partnerships with mental health service providers.
This partnership approach allows for the ethical and responsible reuse of health consumer data for research purposes, while contributing to the organizations’ operational needs. Research partnerships with not-for-profit (NFP) health organizations are not uncommon (McCosker Citation2018; Kamstra et al. Citation2022). One of the difficulties, however, is the resource-intensive nature of health consumer data collection and analysis. Rural health services in Australia operate in situations of data scarcity and low resourcing, meaning that there is great need for efficient research methods that can generate new information about service access gaps. We achieve this by applying the theory of bricolage and geospatial analysis with novel data sets to help fill gaps in data to support evidence-based decision-making.
Bricolage refers to the gathering, mobilization, reassembling, and reuse of existing resources—or the “material at hand”—and we use it as a conceptual approach and methodological technique to overcome challenges of resource or data scarcity. While bricolage has been conceptualized within philosophy and anthropology (Levi-Strauss Citation1966; Deleuze and Guattari Citation1977), design (Garud and Karnøe Citation2003), and entrepreneurship (Vanevenhoven et al. Citation2011), but there has been limited application to digital health geographies. In qualitative research, bricolage describes an approach based on “eclecticism, emergent design, flexibility and plurality” (M. Rogers Citation2012, 1). Drawing on the concept of bricolage we develop an adaptive methodological design that gathers and combines available secondary data to offer additional analysis capabilities termed data bricolage. Data bricolage enables the production of new data sets and analytical methods that expand the range of data choices in targeted locations, themes, or subjects, which can be orientated through partnerships with health organizations. By “making do” with existing, alternative, and novel sources of data, data bricolage offers a way of addressing data scarcity while incorporating lived experience. In this article we use data bricolage to address scarce qualitative lived experience mental health data for rural areas and demonstrate methods for determining thresholds of sufficient data availability through identification of spatial densities. In the context of rural mental health, adopting data bricolage as an approach to data scarcity improves analysis of qualitative experiences of mental health services, while reducing costs of collecting data (Vanevenhoven et al. Citation2011). It also cuts the burden placed on people with mental ill health to produce new primary sources of data (Kamstra et al. Citation2022). In doing so, we create new sources of data that represent the voices of those with lived experiences of service (in)accessibility in rural areas (Phillimore et al. Citation2019).
To test the concept of data bricolage, we worked with three NFP organizations to access their geolocated online mental health forum data sets. These represent a form of place-based qualitative mental health data. Online forums are increasingly used by individuals living in rural locations as a place of support or the first point of contact with the wider mental health system (Kang et al. Citation2022; Kilpatrick et al. Citation2022; Steiner et al. Citation2023; Kilpatrick et al. Citation2023). Previous work has focused on rural service delivery (Rost et al. Citation2002; Garrett et al. Citation2012) or worked with NFP data sets to identify overlaps of spatial mental health data (Kamstra et al. Citation2022), but few have used these methods to elicit authentic, place-based, lived experience and service access gaps.
The following section describes data bricolage as applied through a critical geographic information system (GIS) lens as a novel mixed methodology. We then detail the method of sourcing and integrating online forum data sets for rural places. Geospatial and statistical analysis are then used to identify hot spots of rural forum activity, the results of which are used to select three intrastate case study sites for further qualitative inquiry. This is followed by a description of Penchansky and Thomas’s (Citation1981) theory of access, which was used to code qualitative posts that were made in hot-spot areas. The methods used here are not intended to be prescriptive, but rather to highlight how new knowledge can be uncovered when novel methods of data analysis are applied to preexisting data sets that are integrated in a GIS (i.e., data bricolage). Findings from the qualitative analysis follow with discussion of the utility of data bricolage in informing service planning in contexts of data scarcity.
Data Bricolage Via Critical GIS
The concept of bricolage has been used across a range of academic disciplines to describe or initiate modes of creative problem-solving by using available tools and resources (M. Rogers Citation2012). Originating in the anthropological work of Levi-Strauss (Citation1966), bricolage broadly refers to the generation of new knowledge from a heterogeneous repertoire of available ideas and information in contrast to modernist notions of objective truth creation. In philosophy, Derrida (Citation1967) argued that new language and meanings are continually constituted and reconstituted in relation to existing points of reference in a process of bricolage. The concept has been used in cultural studies to explain the way subcultures cobble together style and meaning from disparate sources readily available (Hebdige Citation2012). These methods contrast with “the Engineer,” who views each problem as isolated from the outside world, necessitating highly specialized tools with which to understand it, and whose findings and understandings are then less applicable to other situations (Levi-Strauss Citation1966).
We adapt the concept of bricolage here to orient our mixed-methods approach to the integration (Fielding and Cisneros-Puebla Citation2009) of data sources “at hand,” often from disparate or unconventional sources, to generate new insights and perspectives. This approach recognizes that in contexts of data or information scarcity, it is necessary to “make do” or piece together data sources to create a more complete picture of a social phenomenon. Andersen (Citation2008) also noted the strengths of bricolage as offering a bottom-up and place-based approach to understanding social phenomena that permits flexibility and creativity, and can promote the agency of citizens producing the data, without losing rich qualitative experiences (Andersen Citation2008). This approach accords with forms of citizen science, data donation (Bietz, Patrick, and Bloss Citation2019), and many forms of critical GIS (Schuurman Citation2000). Gabrys, Pritchard, and Barratt (Citation2016), for example, compiled air quality data sets collected by community members in areas affected by hydraulic fracking and combined these with thirty household monitors. As a form of data bricolage, the researchers reused data already created (in this case by citizens), reimagined how these data could be analyzed (i.e., critical GIS), and uncovered new knowledge as a result (Gabrys, Pritchard, and Barratt Citation2016). These approaches match the trajectory and rationale for critical GIS, which was born out of the resistance to quantitatively focused, epistemologically privileged methods of analysis in geographical research (Schuurman and Kwan Citation2004).
Digital methods have been used to source new types of data from online and digital interactions (R. Rogers Citation2013). Twitter (now X), Facebook, and other social media data have been targeted to understand health trends and experiences (e.g., Chancellor and De Choudhury Citation2020), despite ongoing ethical concerns (Taylor and Pagliari Citation2018). Online health forums have been mined and analyzed both to evaluate their benefits and to identify health trends and insights (Steiner et al. Citation2023). “Big” qualitative data sets such as those produced in online forums can provide rich sources of geolocated lived experience data in the context of rural mental health research. As access to social media data becomes more fraught and unreliable (Bruns Citation2019), however, we argue that there is a need to develop new data collection and analysis techniques based in ethical partnerships with health service providers (Kamstra et al. Citation2022). Such methods, we demonstrate, can offer a place-based analysis similar to Vallée et al.’s (Citation2010) concept of healthscapes, to reveal situations where people’s access to mental health services is likely to be affected by distance and activity space. This aligns with calls to reuse online forum data produced by NFP organizations that host online forums, unlocking potentially critical understandings from data that require no additional collection costs or work (Watkins Citation2022).
Methods
Case Study of Rural Australia
A well-acknowledged rural health system failure in Australia is due to gaps between service need and response. This has been acknowledged by both Australian state (Mental Health Select Committee [MHSC] Citation2022) and federal (Lawrence and Hobson-Powell Citation2018) governments as a challenge that needs to be addressed to improve access to mental health services in rural locations (Parliament of Australia Citation2018). As a result, multiple reviews have been conducted to elicit new data in the form of responses to surveys, consultations, visits to communities to interview residents, and so on. There is a gap, however, in the capability to source ongoing data about lived experiences of mental health services that are more accurate to place and authentic as to peoples’ unprompted needs and (lack of) interactions with public or other services.
Lawrence and Hobson-Powell (Citation2018) suggested a pathway to improving service provision is through innovative qualitative methods that produce data-driven evidence to inform service priority gaps. These gaps in understanding cannot be filled by focusing on quantitative factors, such as service delivery, in isolation from the lived experiences of populations living in rural areas (Rost et al. Citation2002; Garrett et al. Citation2012). Rather than relying on nonstatistical kernel density analyses to identify areas for further qualitative inquiry (Kamstra et al. Citation2019), this study aims to showcase a geostatistical method for identifying qualitative data that is currently underutilized.
How Did We Source Data?
To gain ethics approval, we first partnered with SANE Australia, ReachOut, and Beyond Blue to source online forum data. These NFP organizations host some of Australia’s most popular national online peer support mental health forums. To extend best practice in ethical sourcing and use of online forum data in Australia, we formalized a data-sharing agreement with each organization that ensures the research aims align with the aims of the organization and its service improvement goals, and that the privacy of citizens producing the data is maintained throughout analysis and presentation of the findings. With individual forum users, consent waiver was approved as per Australia’s National Health & Medical Research Centre (Citation2007) guidelines. By building the ethics process around organizational partnerships, we protect health consumers and make them part of the research and service improvement goals. Once the agreements were negotiated, they were individually signed by each organization, which was used to receive university ethics committee approval (R/2019/033).
Following ethics approval, a twenty-nine-month sample (August 2018–December 2020 inclusive) of geolocated and time-stamped forum posts was then obtained from SANE Australia forums (n = 68,634), ReachOut youth (fourteen to twenty-five years old) forums (n = 80,174), and Beyond Blue forums (n = 44,548) and cleaned for analysis (n = 193,356; ). To ensure forum data were deidentified, we removed users’ online pseudonyms and other potentially identifying features (e.g., references to specific locations in posts) prior to analysis.
Table 1 Categorizing of forum posts by organization
As the focus of this study is on data scarcity in rural areas, we isolated all forum posts made by people living in “rural” areas, which we define using the Australian Statistical Geography Standard (ASGS) Remoteness Structure (Australian Bureau of Statistics [ABS] Citation2018) as all areas outside of “major cities.” We then isolated posts made by rural-located users by linking their postcode to each post. Postcodes are commonly used by many researchers and businesses as a way of linking data to a geographic area for spatial analysis (ABS Citation2011); however, we note that the geographic areas denoting postcode boundaries are approximate administrative or environmental boundaries that are not clearly defined by the ABS (Citation2011). Given the large number of data points (n = 193,356) located in large geographic areas, we chose to search for the most data-rich geographic areas to conduct further qualitative inquiry, similar to a joint display commonly used in mixed-methods research (Guetterman, Fetters, and Creswell Citation2015). Drawing on bricolage theory, we then integrated newly available rural post data sets into one geographic layer to identify the most data-rich geographic areas for analysis (for a more detailed description of this process see Appendix A).
How Did We Find Data-Rich Areas?
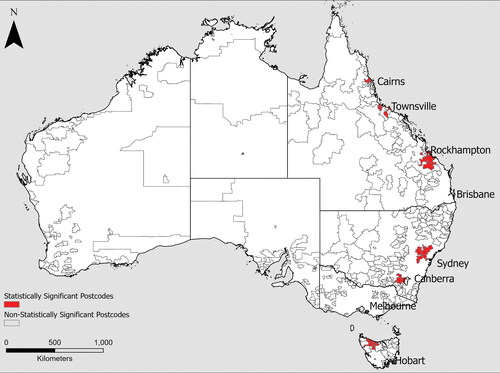
We first developed a method to identify sites that meet a geographic threshold of data-rich “hot spots” to identify the areas that have the highest density of lived experience data for qualitative analysis. Forum data sets present an opportunity to perform this mixed-methods analysis by first leveraging statistical quantitative analysis to determine the most spatially data-rich hot spot areas, before performing qualitative analysis of forum post content in these areas (see Appendix A for technical details). We worked within ESRI ArcGIS, and applied a hot spot analysis using the Getis–Ord Gi* statistic (Getis and Ord Citation1992) to identify broad areas of high forum post activity. In our case study, this analysis resulted in the identification of hot spots consisting of—six to ten clusters of proximate postcodes where—for most or all postcodes—the mean number of post authors is significantly higher than that of the whole data set. The output of this test provides the ability to identify the areas with a large number of posts and the highest number of authors in the same postcode. This is important to ensure the number of post authors (i.e., individual users) within each postcode provides an assessment of the inclusion of a relatively greater range of individuals’ experiences. This optimizes the diversity of qualitative experiences that will be present in the data.
The hot spots identified in represent spatial areas of statistically higher forum activity than other dark areas with nonstatistically high levels of forum activity.
Figure 1 Map showing results of the hot spot analysis in which the red areas are clusters of postcodes that contain statistically significant amounts of authors, when compared to all other postcodes where posts were made. The names of the cities or regions are used here for broad visual identification purposes.
How Did We Select Sites within Data-Rich Areas?
As these hot spots often contain several thousand individual posts, given the time constraints of qualitative analysis we chose to further analyze these hot spots to refine site selection to the most data-rich postcodes using a cluster analysis. Cluster and outlier analysis using Anselin local Moran’s I statistic (Anselin Citation1995) was used to isolate specific postcodes. Anselin local Moran’s I (Anselin Citation1995) statistic identifies statistically significant clusters and is commonly used in hot spot analysis—initially to identify broad areas, which are then refined using cluster and outlier analysis (Jana and Sar Citation2016). Cluster and outlier analysis allows for refinement within hot spots to extract specific postcodes where forum activity (i.e., number of authors) is highest, aiding the site-selection process (, inset).
Figure 2 Map showing the cluster and outlier analysis results as applied to the sites identified through hot spot analysis (). Red (high–high clusters) postcodes have statistically high numbers of authors and are spatially close to postcodes that also have significantly high numbers of authors. Blue (low–high outliers) postcodes have a statistically low number of authors and are spatially close to postcodes with a statistically high number of authors. Identifying these clusters and outliers further assists in selecting the most data-rich, spatially proximate postcodes for further qualitative analysis.
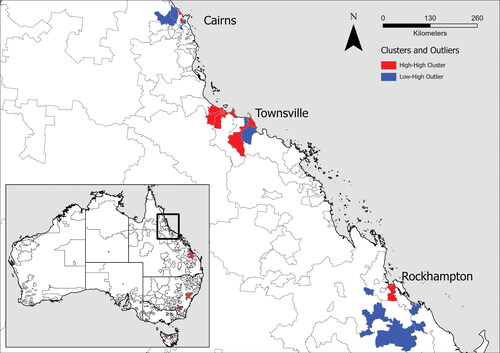
Cluster and outlier analysis identified postcodes across rural Australia that could serve as case study sites for further analysis. We chose to focus on three sites within the same state of Queensland, however, rather than choosing hot spots across multiple states. This selection was made as people using the forums in the same state are more likely to experience similar health policy and health system challenges due to their similar geography, and, as a result, will share similar issues relevant to rural mental health service access (e.g., relating to public transport availability, costs, etc). The hot spot locations identified following the statistical processes just presented were Cairns (population 150,000; distance from state capital Brisbane = 1700 km), Townsville (population 170,000; 1350 km), and Rockhampton (population 83,000; 650 km; ).
How Did We Check for Analytical Validity?
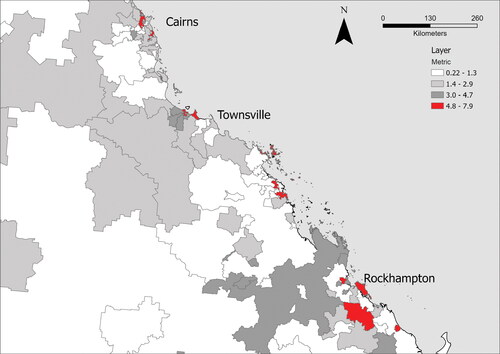
A more detailed reading of the data set by the research team made it clear that forum use characteristics vary between postcodes. In some postcodes, for example, a single author might post many times, whereas in others—twenty to thirty authors might post once or twice. As the number of authors and posts vary (e.g., posts range between 1 and 7,189 per postcode, and authors range from one to thirty-one per postcode), examining only authors or volume of posts when discussing forum use does not expose where the greatest amount of “forum activity” or diversity of authors posting frequently occurs. To refine this issue, a mathematical analysis was performed by combining the statistical z score for both the number of posts and the number of authors from each postcode. These z scores are used to calculate how a sample differs from the data set’s mean value. Combining z scores for both posts and authors is not intended to produce a statistical analysis; rather, it uses common statistical tools to highlight areas that contain both high numbers of posts and authors. For ease-of-use considerations, a constant was added to each score to bring each score to lie between 0 and 10 inclusive (; see Appendix B for further details).
Figure 3 Map showing an index of data validity, for this study’s data, applied to Queensland postcodes. The metric is a sum of two z scores, with the lowest possible value of 0 and the highest possible value of 10. The highest metric score for the current data set is 7.9. Postcodes with scores above 4.8 have been highlighted (shaded red), as these represent the highest 10 percent of metric scores. Note that the shaded areas are broadly similar to those highlighted through hot spot analysis and cluster and outlier analysis.
Having used these site selection methods to identify data-rich and valid and diverse cases, we then proceeded to extract the forum post data from selected postcodes. This process is used for further qualitative analysis, which is described using the concept of access to service later.
How Did We Qualitatively Code Data?
Qualitative forum post data from the target hot spots of forum activity locations were then deductively analyzed using a conceptual framework of access to health services. Here, we draw on Penchansky and Thomas’s (Citation1981) theory of access as it is well established in the field of health services research (Levesque, Harris, and Russell Citation2013; Russell et al. Citation2013) and can be easily applied to the type of authentic, but concise qualitative data under investigation. The aim of using this theoretical framework to code online forum data is to explore how using hot spots of data bricolage can provide new insights into the nature of rural peoples’ challenges in accessing services ().
Table 2 Theory of access and definition
Penchansky and Thomas (Citation1981) conceptualized access as the degree to which a health service fits the needs of consumers, whereby increasing alignment between service and consumers’ needs increases their access to services. The framework has five factors: accessibility (i.e., location of supply aligns with location of consumers), acceptability (i.e., health-care providers make consumers feel accepted), accommodation (i.e., health care is flexible to accommodate consumers’ needs), affordability (price of service meets consumers’ ability to pay), and availability (i.e., size or volume of supply meets consumers’ needs). Importantly, all these factors are needed for optimal access; if one or more factors is not operational, Penchansky and Thomas (Citation1981) suggested that overall access declines ().
Forum post data were coded using NVivo (version 1.5.2). Researchers conducted an initial read-through of a sample of posts (n = 200) to identify words and phrases that aligned with the deductive coding framework in . This led to a discussion of the “boundaries” of each code, after which two researchers used this initial framework to systematically code a further sample (n = 200), which was then checked by two further researchers for intercoder reliability (Braun and Clarke Citation2006) with bounding words, phrases, and themes being refined in each code. Further discussion led to the refinement of each code and the creation of a final codebook that was systematically applied to the entire data set (n = 1876 posts). This process created a framework for coding data against themes of access.
Results
The findings reported in this section are based on the coding of aggregated posts across the three identified intrastate case study sites. Although we could explore access themes within each hot spot case study site individually, the sample of posts was considered too small to yield informative results. Thus, to showcase the potential of this method, we instead chose to treat the data of the three case study sites as one large sample of forum activity.
Access Experiences
shows that between August 2018 and December 2020, a total of 178 different authors wrote the 1,876 posts, which were analyzed across the three target geographical locations, as follows: Townsville authors = 48, posts = 1627; Cairns authors = 36, posts = 178; Rockhampton authors = 25, posts = 71.
Table 3 Results of the qualitative coding by case study site in Queensland, Australia
Accommodation was the access theme with the highest number of coded posts (n = 67), followed by availability (n = 35), awareness (n = 34), acceptability (n = 28), affordability (n = 6), and accessibility (n = 4).
Posts coded to accommodation (i.e., service access flexes to meet needs) were motivated by difficulties finding a service provider that the forum user felt was organized or able to “fit” their individual needs, as demonstrated here:
It is definitely a “fit issue” with the psych. I just don’t feel like I’m getting anywhere and she is focusing on the wrong thing. (SANE Australia forum post #30562)
I will definitely look into seeing a different doctor or psych. Unfortunately, I live in a small town too, so some options are limited. (Beyond Blue post #20896)
I am struggling so much. I live in a small town, the GP we have here knows nothing about Mental illness, he basically just tells me it’s all in my mind and not an actual illness! (SANE post #27064)
I also [am] stressed about money and couldn’t understand why I needed to pay someone so much money to only talk to them for 50 min!?!?! And just to have them confirm what I already knew? The money thing was a big thing for me actually, I refused to pay that much because what if it didn’t work and I just wasted all that money for nothing? (Youth Reach Out forum post #47354)
I have read about it and even enquired about possibly getting the treatment but the response I got was there is little evidence that it helps and the nearest facility that has the equipment to do it is 4 hours drive, I forget how many sessions and frequency they said would be needed but I do remember thinking this is going to be a problem with work. (Beyond Blue post #45032)
Discussion
Data Bricolage for Data Scarcity
To our knowledge, this is the first study to apply the concept of data bricolage to explore how online mental health forum data can be reused to inform service provision in contexts of data scarcity (here, rural Australia). Although the concept of bricolage has been used in scholarship for more than fifty years, its application to the geohumanities and digital health geography has been nascent. Our study demonstrates how data bricolage can be used by government, researchers, and practitioners to leverage health consumer data already collected by NFP organizations to inform health service challenges (Watkins Citation2022).
The reuse of preexisting, but underutilized, organizational data is an example of Levi-Strauss’s (Citation1966) original conception of creating new knowledge by reusing resources already in existence. By partnering with mental health NFPs, and through the application of data bricolage, we were able to reuse data sources to identify lived experience data and create a localized understanding of mental health in place (Derrida Citation1967; Andersen Citation2008). Complemented by qualitative analysis of more than 2,000 posts, this exploration shows that it is possible for health service providers to make the most of data resources already collected. Latent data sets from a range of other organizations could provide new value for informing innovation in what were previously regarded as data-scarce environments (Vanevenhoven et al. Citation2011; Halme, Lindeman, and Linna Citation2012).
A key tenet of bricolage is the combining or integrating of eclectic sources of data to uncover new knowledge (M. Rogers Citation2012). This study combined three very similar types of data in a GIS to assess how the integration of these data sources could produce new knowledge. As this was an exploratory study, the choice to use similar data formats was made with ease-of-use constraints in mind. To expand this analysis, geolocated health service search data could be integrated from other organizations (in Australia, CARE Opinion, and Infoxchange manage such data). This would add further quantitative and qualitative depth to the analysis of service access exemplified in this exploratory case study. Analytical methods can also be expanded. With some data types, social network analysis and related methods can help to inform the connections people make within geospatial areas. We also suggest the usefulness of tracking health consumer experiences over time, both to build a more detailed picture of place-based need, and to follow patterns of change (Kang et al. Citation2022). The exploratory application of data bricolage here is presented simply as an attempt to unpack and apply the concept to the health geographies, in the hope that others will experiment with and expand on these ideas in future work.
Site Selection in Data-Scarce Contexts
Applying quantitative GIS statistical techniques proved useful to direct site selection within this case study. The two-step processes of hot spot and cluster and outlier analysis enabled a targeted place-based analysis, where place was defined using spatial statistics connected postcodes, to find the most data-rich areas. This two-phase geographic and statistical methodology expands the way data hot spots can be identified for joint displays (Ivankova, Creswell, and Stick Citation2006), beyond the more traditionally used qualitative ground visualization (Knigge and Cope Citation2006) or quantitative kernel densities analysis used in other qualitative GIS-based research (Kamstra et al. Citation2019). The creation of the data validity check as a nonspatial tool to analyze spatial data sets helps to expand the capabilities of researchers and organizations that might not be trained in, or have the necessary GIS programs, to perform spatial analysis. The validity check also encapsulates the essence of data bricolage: applying z scores (“materials at hand”) across multiple data sets (reuse of existing resources) to overcome challenges in data scarcity.
This methodology and its associated appendices were also designed for replication, with the view that these tools could be used by those without a background in spatial analysis.
Our hope is that these methods could be applied by researchers wishing to analyze mixed (quantitative and qualitative) data sets including refining place-based analysis in the health sciences (Vallée et al. Citation2010).
The quantitative GIS techniques presented are particularly useful when identifying areas that are reaching thresholds of data richness for further investigation. Although this study responds to scarce rural data, the process of site selection highlighted areas that are generally considered rural cities (e.g., Townsville, population of 178,000), on which qualitative analysis was performed. This suggests that, within the context of a national-level case study, these areas had reached a threshold of data richness for which further analysis could be targeted, not that they are the only areas of service access need. It is important to note that the data sets used in this study present a snapshot of online forum mental health data, which exists as an ongoing and emerging data set.
Qualitative Analyses
The concept of data bricolage or reusing of health forum data provides an “authentic” source of information about rural people’s experiences of accessing (or not) service systems, as posts are voluntarily provided by authors in discussions about their own experiences and queries, outside the boundaries of top-down questionnaire formulation by researchers, clinicians, or funding bodies. Such authentic experience data might express a “truer” version of the access landscape than can be captured within more formalized research processes (Russell et al. Citation2013). Importantly, the use of data bricolage is a quick, cost-effective way to gain place-based and highly localized insights, which can then be used to complement other forms of primary data collection. Reusing data sets that capture authentic experiences, as exemplified here, might not replace, but would certainly complement community consultations and interviews across a range of remote places, which are inevitably selective and might leave out people reticent to come forward.
The example and exploratory analysis shows that accommodation and availability were the most frequently coded access themes. Factors of accessibility (i.e., distance to services) and affordability (i.e., cost), are often significant discussion points in the broader discourse of challenges in health services (Lawrence and Hobson-Powell Citation2018; MHSC Citation2022). This juxtaposition highlights insights that can be gained using novel, authentically communicated data sources, such as those found through data bricolage.
Implications for Policy and Practice
Improving access to, and application of, novel secondary data sources has wide-ranging potential for both policy and practice. This article has shown that partnerships between NFPs and researchers can unlock spatial and thematic insights from data that have previously been underutilized in contexts of data scarcity such as rural mental health service access. Lived experience mental health data have historically been difficult and costly to gather but are necessary for planning and operating effective mental health service provision. We have demonstrated how mental health forum data to capture spatial and temporal trends, in partnership with mental health service providers, can bolster and extend traditional qualitative or quantitative methods. Not only do “data-driven partnerships” (Susha, Grönlund, and Van Tulder Citation2019) help to leverage new kinds of digital health consumer data for public good, such partnerships can navigate ethical concerns (Taylor and Pagliari Citation2018) and overcome restrictions to social media data access (Bruns Citation2019).
Linking forum data from multiple NFPs and conducting geospatial analysis presents the opportunity to assess areas from which increased amounts of data are being produced, and as such, areas that could be experiencing issues of service shortfall (Leavey et al. Citation2016) or crisis (Amara, Hadj Taieb, and Aouicha Citation2021). Quantitative analysis of these trends can be used to inform national or state mental health service provision, and a more localized approach can be applied to understand community-specific needs. Provision of these data to local health care services can aid in determining what services are needed, when, and where, or inform wider public health monitoring.
This study highlights the rich, untapped vein of authentic lived experience mental health data that is accessible to policymakers and researchers through the application of data bricolage. Given calls for further mental health data collection in regional areas (Senate Community Affairs References Committee Citation2018), this study has shown that by reframing the types of data used within public health management, there is the opportunity to gain decision-making insight without the need for costly data collection.
One area that is amenable to the approach laid out in this article is using it to “train” artificial intelligence (AI) for informing public services. The role of big data and AI within mental health research is still developing, yet its application to forum data sets will dramatically increase the analytical power of current human-driven methods used by mental health organizations. Machine learning algorithms are already being trained using social media data sets to diagnose mental health conditions (Calvo et al. Citation2017). The development of natural language processing (NLP) models to identify key mental health indicators from forum data sets have shown promise, especially when linked to expert-driven qualitative coding (Kang et al. Citation2022). This exploratory case study adds to this literature by identifying novel sources of authentic secondary data, primarily through ethical and responsible partnerships with NFP organizations. The use of geolocated, naturalistic, and anonymous data sets, “authentically” discussing mental health challenges would be a powerful resource to help refine these already powerful tools (Milne et al. Citation2016). Reapplying the methods within this work within an AI or NLP process can enable much larger data sets to be analyzed in real time (D’Alfonso Citation2020), offering greater insight for NFP decision makers.
Limitations and Future Directions
Health researchers encourage engagement with localized and lived experience data to build contextual understandings of phenomena, but others rightly point out that those citizens who generate the data (Williams Citation2020) need to have a specific voice in what their data are to be used for. The philosophical underpinnings of data bricolage lean toward bottom-up processes of knowledge generation such as this and present an opportunity to reconceptualize how individuals are included in data management systems. Many movements are being made to include citizens in data conversations, but this is not yet mainstream, and indeed organizations that gather the data are only now coming to terms with how the repositories of data they have collected as part of providing a service can be reused for research purposes.
Within the current data sets, forum users make explicit comments linking the facets of access to specific types of mental health-care providers, such as clinical psychologists, psychiatrists, and general practitioners. Future research could focus on a data bricolaged, place-based analysis of these forms of service provision for specific areas, with the view to uncovering localized service-related challenges. As finding data linked to these specific services are publicly available, data bricolage could form the basis for a richer place-based analysis of rural mental health, adding to the literature on primary health care neighborhoods (Vallée et al. Citation2010).
Conclusions
This article has built on the rich vein of bricolage theory to develop a novel mixed methodology for researchers to partner with NFP organizations with the aim of reusing and analyzing their service data—in our case to explore mental health service access gaps in rural areas. The mixed-methods, GIS-based analysis described is based on accessible GIS computer software, free or commonly available through online registration. The spatial statistics described aimed to balance statical analysis with ease of use for operators who might be unfamiliar or have limited time to train. Further, the “index” can be calculated with or without access to GIS software, creating an accessible method of measuring levels of engagement within mental health forums.
Qualitative coding practices based on long-standing health-care access theories provide a replicable framework for analyzing mapped qualitative lived experience data, while fitting into a widely used vocabulary and problem definition framework. This suite of methods is not prescriptive, it simply opens the door to the analysis of hitherto underutilized data sets. This is by no means a holistic list of possible approaches, nor do all methods have to be used or in the specified order. Through the application of data bricolage within a health geographies context, this study aimed to expose readers to various tools, hoping they could be used or inspire further research in the area while also showing what kind of understanding can be possible using bricolaged data and a suite of relatively simple analysis techniques.
Acknowledgments
The authors would like to thank the two anonymous reviewers for their insightful comments and suggestions.
Disclosure Statement
No potential conflict of interest was reported by the authors.
Additional information
Funding
Notes on contributors
Thomas Savige
THOMAS SAVIGE is a mixed-methods researcher at the Social Innovation Research Institute at Swinburne University, Hawthorn, Victoria, Australia. E-mail: [email protected]. He builds quantitative spatial models examining trends in mental health and community connection.
Peter Kamstra
PETER KAMSTRA is a Postdoctoral Research Fellow at the Social Innovation Research Institute at Swinburne University, Hawthorn, Victoria, Australia. E-mail: [email protected]. His research uses spatial analytics and big data in partnership with multiple social purpose organizations to address Australia’s contemporary community health problems. His work produces applied insights that can be used to improve community mental health services, bushfire emergency response, and drowning prevention. His current research explores rural health services, social media practices, and publics with an emphasis on mixed-methods GIS-based analyses.
Anthony McCosker
ANTHONY McCOSKER is the Swinburne University lead Chief Investigator for the ARC Centre of Excellence for Automated Decision Making + Society (ADM + S), Hawthorn, Victoria, Australia. E-mail: [email protected]. His research addresses digital inclusion and inequality in the adoption of new technology, particularly in relation to health care and social services.
Jane Farmer
JANE FARMER is Director of the Social Innovation Research Institute (SIRI) at Swinburne University, Hawthorn, Victoria, Australia. E-mail: [email protected]. Her current research focuses on community co-design, community sector data analytics, social connection, and well-being in different community settings.
Literature Cited
- Amara, A., M. A. Hadj Taieb, and M. B. Aouicha. 2021. Multilingual topic modeling for tracking COVID-19 trends based on Facebook data analysis. Applied Intelligence 51 (5):3052–73. doi: 10.1007/s10489-020-02033-3.
- Andersen, O. J. 2008. A bottom-up perspective on innovations: Mobilizing knowledge and social capital through innovative processes of bricolage. Administration & Society 40 (1):54–78. doi: 10.1177/0095399707311775.
- Anselin, L. 1995. Local indicators of spatial association—LISA. Geographical Analysis 27 (2):93–115. doi: 10.1111/j.1538-4632.1995.tb00338.x.
- Australian Bureau of Statistics (ABS). 2011. Postcodes and postal areas. Canberra: Australian Bureau of Statistics.
- Australian Bureau of Statistics (ABS). 2018. The Australian Statistical Geography Standard (ASGS) remoteness structure. Canberra: Australian Bureau of Statistics.
- Bietz, M., K. Patrick, and C. Bloss. 2019. Data donation as a model for citizen science health research. Citizen Science: Theory and Practice 4 (1):1–11. doi: 10.5334/cstp.178.
- Braun, V., and V. Clarke. 2006. Using thematic analysis in psychology. Qualitative Research in Psychology 3 (2):77–101. doi: 10.1191/1478088706qp063oa.
- Bruns, A. 2019. After the “APIcalypse”: Social media platforms and their fight against critical scholarly research. Information, Communication & Society 22 (11):1544–66. doi: 10.1080/1369118X.2019.1637447.
- Calvo, R. A., D. N. Milne, M. S. Hussain, and H. Christensen. 2017. Natural language processing in mental health applications using non-clinical texts. Natural Language Engineering 23 (5):649–85. doi: 10.1017/S1351324916000383.
- Chancellor, S., and M. De Choudhury. 2020. Methods in predictive techniques for mental health status on social media: A critical review. NPJ Digital Medicine 3 (1):43. doi: 10.1038/s41746-020-0233-7.
- D’Alfonso, S. 2020. AI in mental health. Current Opinion in Psychology 36:112–17. doi: 10.1016/j.copsyc.2020.04.005.
- Deleuze, G., and F. Guattari. 1977. A thousand plateaus: Capitalism and schizophrenia. Vol. 1. New York: Viking.
- Derrida, J. 1967. Writing and difference. London: Routledge and Kegan Paul.
- Fielding, N., and C. A. Cisneros-Puebla. 2009. CAQDAS-GIS convergence: Toward a new integrated mixed method research practice? Journal of Mixed Methods Research 3 (4):349–70. doi: 10.1177/1558689809344973.
- Gabrys, J., H. Pritchard, and B. Barratt. 2016. Just good enough data: Figuring data citizenships through air pollution sensing and data stories. Big Data & Society 3 (2):205395171667967. 2053951716679677. doi: 10.1177/2053951716679677.
- Garrett, C. R., L. L. Gask, R. Hays, A. Cherrington, C. Bundy, C. Dickens, W. Waheed, and P. A. Coventry. 2012. Accessing primary health care: A meta-ethnography of the experiences of British South Asian patients with diabetes, coronary heart disease or a mental health problem. Chronic Illness 8 (2):135–55. doi: 10.1177/1742395312441631.
- Garud, R., and P. Karnøe. 2003. Bricolage versus breakthrough: Distributed and embedded agency in technology entrepreneurship. Research Policy 32 (2):277–300. doi: 10.1016/S0048-7333(02)00100-2.
- Getis, A., and J. K. Ord. 2010. The analysis of spatial association by use of distance statistics. Geographical Analysis 24 (3):189–206. doi: 10.1111/j.1538-4632.1992.tb00261.x.
- Guetterman, T. C., M. D. Fetters, and J. W. Creswell. 2015. Integrating quantitative and qualitative results in health science mixed methods research through joint displays. Annals of Family Medicine 13 (6):554–61. doi: 10.1370/afm.1865.
- Halme, M., S. Lindeman, and P. Linna. 2012. Innovation for inclusive business: Intrapreneurial bricolage in multinational corporations. Journal of Management Studies 49 (4):743–84. doi: 10.1111/j.1467-6486.2012.01045.x.
- Hebdige, D. 2012. Subculture: The meaning of style. London and New York: Routledge.
- Helbardt, S., D. Hellmann-Rajanayagam, and R. Korff. 2010. War’s dark glamour: Ethics of research in war and conflict zones. Cambridge Review of International Affairs 23 (2):349–69. doi: 10.1080/09557571003752688.
- Ivankova, N., J. Creswell, and S. Stick. 2006. Using mixed-methods sequential explanatory design: From theory to practice. Field Methods 18 (1):3–20. doi: 10.1177/1525822X05282260.
- Jana, M., and N. Sar. 2016. Modeling of hotspot detection using cluster outlier analysis and Getis–Ord Gi* statistic of educational development in upper-primary level, India. Modeling Earth Systems and Environment 2 (2):1–10. doi: 10.1007/s40808-016-0122-x.
- Kamstra, P., B. Cook, D. M. Kennedy, and C. Brennan-Horley. 2019. Qualitative GIS to relate perceptions with behaviors among fishers on risky, rocky coasts. The Professional Geographer 71 (3):491–506. doi: 10.1080/00330124.2018.1559656.
- Kamstra, P., J. Farmer, A. McCosker, F. Gardiner, H. Dalton, D. Perkins, L. Salvador-Carulla, and N. Bagheri. 2022. A novel mixed methods approach for integrating not-for-profit service data via qualitative geographic information system to explore authentic experiences of ill-health: A case study of rural mental health. Journal of Mixed Methods Research 17 (4):419–42. doi: 10.1177/15586898221135291.
- Kang, Y.-B., A. McCosker, P. Kamstra, and J. Farmer. 2022. Resilience in web-based mental health communities: Building a resilience dictionary with semiautomatic text analysis. JMIR Formative Research 6 (9):e39013. doi: 10.2196/39013.
- Kilpatrick, S., S. Emery, J. Farmer, and P. Kamstra. 2022. Wellness impacts of social capital built in online peer support forums. International Journal of Environmental Research and Public Health 19 (23):15427. doi: 10.3390/ijerph192315427.
- Kilpatrick, S., J. Farmer, S. Emery, P. Kamstra, A. Steiner, A. McCosker, and K. Carlisle. 2023. Community transformed? Exploring the interaction between online support and rural community life for people with acute mental health conditions. Journal of Rural Studies 99:167–75. doi: 10.1016/j.jrurstud.2023.02.014.
- Knigge, L., and M. Cope. 2006. Grounded visualization: Integrating the analysis of qualitative and quantitative data through grounded theory and visualization. Environment and Planning A: Economy and Space 38 (11):2021–37. doi: 10.1068/a37327.
- Lawrence, A., and A. Hobson-Powell. 2018. Exercise & Sports Science Australia submission to the Senate Standing Committees on Community Affairs. Accessed February 20, 2020. https://www.essa.org.au/Public/Public/Advocacy/Submissions___Lobbying.aspx?hkey=c93f1282-dfcc-4ce7-8b04-a84e6df12311.
- Leavey, G., M. Rosato, K. Galway, L. Hughes, S. Mallon, and J. Rondon. 2016. Patterns and predictors of help-seeking contacts with health services and general practitioner detection of suicidality prior to suicide: A cohort analysis of suicides occurring over a two-year period. BMC Psychiatry 16 (1):120. doi: 10.1186/s12888-016-0824-7.
- Levesque, J.-F., M. F. Harris, and G. Russell. 2013. Patient-centred access to health care: Conceptualising access at the interface of health systems and populations. International Journal for Equity in Health 12 (1):18. doi: 10.1186/1475-9276-12-18.
- Levi-Strauss, C. 1966. The savage mind. Chicago: University of Chicago Press.
- McCosker, A. 2018. Engaging mental health online: Insights from BeyondBlue’s forum influencers. New Media & Society 20 (12):4748–64. doi: 10.1177/1461444818784303.
- Mental Health Select Committee. 2022. Inquiry into the opportunities to improve mental health outcomes for Queenslanders. Parliament of Queensland, Australia. Accessed February 20, 2020. https://documents.parliament.qld.gov.au/tp/2022/5722T743-64F1.pdf.
- Milne, D. N., G. Pink, B. Hachey, and R. A. Calvo. 2016. Clpsych 2016 shared task: Triaging content in online peer-support forums. In Proceedings of the Third Workshop on Computational Linguistics and Clinical Psychology, 118–27. San Diego: Association for Computational Linguistics.
- National Health and Medical Research Council 2007. National statement on ethical conduct in human research. Canberra, Australia: National Health and Medical Research Council.
- Parliament of Australia. 2018. Senate inquiry into accessibility and quality of mental health services in rural and remote Australia. Accessed February 14, 2020. https://www.aph.gov.au/Parliamentary_Business/%20Committees/Senate/Community_Affairs/MentalHealthServices/Report.
- Penchansky, R., and J. W. Thomas. 1981. The concept of access: Definition and relationship to consumer satisfaction. Medical Care 19 (2):127–40. doi: 10.1097/00005650-198102000-00001.
- Phillimore, J., H. Bradby, M. Knecht, B. Padilla, and S. Pemberton. 2019. Bricolage as conceptual tool for understanding access to healthcare in superdiverse populations. Social Theory & Health 17 (2):231–52. doi: 10.1057/s41285-018-0075-4.
- Rogers, M. 2012. Contextualizing theories and practices of bricolage research. Qualitative Report 17:7.
- Rogers, R. 2013. Digital methods. Cambridge, MA: MIT Press.
- Rost, K., J. Fortney, E. Fischer, and J. Smith. 2002. Use, quality, and outcomes of care for mental health: The rural perspective. Medical Care Research and Review: MCRR 59 (3):231–65. doi: 10.1177/1077558702059003001.
- Russell, D. J., J. S. Humphreys, B. Ward, M. Chisholm, P. Buykx, M. McGrail, and J. Wakerman. 2013. Helping policy‐makers address rural health access problems. The Australian Journal of Rural Health 21 (2):61–71. doi: 10.1111/ajr.12023.
- Schuurman, N. 2000. Trouble in the heartland: GIS and its critics in the 1990s. Progress in Human Geography 24 (4):569–90. doi: 10.1191/030913200100189111.
- Schuurman, N., and M.-P. Kwan. 2004. Guest editorial: Taking a walk on the social side of GIS. Cartographica: The International Journal for Geographic Information and Geovisualization 39 (1):1–3. doi: 10.3138/K3J7-6171-J4K0-868J.
- Senate Community Affairs References Committee. 2018. Accessibility and quality of mental health services in rural and remote Australia. Canberra: Parliament of Australia.
- Steiner, A., J. Farmer, P. Kamstra, K. Carlisle, A. McCosker, and S. Kilpatrick. 2023. Online mental health forums and rural resilience in Australia: A mixed methods study and logic model. JMIR Mental Health 10:e47459. doi: 10.2196/47459.
- Susha, I., Å. Grönlund, and R. Van Tulder. 2019. Data driven social partnerships: Exploring an emergent trend in search of research challenges and questions. Government Information Quarterly 36 (1):112–28. doi: 10.1016/j.giq.2018.11.002.
- Taylor, J., and C. Pagliari. 2018. Mining social media data: How are research sponsors and researchers addressing the ethical challenges? Research Ethics 14 (2):1–39. doi: 10.1177/1747016117738559.
- Vallée, J., E. Cadot, F. Grillo, I. Parizot, and P. Chauvin. 2010. The combined effects of activity space and neighbourhood of residence on participation in preventive health-care activities: The case of cervical screening in the Paris metropolitan area (France). Health & Place 16 (5):838–52. doi: 10.1016/j.healthplace.2010.04.009.
- Vanevenhoven, J., D. Winkel, D. Malewicki, W. L. Dougan, and J. Bronson. 2011. Varieties of bricolage and the process of entrepreneurship. New England Journal of Entrepreneurship 14 (2):53–66. doi: 10.1108/NEJE-14-02-2011-B005.
- Watkins, D. C. 2022. Secondary data in mixed methods research. Thousand Oaks, CA: Sage.
- Williams, S. 2020. Data action: Using data for public good. Cambridge, MA: MIT Press.
Appendix A:
Hot Spot Analysis
Working within ArcGIS, hot spot analysis using the Getis–Ord Gi* statistic (Getis and Ord Citation1992) was used to find adjoining postcodes that contain statistically significant high numbers of authors. Hot spot analysis using a nearest neighbor method essentially asks if each neighborhood of features (i.e., posts) is significantly different from the wider study area. The nearest neighbor analysis takes the feature of an area (in this case, the number of authors within a given postcode) and then combines this feature with the surrounding areas’ features to create an average for the region. This allows for a broad place-based analysis whereby spatially proximate postcodes could be assumed to have relatively similar accessibility to mental health services.
Due to ease-of-use constraints, the quantitative GIS methods applied did not aim to incorporate a full multivariant analysis (e.g., analysis of variance or analysis of covariance). Building this form of analysis into either preexisting hot spot or cluster and outlier methods is possible, but requires further training in spatial and statistical methods, a step the researchers felt would limit the accessibility of the current method. The results of the data metric broadly align with those of the GIS-based spatial analysis, showing both the validity of the quantitative analysis and highlighting the opportunity for less technical, bricolaged approaches to produce adequate outcomes for site selection. Using the results from either method would have resulted in a similar group of areas being selected for quantitative analysis. The addition of the metric shows that both author and post activity can be accounted for in a relatively simple calculation, requiring less technical expertise and without necessitating access to expensive technical software.
Appendix B:
Data Validity Check
Z scores are a common statistical measure, indicating how many standard deviations a data point lies from the mean of the sample (e.g., a z score of +1 indicates the observed value is one standard deviation higher than the mean). Z scores are calculated using the observed value, the sample mean, and standard deviation. This means that observed values above the population mean will result in a positive z score, whereas values below the mean result in a negative score. A combined z score was calculated for each postcode, for both the number of authors and the number of posts. These two scores were then summed to more easily identify areas that were higher than the population mean in both number of authors and number of posts (). It should be noted that this score is not intended as a statistical measure, only as an indicative ranking tool.
Results from the combined z score metric are shown in , with the highest ranking 10 percent of postcodes highlighted in red. A combined z score of 10 would indicate that both the number of authors and the number of posts in that postcode are likely many standard deviations above the mean for those data sets, respectively. The maximum score of 7.9 indicates that some postcodes contained both statistically high author and high post data. The highest ranking 10 percent of postcodes have been highlighted as an indication of their spatial distribution. The z score method for analyzing both author and post data highlighted many of the same areas and postcodes as the methods of spatial analysis, reinforcing the appropriateness of the original methods of site selection.