Abstract
Noback I., Broersma L. and van Dijk J. Gender-specific spatial interactions on Dutch regional labour markets and the gender employment gap, Regional Studies. This paper analyses gender-specific employment rates and the gender employment gap in Dutch municipalities for 2002. The novelty of this analysis is that it takes into account the extent to which gender-specific education, income, and unemployment influence the male and female employment rates and gender gap. Men and women often do not compete for the same jobs, but rather it is found that high male unemployment has an indirect, positive significant effect on female employment rates. The gender employment gap narrows with female education and in urban areas and it widens with the care-prone age composition of the municipal population.
Noback I., Broersma L. and van Dijk J. 荷兰区域劳动力市场中基于性别差异的空间互动以及性别就业差距,区域研究。本文分析了荷兰 2002 年中市级层面基于性别的就业率以及就业差距。本分析的创新性在于其考虑了基于性别的教育水平,收入差异以及失业影响在多大程度上对男女性就业率以及其性别差异产生影响。男女就业竞争通常不会针对同一对象,但是研究发现较高的男性失业率会对女性就业率产生显著的、间接的正面影响。在城市地区性别就业差异随着女性受教育程度缩减,随着都市人口中受顾年龄构成比而加大。
Noback I., Broersma L. et van Dijk J. Les interactions géographiques propres au genre sur les marchés du travail régionaux aux Pays-Bas et l'écart du taux d'emploi entre les hommes et les femmes, Regional Studies. Cet article cherche à analyser le taux d'emploi propre au genre et l'écart du taux d'emploi entre les hommes et les femmes dans les municipalités néerlandaises en 2002. La nouveauté de cette analyse c'est que l'on tient compte de l'importance de l'éducation, du revenu et du chômage propre au genre quant à leur influence sur les taux d'emploi des hommes et des femmes. Souvent les hommes et les femmes ne sont pas à la recherche des mêmes emplois, plutôt il s'avère que le taux de chômage élevé des hommes a un impact positif important sur le taux de chômage des femmes. L'écart du taux d'emploi entre les hommes et les femmes se rétrécit avec la scolarisation des femmes et dans les zones urbaines, et se creuse en fonction de la structure de la population municipale par âge sujette aux soins de santé.
Noback I., Broersma L. und van Dijk J. Geschlechtsspezifische räumliche Wechselwirkungen auf den holländischen regionalen Arbeitsmärkten und die geschlechtsspezifische Diskrepanz in der Beschäftigungsquote, Regional Studies. In diesem Beitrag werden die geschlechtsspezifischen Beschäftigungsquoten sowie die geschlechtsspezifische Diskrepanz in der Beschäftigungsquote in holländischen Gemeinden im Jahr 2002 untersucht. Das Neue an dieser Analyse ist, dass berücksichtigt wird, in welchem Umfang sich die geschlechtsspezifischen Faktoren Bildung, Einkommen und Arbeitslosigkeit auf die Beschäftigungsquoten von Männern und Frauen sowie auf die geschlechtsspezifische Diskrepanz auswirken. Männer und Frauen konkurrieren oft nicht um dieselben Arbeitsplätze, doch stattdessen stellen wir fest, dass sich eine hohe männliche Arbeitslosigkeit in signifikanter Weise indirekt positiv auf die weiblichen Beschäftigungsquoten auswirkt. Die geschlechtsspezifische Diskrepanz in der Beschäftigungsquote verringert sich durch ein höheres Bildungsniveau der Frauen sowie in städtischen Gebieten; hingegen erhöht sie sich in Gemeinden aufgrund der Zusammensetzung der Bevölkerung in verstärkt pflegebedürftigem Alter.
Noback I., Broersma L. y van Dijk J. Interacciones espaciales por sexos en los mercados laborales regionales de Holanda y el desfase del empleo entre hombres y mujeres, Regional Studies. En este artículo analizamos las cuotas de empleo específicas por sexos y la disparidad de empleo entre mujeres y hombres en los municipios holandeses para 2002. La novedad de este análisis es que tenemos en cuenta la medida en que la educación, los ingresos y el desempleo por sexos influyen en las tasas de desempleo entre hombres y mujeres y en la brecha entre los géneros. Los hombres y las mujeres pocas veces compiten por los mismos puestos de trabajo, pero observamos que un alto nivel de desempleo masculino tiene un efecto indirectamente positivo y significativo en las tasas del empleo femenino. El desfase en el empleo por géneros se reduce con la educación de las mujeres y en áreas urbanas, y aumenta con la composición de la población municipal más mayor que necesita cuidados.
INTRODUCTION
The Dutch population, like those in many Western European countries, is rapidly aging. Increasing resource transfers to the elderly from a smaller working population base will form a serious challenge for the Dutch government (Carey, Citation2002). To maintain current welfare levels, participation needs to increase. The aim of this study is therefore to gain more insight into the factors that determine participation, particularly employment or net participation.
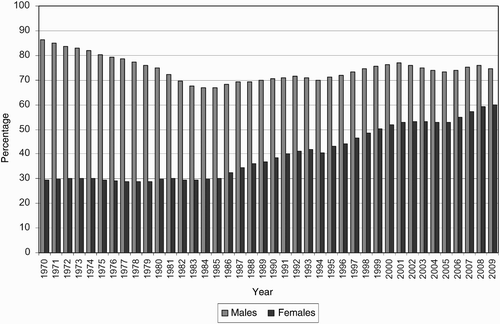
shows the development of the gender employment gap over the past four decades in the Netherlands. Throughout the 1970s until halfway into the 1980s, the female employment rate was more or less constant around 30%, while the male employment rate fell from almost 90% in 1970 to slightly below 70% in 1984. During this period the gender employment gap declined from roughly 60 to 40 percentage points. This was however entirely caused by a falling male employment rate. The female employment rate really started to take off from the second half of the 1980s onwards from 30% in 1985 to almost 60% in 2009. Compared with this, the male employment rate increased only gradually and is more cyclical in nature than female employment. During this period the gender employment gap closed further to roughly 15 percentage points in 2009, this time due to the rise in female employment.
Fig. 1 Gender employment gap – male and female employment rate (%) – in the Netherlands, 1970–2009
The increase in female participation during the past decades can be attributed to a combination of factors. On the supply side, women have become better educated, fertility has decreased and it is more accepted nowadays that women combine paid work with raising children (for example, De Graaf and Vermeulen, Citation1997; Organisation for Economic Co-operation and Development (OECD), 2002). Changes on the demand side of the labour market also contributed to the increase in female participation. Between 1960 and 2009 the female employed labour force more than tripled from slightly less than 1 million to almost 3.3 million female workers. The shift from a manufacturing to a service economy in that period and the tremendous increase in part-time jobs contributed to the possibility of combining paid work with raising children, without leaving the labour market. Henkens et al. Citation(2002) argue that the increase in female participation is almost completely due to the growth in the number of women working part-time. According to Statistics Netherlands, 20% of the employed women in 2002 worked in minor part-time jobs of fewer than 20 hours a week, while 47% of the employed women held part-time jobs between 20 and 35 hours a week.
Despite the increase in female employment, the gender employment gap still persists. Until now, the gender employment gap has mainly been studied at the national level, which does not take into account that labour markets function at a regional scale rather than at a national scale. The limited spatial range of spatial labour market behaviour is clearly illustrated by the fact that people are only willing to accept a limited daily commuting time (for example, van Ham, 2002; Turner and Niemeier, Citation1997). The literature also shows evidence of a gender commuting gap: women commute over shorter distances and times than men (Crane, Citation2007). According to Elhorst Citation(1996) the national labour market does not exist. Rather, employers and employees or job seekers are limited to a small set of overlapping regional labour markets due to psychological and geographical frictions (Elhorst, Citation1996, p. 210). Furthermore, it is well known that there are substantial regional differences in labour market performance. Therefore, the aim is to obtain more insight into the regional variation of gender-specific employment in the Netherlands and more specifically regional variation of the gender employment gap by adopting a spatial econometrics approach that allows one also to take into account interrelated labour markets of neighbouring regions.
Special attention will be paid to the interactions between male and female participation and unemployment. It might be that men and women compete for the same jobs, but it might also be that the labour market status (especially with regard to unemployment) of men exerts an additional worker or discouragement effect on women or vice versa. This will be explicitly tested for by including female unemployment rates and the distribution of jobs with regard to female-dominated sectors into the model that explains the employment rates of males, and vice versa. Insights into these cross-effects are especially relevant for active labour market policy aiming to stimulate the re-entrance of unemployed workers into employment and to stimulate a further increase in the employment rate, especially for women and men at older ages, which is an explicit goal of the Dutch labour policy.
The paper is organized as follows. The second section presents an overview of variables determining employment through a literature review. The third section provides a description of the data and the adopted methodology. The empirical results of the regression analysis are discussed in the fourth section; the fifth section presents a summary and conclusions.
DETERMINANTS OF EMPLOYMENT
This section presents a short overview of studies on labour force participation, especially those on regional labour markets and female participation. Because the authors are interested in the gender employment gap, gender-specific employment, or net participation rates, are used instead of gross participation rates, in which the unemployed are also included. The gender-specific employment rate (ER g , r ) is defined as:
According to Elhorst Citation(1996) the regional participation rate can be interpreted as the proportion of people who are willing to work at the current wage, controlling for a broad range of micro-oriented variables such as taxes and non-wage income, the cost of living, and socio-economic characteristics such as age, education and household situation. An explanatory model of regional participation can be obtained by aggregating the microeconomic framework of the labour force decision across individuals (Elhorst and Zeilstra, Citation2007). This method has been described for homogeneous groups by Pencavel Citation(1986) and was further developed by Elhorst and Zeilstra Citation(2007) to apply to heterogeneous groups. A common way of resolving problems with heterogeneity is to estimate models separately for men and women and to correct for composition effects of groups. An advantage of working with regional data is that these types of models take into account that individual labour decisions are influenced by regional indicators, which determine the spatial opportunity structure. Similarly van der Laan and van der Bout (Citation1990) argue that regional variation in female participation rates is influenced by the heterogeneity of potential participants in the labour market and by the regional (labour market) context.
Based on the results of the meta-analysis by Elhorst Citation(1996), the present paper adopts an eclectic approach and an empirical model including all commonly used explanatory variables is developed. The model includes both socio-economic indicators, for example, measures of population composition based on the microeconomic model and variables that describe the regional opportunity structure such as regional unemployment rates. The variables included in the empirical model are described in the following sections in more detail, including the theoretically expected outcomes.
Socio-economic characteristics
Studies explaining labour force participation through a micro-economic approach usually start with the human capital theory (van Ham and Büchel, 2006). Assuming that people strive for utility maximization, labour force participation can be explained in terms of time and income constraints. Based on the theory of consumer behaviour, leisure and work are weighed against each other, resulting in the decision to participate in the labour market for a certain amount of hours, given the wage that is offered (among others, see Groot and Pott-Buter, Citation1993; Cörvers and Golsteyn, Citation2003; Henkens et al., Citation2002). An increase in wages tends to have a positive effect on labour supply (van der Veen and Evers, Citation1984). People who are already employed will stay in the workforce and those who are not active on the labour market are stimulated to participate, which can be described as the ‘encouraged worker effect’. Only for wages that far exceed average wage levels will the labour supply curve be backwards bending. In view of the fact that the units of analysis are regions, only average wage levels will be considered, which implies that a backward-bending supply curve is not very likely. Higher wage levels are therefore expected to lead to higher employment rates.
Elaborating further on the human capital theory, higher education results in better access to high-productivity jobs and higher wages and consequently in higher opportunity costs of choosing not to work (among others, see OECD, Citation2002; Callens et al., Citation2000). Those who are higher educated are also likely to search more efficiently and successfully, and given the higher opportunity costs of not working they are likely to be more career oriented (among others, see Siegers and Zandanel, Citation1981). Furthermore, organizing individual arrangements for required supporting services such as domestic help and childcare is easier for high-income earners (Elhorst and Zeilstra, Citation2007; van der Laan and van der Bout, 1990; Siegers and Zandanel, Citation1981). In accordance with human capital theory and these empirical findings, it is expected that regions with a larger share of higher educated show higher male and female employment rates.
Another aspect of labour supply that is often included in studies of labour force participation is the age composition of the population. The age-specific employment pattern tends to follow an inverted ‘U’-shaped curve (Elder and Johnson, Citation1999; Fitzenberger et al., Citation2004). Young people participate less because they are still engaged in their studies, and older people participate less because they retire early, are more likely to become ill or disabled, or are unable to find a new job after having been laid off.
For women, their labour market participation is also influenced by the presence of children. According to Vlasblom and Schippers Citation(2004) Dutch women have a strong preference to take care of their own children and the birth of a first child can induce women to withdraw from the labour force. If women decide to withdraw from the labour force permanently, the age-specific employment pattern will take a unimodal shape. If withdrawal from the labour force is only temporary, during the child-rearing years the age-specific employment pattern will show a bimodal or ‘M’-shaped curve with a clear dip in participation between the ages of thirty and thirty-five years (Plantenga, Citation1997; Fitzenberger et al., Citation2004). Depending on the population composition of a region, age is expected to have a negative effect on employment when larger shares of the population are still engaged in education or are close to retirement. And higher female employment rates are expected when there is a larger proportion of women in the age group just beyond the typical reproduction period.
According to Moen and Yan Citation(2000) care-giving is not limited to taking care of children, but also refers to taking care of other dependent relatives. In a rapidly aging society where women provide the majority of care, the potential increase of, for instance, dependent parents can have a negative effect on the employment rate of women. Although men are undertaking more household chores and care-giving than in the past, women continue to do a greater share (Turner and Niemeier, Citation1997). These tasks influence female job opportunities because they take up time which consequently is no longer available for jobs that require long commuting hours (Pratt and Hanson, Citation1991). To take into account the effect of taking care of both children and dependent elderly persons, a demographic pressure variable is included in the model. Since women continue to do a greater share of care-giving, higher demographic pressure is expected to exert a negative effect, especially on female employment.
Regional opportunity structure
Several authors have argued that individual labour market decisions are influenced by regional characteristics (for example, Elhorst and Zeilstra, Citation2007; van der Laan and van der Bout, 1990). This section will discuss the effect of the opportunity structure of the regional labour market on employment. Van Ham and Büchel Citation(2006) found that poor regional labour market characteristics influence the probability of being employed as well as the willingness to work. The characteristics under discussion are unemployment, vacancies, sector composition, urbanization, accessibility to employment and the availability of childcare facilities.
High regional unemployment rates are an indication of poor access to local employment opportunities (van Ham and Büchel, 2006). Broersma and van Dijk (Citation2002) clearly show that in the Netherlands (like most European countries) labour adjustments due to changes in labour demand mainly take place via changes in the employment rates and not via migration of workers as is often the case in the United States. In general, a positive effect of unemployment is interpreted as an additional worker effect and a negative effect is interpreted as a discouraged worker effect (among others, see Euwals et al., Citation2007; Elhorst, Citation1996; van der Veen and Evers, 1984). An additional worker effect occurs when household income drops to a level that is too low as a result of long-term unemployment of the main wage earner (who is usually male). In this situation, the partner (usually female) accepts a job offer to maintain the household income at an acceptable level (Lundberg, Citation1985). A discouraged worker effect is defined as the decision to refrain from job search as a result of poor opportunities on the labour market (van Ham, 2002). High unemployment rates increase the competition for jobs and hence the search costs for suitable jobs. In this context job seekers might become discouraged and decide to stop their search effort. Especially women were found to be sensitive to the discouraged worker effect (van Ham, 2002). In view of the aim to gain more insight into the cross-effects of unemployment, both male and female unemployment are included in the empirical model. It is expected that high rates of male unemployment in a region exert a positive effect on the female employment levels as a result of the additional worker effect. Furthermore, high rates of female unemployment are expected to have a negative effect on female employment, that is, they constitute a discouragement effect. Similarly, high rates of male unemployment will negatively influence male employment in a region.
Where the unemployment rate reflects the supply side of the labour market, the vacancy rate gives an indication of the demand for labour in a region. When there are more vacancies per unemployed the likelihood of finding a job is higher. It is expected that a higher vacancy rate leads to higher regional employment shares for both men and women. Employment opportunities are also influenced by the sector composition of employment. Due to occupational segregation, these opportunities differ for men and women. Bowen and Finegan (Citation1969, p. 479) first introduced the sector composition of employment ‘designed to measure structural differences between metropolitan areas in the relative abundance of those jobs commonly held by females’. Regions with a relative abundance of jobs commonly held by women, that is, female-dominated sectors, such as healthcare and education where more part-time jobs are available and working hours are flexible, are expected to show higher female employment rates.
Another indicator of access to employment opportunities is urbanization. Highly urbanized areas tend to have favourable labour conditions simply because there are more jobs available, which means better opportunities of achieving a positive job match (van der Laan and van der Bout, 1990; De Meester et al., Citation2007). Moreover, large firm headquarters and government offices, which customarily employ a large number of women, are predominantly located in highly urbanized areas (Siegers and Zandanel, Citation1981). De Meester et al. Citation(2007) also mention the positive effect of supporting services in urban areas. Urbanization can also be viewed as a substitute for the degree of emancipation (van der Veen and Evers, 1984; van der Laan and van der Bout, 1990). De Meester et al. Citation(2007) found some evidence of the emergence of a ‘combination model’ in highly urban areas in the Netherlands, whereas the dominant model is the ‘one-and-a-half model’. In the ‘combination model’ highly educated women and equally or less educated partners divide both paid and unpaid tasks more equally. Similarly, Siegers and Zandanel Citation(1981) argue that societal opposition against female employment is probably lower in urban areas. Regardless of gender, regions with higher levels of urbanization are expected to show higher employment rates, particularly for females.
A higher travel-to-work commute duration in a region is an indication of the relative scarcity of suitable nearby jobs. A shorter commuting time then implies that more suitable jobs are available at a short distance. Women commute a shorter distance and time than men (Turner and Niemeier, Citation1997; Camstra, Citation1996; Pratt and Hanson, Citation1991). In 2003 Dutch men commute on average just over 20 kilometres and for women this is about 12 kilometres (Molnár, Citation2004). According to Camstra Citation(1996), women usually work fewer hours and earn less, which makes commuting relatively time-consuming and expensive. Furthermore, since women do a large share of the unpaid work, their time available for paid employment and travelling to and from work is far less than for men (Hanson and Pratt, Citation1990). However, Camstra Citation(1996) and Crane Citation(2007) also found evidence that the gender gap in commuting is converging. A negative relation between a higher average commuting duration and employment is expected and this influence is expected to be stronger for women because they are more sensitive to longer commuting times.
As described in the Introduction, during the 1970s and 1980s a large group of married women entered and remained in the labour force throughout their working lives, combining work with raising children. Still, women tend to do most of the housework including taking care of children. Therefore, access to childcare facilities is expected to be relevant for the employment opportunities of women (van Ham and Mulder, 2005). It is to be expected that regions with more childcare facilities available show higher female employment.
DATA AND METHODOLOGY
Data
The aim of this study is to obtain more insight into the regional variation in gender-specific employment rates and the gender employment gap. A person is considered employed when he or she works for at least 12 hours a week. Going by this criterion, it implies that part-time jobs covering 12–35 hours a week are included, while people who are looking for a job or temporarily recovering from an injury or illness are excluded.Footnote1 The gender employment gap is defined as the difference between the male and the female employment rates. In order to obtain a better understanding, a model for the ratio of the number of employed women vis-à-vis employed men, which is used to operationalize the gender employment gap, was also estimated.
Employment rates for 2002 were analysed at the spatial level of local area unitsFootnote2 or municipalities. The analysis focused on 2002 because data on the provision of childcare in municipalities were available only for that year. The ideal would have been to base the analysis on all 496 municipalities in 2002 and over a range of subsequent years. However, the required data are not consistently available for all municipalities and over a period of several years, in part due to the large number of explanatory variables included in the empirical model. Especially, data for education and childcare are not available for small, predominantly rural municipalities. For 2002, the male employment rate is available for 392 municipalities and data on the explanatory variables are available for 295 municipalities. The female employment rate for 2002 is available for 377 municipalities, and the explanatory variables are available for 298 municipalities.Footnote3 The empirical model of the male employment rate is therefore estimated for 295 municipalities and for the female employment rate for 298 municipalities, which accounts for 80% of the Dutch population. There is a slight bias in the models towards larger municipalities. Most of the excluded municipalities are near the eastern and southern borders. This means that possible disturbance posed by border regions with respect to the spatial dependence structure of the remaining municipalities will be relatively small. The models were also estimated without childcare and education, thus allowing the inclusion of all municipalities for which the employment rates are available. There were no significant changes in the results other than a smaller adjusted R Footnote2. Moreover, the spatial dependence structure did not change significantly.
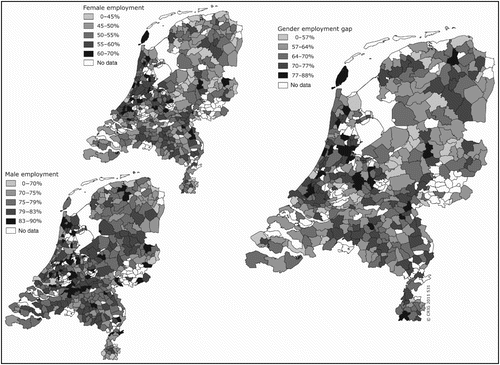
shows the regional variation of female and male employment rates and the gender employment gap at the municipality level. It is obvious that there is considerable spatial variation in participation rates as well as different patterns for males and females respectively. For men the employment rate ranges from 63% in the municipality of Groningen to 90% in Boskoop, with an average of 78%. For women the average is much lower at 52% and there is substantial regional variation, ranging from 34% in Laren to 70% in Ouder-Amstel. Municipalities with relatively high rates of employment are more or less located in the centre of the Netherlands, for both men and women. However, high and low rates between male and female employment often do not occur in the same municipalities; the correlation coefficient is only 0.24.Footnote4 The difference in employment shares between men and women, that is, the gender employment gap appears to be the smallest in municipalities around the larger cities. Heemstede has the smallest difference in participation: for every 100 men, there are eighty-eight women who work. In Laren the figure is only forty-five women. On average for the Netherlands as a whole for every 100 men who work, sixty-seven of their female counterparts do the same.
Fig. 2 Employment rates for Dutch municipalities, 2002
The considerable variation in employment rates, which becomes visible at a lower regional scale, strongly supports the relevance of smaller units of analysis, in this case municipalities. However, employment in a particular municipality could also be affected by neighbouring municipalities because of spillover and the possibility of commuting. Therefore, spatial dependence among municipalities will be considered.
The occurrence of spatial dependence can be tested by calculating Moran's I (Anselin et al., Citation2006). The value of Moran's I depends on a spatial weights matrix in which the supposed spatial dependence is specified. Since it is assumed that particularly the labour market situation of the adjacent municipalities exerts considerable influence, a queen's contiguity matrix is used for the analysis. A first-order queen contiguity is represented by a row-standardized weight matrix W, where w ij = 1 if municipalities share a common border or vertex; and zero elsewhere. Alternatives to first-order queen contiguity, including second-order contiguity and inverse distance, were considered. The results obtained with first-order contiguity proved the best fit, which can be explained by the fact that short-distance commuting is most common in the Netherlands.Footnote5
A spatial lag of the labour market can be calculated using this weights matrix, which means a weighted average of the employment rates of neighbouring municipalities. This weighted average or spatial lag is used to calculate Moran's I, which is defined as:
Operationalization of the explanatory variables
The majority of the data were obtained from Statistics Netherlands and supplemented by data on sectors derived from the LISA business register;Footnote6 unemployment and vacancy data were provided by the Centre for Work and Income (CWI); and data on the provision of childcare services came from Deloitte.Footnote7
For wage level, gender-specific average disposable income, namely income after tax deductions, for men and women aged fifteen years and older who received an income during the entire year, was used. The advantage of using disposable income above gross wage is that the latter does not reflect purchasing power correctly because taxes and social security contributions differ per household, income and industry.
Education is measured as the gender-specific proportion of those who are less educated in the total population. Lower education refers to completed primary education and a lower level of secondary education. Ideally it would have been preferable to include data for the proportion of the higher educated in a municipality, but due to the smaller number, data for the higher educated are only available for a considerably limited number of municipalities because of the confidentiality regulations of Statistics Netherlands.
Age for men is measured as the proportion of men close to retirement, aged between fifty and sixty years. Age for women is measured as the proportion of women beyond the typical reproduction period, aged between forty and fifty years. To take into account the effect of providing care for children and others, such as the elderly, the dependency ratio also was included. It is measured as:
The authors also distinguished between the so-called ‘green’ (of those below twenty years) and ‘grey’ (those above sixty-five years) pressure. However, a test on the equality of the estimated coefficients of both effects could not be accepted at any reasonable significance level. That is why the overall demographic pressure was continued.
To measure regional labour market conditions, regional unemployment rate, Bowen and Finegan's (1969) industry mix and the vacancy–unemployment (VU) ratio were included in the empirical model. Since male unemployment and female labour market behaviour may theoretically affect each other crosswise through additional and discouraged worker effects, gender-specific unemployment rates are included in the model. The percentage of unemployed men or women is measured as the share of unemployed in the gender-specific labour force. The employment data are measured by place of residence.
The industry mix indicator formulated by Bowen and Finegan (1969) measures the extent to which the regional sector structure, that is, industrial composition, is favourable for women in terms of the availability of jobs. The indicator predicts the expected share of female jobs in a region based on the regional industry mix combined with the national ratio of males and females in each sector.Footnote8 Following Elhorst Citation(2008), the predicted ratio of female employment to total employment is measured as:
The VU ratio has the drawback that not all vacancies are reported and many vacancies are filled without any public announcement. Nevertheless, this drawback can be partly circumvented by adding the rate of urbanization, measured as the average address density of a region. As discussed above, urbanization can be seen as an indicator of job opportunities within a municipality. Other regional variables included in the empirical model are childcare facilities and commuting. The provision of childcare is measured by the availability of daycare facilities for children aged between zero and twelve years, that is, the number of daycare slots and after-school-care facilities multiplied by 1.7Footnote[9] over the number of children aged between zero and twelve years in a municipality. Commuting duration is measured as the average commute-to-work duration, that is, the average time people commute to and from work.
provides an overview of the descriptive statistics of the variables included in the analysis. For an overview of the definitions of the variables and the data sources, see Appendix A.
Table 1. Descriptive statistics
Model specification and spatial dependence
Moran's I is first calculated and it suggests spatial dependence only for the female, not for the male, employment rate. In the specification analysis of the empirical model, this possible spatial dependence is taken into account by testing what kind of spatial structure will best fit the data.Footnote10 It is tested whether the specification can be represented either by a spatial autoregressive (SAR) lag structure:
In these specifications, y is the dependent variable (gender-specific employment rate); X is the vector of explanatory variables, comprising the socio-economic and regional opportunity variables defined above; and ϵ represents the error process. In addition:
Note that the spatial lag structure of equations (1) and (2) is related since the SAR structure in equation Equation(1) can be rewritten as an SMA model with an infinite lag. Conversely, the SMA specification in equation (2) can be rewritten in an infinitely lagged SAR specification. The same holds for the combination of both in a spatial autoregressive moving average (SARMA) model, which is why this latter specification will not be explored further. It is tested whether model specification Equation(1)
or (2) best fits the data concerning the female employment rate and the male employment rate, respectively. The next section will consider the implications for the gender gap model.
RESULTS
Given the numbers of observation, the number of spatial lags in equations (1) and (2) is set equal to 1, that is, j = 1. In testing for the spatial structure in the models of the male and female employment rate shown in , the presence of a spatial error structure with a single lag cannot be rejected for the female employment rate. For the male employment rate, on the other hand, no significant spatial structure could be identified. The gender employment gap, defined as the ratio between the male and female employment rates, follows the same spatial structure as for the female employment rate, which is confirmed by the usual Lagrange multiplier (LM) tests.
Table 2. Estimation results for models of female and male employment rates and the gender employment gap in Dutch municipalities, 2002
Hence, specification (2) is chosen to conduct the analysis for female employment, while for male employment no specific spatial structure will be imposed on the model. The estimation results shown in for female employment and the gender employment gap indeed show a positive significant effect of λ. The definition of the gender employment gap implies that an obvious adaptation would be to specify the gender gap model also in terms of the ratio of the gender-specific variables, that is, income, education and unemployment. Testing whether this improves the model revealed that only the ratios of female to male education and unemployment rates improved the gender gap model as explanatory variables.Footnote11 Female and male income are included separately.
The adjusted R Footnote2 from the ordinary least squares (OLS) regressions shows the lowest explained variance for men (0.38), a substantially higher share for women (0.49), and the best fit for the ratio (0.53). Therefore, it can be concluded that this model is adequate for explaining a large part of the variation in employment by gender as well as the gender employment gap.Footnote12 The paper will now proceed with a discussion of the results according to the different characteristics distinguished for the explanatory variables.
Socio-economic characteristics
It is found that only female disposable income has a significant positive effect on the female employment rate and the gender employment gap. Male disposable income has no significant effect. Hence, municipalities with higher levels of female disposable income show a narrower gender employment gap. These results could indicate that for women the substitution effect is larger than the income effect, whereas for men income and substitution effects compensate each other.
Municipalities with a relatively larger share of lower educated women have lower female employment. This is in accordance with the classical human capital theories where higher education has a positive influence on labour market participation. Higher educated women are more career oriented and have better access to the labour market than lower educated women. For the gender employment gap it is found that municipalities with a high ratio of lower educated females to lower educated males have a wider gender employment gap than vice versa. This is also in line with human capital theory.
As expected, a positive significant relation was found between the proportion of women aged forty to fifty years and female employment and a negative significant relation between the proportion of men aged fifty to sixty years and male employment. The effect of a higher proportion of women aged forty to fifty years on the ratio of female to male employment is also positively significant. This means municipalities with a larger share of women in the age group forty to fifty years, an age group just beyond the typical reproduction period, have higher levels of female employment, also resulting in a smaller gender employment gap. As discussed in the second section, the age-specific employment pattern of Dutch women resembles an ‘M’-shaped curve. The results support the second rise in the employment curve that takes place after the dip during child-raising ages. This follows from the fact that taking care of children becomes less time-consuming as they grow older, which enables women to return to the labour market. For men it is found that in municipalities with a larger share of men in the age group fifty to sixty years the male net participation is lower. Men close to their retirement age more often retire early, which negatively affects the male employment rate.
Related to age and family formation a significant negative relation between demographic pressure and female employment was found. Municipalities with a larger share of children and elderly, that is, a higher demographic pressure, show lower female employment rates. Demographic pressure exerts no significant effect on male employment and a negative significant effect on the gender employment gap. A high share of children or elderly people widens the gender employment gap. In line with previous studies, these results show that female employment levels continue to be affected by the burden of taking care of children and additionally by taking care of elderly.
Regional opportunity structure
The relation between net participation and unemployment appears to be highly complex. Encouragement, discouragement and competition play a role, and men and women are influenced differently. Results indicate that municipalities with higher shares of male unemployment show lower male employment rates. The female unemployment rate also has a negative significant effect on the female employment rate. This negative significant relation can be interpreted as the theoretical notion of the discouraged worker effect, that is, refraining from a job search due to perceived poor opportunities on the labour market.
It was also found that cross-effects are important: high male unemployment has a significant positive effect on the female employment rate and the same holds for the effect between female unemployment and male employment rates. This can be interpreted as the theoretical notion of the additional worker effect: if more men are out of a job, then their partners, most likely women, will start working, and vice versa. The results show that these effects can also be identified at the aggregated level of municipalities. Concerning the gender employment gap, a negative effect of the ratio of female to male unemployment is found. Hence, a higher female to male unemployment ratio discourages women to work, thereby widening the gap, and vice versa.
A positive significant relation was found between urbanization and female employment and the gender employment gap. Hence, the gender employment gap is smaller in urban areas. There is no significant relation between male employment and urbanization.
A favourable industry mix for females appears to have no significant effect on either female employment or the gender gap. It appears to have a slightly negative effect only on the male employment rate. Therefore instead of females benefitting from a favourable structure, it appears that males are disadvantaged by such a structure.
There were no significant effects of the VU ratio, childcare and commuting in either of the models. A possible explanation for the lack of an effect of childcare on female employment rates might be the limited scale of childcare provision in the Netherlands. Te Riele Citation(2006) shows that fewer than 20% of the households with children younger than twelve years resort to formal childcare. An alternative explanation might be the location of childcare facilities. Before the Childcare Act of 2005, childcare facilities were subsidized by municipalities with a preference for non-profit organizations, commonly found in smaller municipalities (Noailly et al., Citation2007). Since the level of use is usually lower in these smaller municipalities, added stimulus to use childcare facilities apparently has not yet resulted in a significant increase in participation rates. A final explanation is the fact that particularly lower educated women benefit from an increase in these facilities. Higher educated women with young children will keep working or search for work in any case. These high-income female workers can afford to pay for childcare, thereby mitigating the possible participation-enhancing effect of childcare facilities for all female workers. Since municipal data on female employment by level of education are not available, this assumption cannot be tested.
The possible lack of a commuting effect may be related to the fact that data on gender-specific commuting duration are not available.
Spatial dependence
Last but not least, an attempt is made to provide an explanation for the spatial error term λ. This parameter indicates that there is an unobserved effect of neighbouring municipalities on the municipal gender employment gap. One way to identify this effect is to add a spatial lag to the explanatory variables of the model and to test whether any of the variables in neighbouring municipalities exert influence on a particular municipality's own gender employment gap. Several specifications were experimented with, but in no case did was a significant effect of surrounding municipalities found. Another way to identify this effect is to make use of the fact that an SMA model with one lagged error term can be rewritten as an SAR model with, in theory, infinite spatial lags. Estimating an SAREquation(1) specification instead of the SMAEquation(2)
specification of also gave no further insight into the presence of spatial spillover effects.
SUMMARY AND CONCLUSIONS
Since the early 1980s, the Netherlands has experienced a sharp increase in female labour market participation. This rise led to an additional boost to narrowing the gender employment gap. However, this gap has not yet closed; the levels of net as well as gross participation continue to be lower for women. This is not just a Dutch phenomenon; it also occurs in many other European countries, such as the United Kingdom, Denmark and Germany. In the international literature little attention has been given to the gender aspect of regional variation in participation rates at the level of municipalities. Given the rapidly aging population, the aim of this research was to provide more insight into the determining factors of regional differences in employment between men, women and specifically the gender employment gap by performing an analysis of gender-specific employment rates at the municipality level for 2002.
From a visual inspection of maps depicting the employment rates at the municipal level it is clear that there is considerable spatial variation and that this pattern differs for men and women. Variation in the gender employment gap provided yet another pattern: regions with low male employment do not necessarily have low female employment. To explain the gender-specific regional variation in employment rates a combination of explanatory variables consisting of socio-economic characteristics and the regional opportunity structure were included in a spatial econometric model of the municipal gender employment gap. The results indicated that the model is capable of explaining a significant part of the variation in net labour market participation. The results also indicated that complex processes of crosswise effects between men and women occur.
Some of the results were as expected; a smaller gender employment gap in urban areas was found, and in line with human capital theory, municipalities with a high ratio of low-educated females to low-educated males exhibit a wider gender employment gap. Other results were however quite unexpected. A positive but insignificant effect of the industry mix, the VU ratio and commute duration on the gender employment gap was found. Furthermore, the provision of childcare facilities made no significant contribution to closing the gender employment gap. The use of formal childcare is low and the provision of childcare is not demand driven but subsidized by municipalities with a preference for non-profit organizations located in smaller municipalities. Since the implementation of the Childcare Act of 2005 there have been some major changes with regard to the provision of childcare. Therefore, further research is needed with new data, preferably for several consecutive years, to explore the relation and causality between the provision of childcare and female employment rates. Finally, strong cross-effects of gender-specific unemployment on female and male employment rates were found. Men and women do not compete for the same jobs but rather higher levels of male unemployment have a positive significant effect on female employment, suggesting encouragement, and higher levels of female unemployment have a negative significant effect suggesting discouragement. A higher female to male unemployment ratio has a negative significant effect on the gender employment gap implying a widening of the gap. This results from a combination of the negative effect of larger shares of female unemployment on female employment and the positive effect on male employment.
Furthermore, one has to consider the direction of causality; households might choose to live in a region with low employment levels because one of the partners does not want to work. Given the cross-sectional design of this study, this issue cannot be addressed in more detail in the present analysis. In order to understand these processes fully more research is needed using panel data for several consecutive years. A multilevel analysis that combines regional data with individual data can provide more insight into the interaction between micro-behaviour and macro-variables at the regional level. It will however be quite difficult to gather municipal data for a range of years that contain the necessary amount of detail.
Acknowledgements
This paper is part of a larger research project entitled ‘Regional Labour Market Dynamics and the Gender Employment Gap’ funded by Grant Number 400-03-473 of the Netherlands Organisation for Scientific Research (NWO). The authors would like to thank the Editors and two anonymous reviewers for their comments which greatly improved this paper.
Notes
In this respect, the Dutch definition of the labour force as comprising employed persons with a job of at least 12 hours a week and persons searching actively for a job is followed. The common international definition does not include a restriction on the number of hours, but it considers all jobs regardless of weekly hours. The main reason for the hours' restriction is the fact that persons who work at least 12 hours a week in general regard employment as their main activity, whereas persons with smaller jobs usually have other main activities. Hence, this definition is closer to the concept of labour market participation.
The basic components of the Nomenclature des Unités Territoriales Statistiques (NUTS) regions consist of local administrative units (LAU). LAU 1 is former NUTS level 4 and LAU 2, used to indicate municipalities, is former NUTS level 5.
These different numbers are related to the fact that the Labour Force Survey, which lies at the heart of this analysis, is a relatively small survey where information in densely populated areas will compromise the confidentiality and reliability of these results. The maximum number of observation has been chosen so that male and female employment rate models can be specified.
The bivariate correlation matrix is available from the authors upon request.
According to Statistics Netherlands, in 2002 men on average commuted 20 kilometres to work, and women 12 kilometres.
For more information about the LISA data, see http://www.lisa.nl/.
Childcare data were collected by Deloitte on behalf of the Ministry of Social Affairs.
In this study jobs are concentrated in six sectors, which are all included in the industry mix: agriculture, manufacturing, finance business and other services, distributive services and hotels, healthcare, and public administration and education.
One slot consists of ten units (five days per week multiplied by two segments: morning and afternoon) and is on average occupied by 1.7 children. This is based on oral information provided by Deloitte.
The specification analysis is conducted with the statistical package GeoDa (Anselin et al., Citation2006).
Comparing the Schwarz selection criterion of a model with no ratio (SC = –818) with a model with all three variables taken as ratios (SC = –808) is not an improvement, while a model with only ratios of female to male education and unemployment (SC = –824) is an improvement.
According to Anselin and Bera Citation(1998), R Footnote2 is not suitable to measure the fit of the model because unlike the log-likelihood it does not take the spatial autocorrelation of the residuals into account. Since the results of the OLS estimations do not differ substantially from the results of the spatial error estimations, it can be argued that the model provides a good explanation of the variation in participation.
REFERENCES
- Anselin , L. and Bera , A. K. 1998 . “ Spatial dependence in linear regression models with an introduction to spatial econometrics ” . In Handbook of Applied Economic Statistics , Edited by: Ullah , A. and Giles , D. 237 – 289 . New York , NY : Dekker .
- Anselin , L. , Syabri , I. and Kho , Y. 2006 . GeoDa, an introduction to spatial data analysis . Geographical Analysis , 38 : 5 – 22 . (doi:10.1111/j.0016-7363.2005.00671.x)
- Bowen , W. G. and Finegan , T. A. 1969 . The Economics of Labor Force Participation , Princeton , NJ : Princeton University Press .
- Broersma , L. and van Dijk , J. 2002 . Regional labour market dynamics in the Netherlands . Papers in Regional Science , 81 ( 3 ) : 343 – 364 . (doi:10.1007/s101100200126)
- Callens , M. , van Hoorn , W. and de Jong , A. 2000 . Labour force participation of mothers, in de Beer J. and Deven F. (Eds) Diversity in Family Formation: The 2nd Demographic Transition in Belgium and the Netherlands, pp. 89–114
- Camstra , R. 1996 . Commuting and gender in a lifestyle perspective . Urban Studies , 33 ( 2 ) : 283 – 300 . (doi:10.1080/00420989650012013)
- Carey , D. 2002 . Coping with Population Aging in the Netherlands OECD Economic Department Working Papers Number 325. Organisation for Economic Co-operation and Development (OECD), Paris
- Cörvers , F. and Golsteyn , B. 2003 . Changes in Women's Willingness to Work in a Tightening Labour Market: The Impact of Preferences, Wages and Individual Characteristics Research Memorandum Number 2003/5E. Research Centre for Education and the Labour Market (ROA), Faculty of Economics and Business, Administration, Maastricht University, Maastricht
- Crane , R. 2007 . Is there a quiet revolution in women's travel? Revisiting the gender gap in commuting . Journal of the American Planning Association , 73 ( 3 ) : 298 – 316 . (doi:10.1080/01944360708977979)
- De Graaf , P. and Vermeulen , H. 1997 . “ Female labour market participation in the Netherlands: developments in the relationship between family cycle and employment ” . In Between Equalization and Marginalization: Women Working Part-time in Europe and the United States of America , Edited by: Blossfeld , H. P. and Hakim , C. 191 – 209 . Oxford : Oxford University Press .
- De Meester , E. , Mulder , C. H. and Droogleever Fortuijn , J. 2007 . Time spent in paid work by women and men in urban and less urban contexts in the Netherlands . Journal of Economic and Social Geography , 98 ( 5 ) : 585 – 602 .
- Elder , S. and Johnson , L. J. 1999 . Sex-specific labour market indicators: what they show . International Labour Review , 138 ( 4 ) : 447 – 464 . (doi:10.1111/j.1564-913X.1999.tb00397.x)
- Elhorst , J. P. 1996 . Regional labour market research on participation rates . Journal of Economic and Social Geography , 87 ( 3 ) : 209 – 221 .
- Elhorst , J. P. 2008 . A spatiotemporal analysis of aggregate labour force behaviour by sex and age across the European Union . Journal of Geographical Systems , 10 : 167 – 190 . (doi:10.1007/s10109-008-0061-9)
- Elhorst , J. P. and Zeilstra , A. S. 2007 . Labour force participation rates at the regional and national levels of the European Union: an integrated analysis . Papers in Regional Science , 86 ( 4 ) : 525 – 549 . (doi:10.1111/j.1435-5957.2007.00136.x)
- Euwals , R. , Knoef , M. and van Vuuren , D. 2007 . The Trend in Female Labour Force Participation: What Can be Expected for the Future? , Discussion Paper Number 3225. Forschungsinstitut zur Zukunft der Arbeit (IZA), Bonn
- Fitzenberger , B. , Schnabel , R. and Wunderlich , G. 2004 . The gender gap in labor market participation and employment: a cohort analysis for West Germany . Journal of population economics , 17 ( 1 ) : 83 – 116 . (doi:10.1007/s00148-003-0141-6)
- Groot , W. and Pott-Buter , H. 1993 . Why women's labour supply in the Netherlands has increased . De economist , 141 ( 2 ) : 238 – 255 . (doi:10.1007/BF01717382)
- Hanson , S. and Pratt , G. 1990 . Geographic perspectives on the occupational segregation of women . National Geographic Review , 6 ( 4 ) : 376 – 399 .
- Henkens , K. , Grift , Y. and Siegers , J. 2002 . Changes in female labour supply in the Netherlands 1989–1998: the case of married and cohabiting women . European Journal of Population , 18 : 39 – 57 . (doi:10.1023/A:1013868021024)
- Lundberg , S. 1985 . The added worker effect . Journal of Labor Economics , 3 ( 1 ) : 11 – 37 . (doi:10.1086/298069)
- Moen , P. and Yan , Y. 2000 . Effective work/life strategies: working couples, work conditions, gender, and life quality . Social Problems , 47 ( 3 ) : 291 – 326 . (doi:10.2307/3097233)
- Molnár , H. 2004 . Woon-werkverkeer . Sociaal-economische trends , 4e kwartaal, 47–50
- Noailly , J. , Visser , S. and Grout , P. 2007 . The Impact of Market Forces on the Provision of Childcare: Insights from the 2005 Childcare Act in the Netherlands Memorandum Netherlands Bureau for Economic Policy Analysis (CPB), The Hague
- Organisation for Economic Co-operation and Development (OECD) . 2002 . Women at work: who are they and how are they faring? . OECD Employment Outlook , : 63 – 125 .
- Pencavel , J. 1986 . “ Labor supply of men: a survey ” . In Handbook of Labor Economics , Edited by: Ashenfelter , O. and Layard , R. 3 – 102 . Amsterdam : Elsevier .
- Plantenga , J. 1997 . “ European constants and national particularities: the position of women in the EU labour market ” . In Gender and Economics: A European Perspective , Edited by: Dijkstra , A. G. and Plantenga , J. 86 – 103 . London : Routledge .
- Pratt , G. and Hanson , S. 1991 . Time, space, and the occupational segregation of women: a critique of Human Capital theory . Geoforum , 22 ( 2 ) : 124 – 157 . (doi:10.1016/0016-7185(91)90004-A)
- Siegers , J. J. and Zandanel , R. 1981 . A simultaneous analysis of the labour force participation of married women and the presence of young children in the family . De economist , 129 ( 3 ) : 382 – 393 . (doi:10.1007/BF01371748)
- Statistics Netherlands . 2010 . CBS Statline. Statistics on the Gender-specific Employment Rates (available at: http://statline.cbs.nl)
- Te Riele , S. 2006 . Gebruik van kinderopvang . Sociaal-economische trends (CBS) , Online Document: Quarterly of Statistics Netherlands (available at: http://www.cbs.nl.NR/rdonlyres/748D182E-D246-4433-8BA6-674D21721534/0/2006k3v4pub.pdf)
- Turner , T. and Niemeier , D. 1997 . Travel to work and household responsibility: new evidence . Transportation , 24 ( 4 ) : 397 – 419 . (doi:10.1023/A:1004945903696)
- Van der Laan , L. and van der Bout , E. R. 1990 . Een Economisch-geografische Analyse van de Regionale Verschillen in de Participatie van Vrouwen op de Arbeidsmarkt in Nederland Economisch Geografisch Instituut, Erasmus Universiteit, Rotterdam
- Van der Veen , A. and Evers , G. H. M. 1984 . A labour-supply function for females in the Netherlands . De economist , 132 ( 3 ) : 367 – 376 . (doi:10.1007/BF02380336)
- Van Ham , M. 2002 . Job Access, Workplace Mobility, and Occupational Achievement , Delft : Eburon .
- Van Ham , M. and Büchel , F. 2006 . Unwilling or unable? Spatial and socio-economic restrictions on females' labour market access . Regional Studies , 40 ( 3 ) : 345 – 357 . (doi:10.1080/00343400600632663)
- Van Ham , M. and Mulder , C. 2005 . Geographical access to childcare and mother's labour-force participation . Journal of Economic and Social Geography , 96 ( 1 ) : 63 – 74 .
- Vlasblom , J. D. and Schippers , J. J. 2004 . Increases in female labour force participation in Europe: similarities and differences . European Journal of Population , 20 ( 4 ) : 375 – 392 . (doi:10.1007/s10680-004-5302-0)