
Abstract
Essletzbichler J. Relatedness, industrial branching and technological cohesion in US metropolitan areas, Regional Studies. Work by evolutionary economic geographers on the role of industry relatedness for regional economic development is extended into a number of methodological and empirical directions. First, relatedness is measured as the intensity of input–output linkages between industries. Second, this measure is employed to examine industry evolution in 360 US metropolitan areas. Third, an employment-weighted measure of metropolitan technological cohesion is developed. The results confirm that technological relatedness is positively related to metropolitan industry portfolio membership and industry entry and negatively related to industry exit. The decomposition of technological cohesion indicates that the selection of related incumbent industries complements industry entry and exit as the main drivers of change in metropolitan technological cohesion.
Essletzbichler J. 美国大都会地区中的关联性、产业扩展分支与技术整合,区域研究。演化经济地理学者对产业关联性之于区域经济发展的角色之研究,延伸至下列数个方法与经验面向。首先,关联性以产业间的投入—产出连结密集度量测之。再者,此一方法被用来检视美国三百六十个大都会地区的产业发展。第三则建立一个大都会地区技术整合的就业加权测量法。研究结果证实,技术关联性与大都会产业组合关係及产业进入呈现正相关,与产业退出则为负相关。解构技术整合,指出与当前在位产业有关的选择,与产业进入及退出相互补充,做为大都会技术整合变革的主要驱力。
Essletzbichler J. La parenté, la ramification industrielle et la cohésion technologique dans les zones métropolitaines aux États-Unis, Regional Studies. Le travail des géographes économiques évolutionnaires sur le rôle de la parenté industrielle ayant égard pour le développement économique régional s'étend à un nombre d'orientations méthodologiques et empiriques. Primo, on mesure la parenté comme l'intensité des échanges inter-industriels. Secundo, on emploie cette mesure afin d'examiner l'évolution de l'industrie dans 360 zones métropolitaines aux États-Unis. Tertio, on développe une mesure de la cohésion technologique métropolitaine pesée en termes d'emploi. Les résultats confirment que la parenté technologique est en corrélation positive avec l'adhésion au portefeuille industrielle métropolitaine et l'entrée de l'industrie, et en corrélation négative avec la sortie de l'industrie. La décomposition de la cohésion technologique indique que le choix d'industries connexes en place complète l'entrée et la sortie de l'industrie comme forces motrices du changement à la cohésion technologique métropolitaine.
Essletzbichler J. Verwandtschaft, Branchenbildung und technische Kohäsion in Metropolitangebieten der USA, Regional Studies. In diesem Beitrag wird die Arbeit von evolutionären Wirtschaftsgeografen über die Rolle der Branchenverwandtschaft für die regionale Wirtschaftsentwicklung in verschiedene methodologische und empirische Richtungen erweitert. Erstens wird Verwandtschaft als Intensität von Input-Output-Verknüpfungen zwischen Branchen gemessen. Zweitens wird dieser Maßstab zur Untersuchung der Branchenevolution in 360 Metropolitangebieten der USA verwendet. Drittens wird ein nach Beschäftigungsniveau gewichteter Maßstab der metropolitanen technischen Kohäsion entwickelt. Die Ergebnisse bestätigen, dass die technische Verwandtschaft in einem positiven Zusammenhang mit der Mitgliedschaft im metropolitanen Branchenportfolio und mit dem Branchenzugang sowie in einem negativen Zusammenhang mit Branchenaustritten steht. Aus der Zusammensetzung der technischen Kohäsion geht hervor, dass die Auswahl der verwandten etablierten Branchen den Branchenzugang und die Branchenaustritte als wichtigste Faktoren der Veränderung bei der metropolitanen technischen Kohäsion ergänzt.
Essletzbichler J. Relación, ramas industriales y cohesión tecnológica en las áreas metropolitanas de EE.UU., Regional Studies. En este estudio el trabajo de geógrafos económicos evolutivos sobre el papel de las relaciones de la industria para el desarrollo económico se extiende a una serie de direcciones metodológicas y empíricas. Primero se mide la relación en cuanto a la intensidad de los vínculos de entrada/salida entre las industrias. Segundo, se emplea esta medida para analizar la evolución de la industria en 360 áreas metropolitanas de Estados Unidos. Tercero, se desarrolla una medida ponderada según el empleo de la cohesión tecnológica metropolitana. Los resultados confirman que la relación tecnológica está positivamente vinculada a la representación en la cartera industrial metropolitana y la entrada industrial, y negativamente vinculada a la salida industrial. La descomposición de la cohesión tecnológica indica que la selección de las industrias establecidas relacionadas complementa la entrada y salida en las industrias como los principales impulsores de cambio en la cohesión tecnológica metropolitana.
INTRODUCTION
Regions evolve through a process of creative destruction of technological and industrial variety (Schumpeter, Citation1939; Storper and Walker, Citation1989; Essletzbichler and Rigby, Citation2005; Rigby and Essletzbichler, Citation2006; Neffke et al., Citation2011b) mirroring rapid churning at the plant level (Davis et al., Citation1996; Baldwin, Citation1998, Foster et al., Citation1998). Creative destruction reflects an imperfect trial-and-error process where firms enter markets with the hope of selling products at a profit. Evidence for the US manufacturing sector indicates that between 1963 and 1982, 39.8% of manufacturing firms registered in a particular census year were not yet active five years earlier. Those high entry rates were matched by slightly lower exit rates varying between 30.8% and 39.0% (Dunne et al., Citation1988). Underpinning long-term structural change, the high rates of churning at the national level are also observed at the state and metropolitan area levels (Rigby and Essletzbichler, Citation2000; Essletzbichler and Rigby, Citation2002; Essletzbichler Citation2004). While some regions are able to harness the process to rejuvenate their industrial base, others fail to diversify and become locked into a process of industrial decline (Grabher, Citation1993; Hassink and Shin, Citation2005; Martin, Citation2010).
Martin and Sunley Citation(2006) discuss a number of ways for regions to create new paths of development, including processes of recombinant innovation (Frenken et al., Citation2012) based on existing industrial or technological diversity, investment and technology transfer from outside the region (Bathelt et al., Citation2004) and technological change and endogenous transformation of firms in the region (Tödtling and Trippl, Citation2004). How regions grow and decline is also a key research question in new geographical economics. Debates in economics have centred on the relative importance of urbanization and localization economies to generate regional and urban economic growth. The importance of urban diversity to generate novel ideas and knowledge through spillovers among different rather than similar industries leading to urban economic growth was advocated by Jane Jacobs (Jacobs, Citation1969), but has since been examined empirically by economists (Glaeser et al., Citation1992; Henderson et al., Citation1995; Duranton and Puga, Citation2001; Rosenthal and Strange, Citation2004) complementing their work on the impact of localization economies and urban size. Numerous empirical studies on the importance of diversity versus specialization as drivers of regional and urban economic growth produced inconclusive evidence at best (Beaudry and Schiffauerova, Citation2009; De Groot et al., Citation2009). Perhaps one reason for this inconclusive evidence is the treatment of industries as quantitatively distinct but qualitatively similar. Localization economies enter empirical models as absolute or relative concentration of employment in any industry ignoring the (dis)similarity of those industries. Similarly, urbanization economies are approximated through urban size, population density or the number of plants with little regard for the relationship among sectors making up those regions.
One of the recent contributions of the work by evolutionary economic geographers is the importance attributed to the concept of relatedness between industries highlighting the need to consider not only the number and employment shares of regional industries, but also the similarity among them to understand regional economic evolution. While sectoral diversity may increase the potential for radical innovations because of the exchange of different ideas, too much dissimilarity between sectors may impede knowledge exchange because some overlap in knowledge bases and competences is required to communicate effectively. Nooteboom Citation(2000) thus postulates a trade-off between diversity and similarity: too much similarity may result in cognitive lock-in while too little similarity may impede knowledge exchange altogether. The notion of cognitive distance points towards the idea of relatedness between sectors and forces researchers to capture the technological similarity between sectors empirically rather than simply tallying the number of sectors or employment shares in sectors.
Industries are related through different channels of information and knowledge exchange: labour flows, supplier–customer relationships and knowledge ‘spillovers’ (Marshall, 1920; Potter and Watts, Citation2012). Geographic proximity is assumed to facilitate this exchange. Cities with local pools of skilled labour are more likely to boost firm performance (Boschma et al., Citation2009) and regional economic growth. As firms are more likely to diversify into industries requiring similar skill sets to take full advantage of their workforce (Neffke and Henning, Citation2013) and workers are more likely to exchange information if they possess related skills, cities are likely to add industries employing workers with related skill sets. The second channel of knowledge exchange is through supplier–customer linkages as the presence of competent suppliers increases the productivity of their customers, while the presence of competent customers pushes up competition and innovation among suppliers. Thus, regions are likely to branch into related industries as those industries can take advantage of the local supplier and customer base (Frenken and Boschma, Citation2007). And finally, technology spillovers may be more likely to occur between technologically related industries, rather than within a single industry or between technologically unrelated industries (Boschma and Frenken, Citation2011).
In order to examine the impact of relatedness on regional performance, Frenken et al. Citation(2007) distinguish between ‘related’ and ‘unrelated’ variety and link variety to regional employment, output and productivity growth. Employing an entropy measure of industry concentration, ‘related variety’ refers to the concentration of employment in SIC-5-digit sectors within SIC-2-digit sectors and ‘unrelated variety’ refers to the concentration of employment in SIC-2-digit sectors.Footnote1 Their findings indicate that for Dutch regions ‘related variety’ is positively related to employment growth, while ‘unrelated variety’ is negatively related to unemployment growth suggesting the operation of a portfolio effect. Boschma and Iammarino Citation(2009) found similar results for Italian regions. Building on entropy-based measures of variety, Boschma et al. Citation(2009) show the importance of related skill portfolios of a plant's workforce for its productivity growth in Sweden; Quatraro Citation(2010) demonstrates that related but not unrelated variety exerts a positive impact of total factor productivity (TFP) growth in Italian regions; and Boschma et al. Citation(2012) find positive effects on value added and employment growth in Spanish regions. Hartog et al. Citation(2012) find that the positive effect of related variety on employment growth in Finnish regions is restricted to high-technology sectors only.
Subsequent work developed relatedness measures based on co-occurrences of country exports (Hidalgo et al., Citation2007), co-production of products in plants (Neffke and Henning, Citation2008), and co-citation of patents in patent applications (Rigby, 2012). Hausmann and Klinger Citation(2007) and Hidalgo et al. Citation(2007) establish a link between a country's export portfolio and its subsequent potential for economic development as countries expand their export portfolio into industries related to their existing export mix. Countries of the Global North occupying densely connected parts of the product/industry space have thus better opportunities to diversify into new industries than countries of the Global South. The lack of opportunities to diversify into a large number of sectors then impedes rapid growth and catch-up processes. The impact of complementary knowledge flows through labour mobility has been examined by Boschma et al. Citation(2009) who demonstrate that firm productivity increases only if workers with complementary rather than different or identical skills are hired. They show that hiring workers with identical skills decreases firm productivity suggesting that only the import of related knowledge results in competitive advantages.
Because complementary knowledge flows bridge existing, but different, knowledge and technology fields, Frenken and Boschma Citation(2007) and Boschma and Frenken Citation(2011) suggest that regions diversify into industries related to the existing portfolio of industries. New, but related, forms of knowledge and organizational routines can be generated through spin-off dynamics (Klepper, Citation2007; Boschma and Wenting, Citation2007), new firm entry in related industries, inflow of labour with complementary skills, or the co-location of suppliers and/or customers to take advantage from learning by doing, learning by using and learning by interacting (von Hippel, 1988). Regional branching into related industries suggests a gradual build up of technological and industrial variety not dissimilar to Charles Darwin's notion of speciation and evolution driven primarily by gradual change.Footnote2 The branching of regions into related manufacturing industries has been studied systematically for 170 Swedish regions (Neffke et al., Citation2011a). Using a measure of relatedness based on co-occurrence of different products in firms, Neffke et al. Citation(2011a) highlight substantial change in regional industrial structure over a thirty-year period driven by entry of industries related to existing industries in the region and exit of less related industries from the region.
This paper builds on and complements this work as follows. First, it attempts to corroborate empirically the findings of Neffke et al. Citation(2011a) in a different geographic context and with a different measure of relatedness. The different mechanisms of knowledge exchange identified above require different measures of relatedness that will in turn capture one particular channel linking sectors. Although the impact of different measures of relatedness on the process of regional branching may differ in magnitude, by sector and metropolitan area, theory suggests that the general result of regional evolution as industrial branching into related industries should hold independently of the channel of knowledge transfer studied and relatedness measure employed. It is important to notice that the focus on a single measure of relatedness impedes a proper evaluation of the sources of differences in results, whether differences are due to different empirical implementation of relatedness or different economic–geographic contexts. The measure of technological relatedness employed in this paper is developed from input–output flows between 362 US manufacturing sectors. This measure is applied to examine the impact of technological relatedness on the entry and exit of new industries in 360 US metropolitan areas over the period 1977–1997. The second contribution of this paper is an analysis of the main components of change in metropolitan technological cohesion. Change in technological cohesion is shown to be the result of changes in technological relatedness among incumbent industries, selection or differential growth of incumbent industries, and the entry and exit of industries. While Neffke et al. Citation(2011a) focus on the entry and exit of industries as drivers of structural change in regions resulting in relatively stable patterns of regional technological cohesion over time, the reallocation of employment towards better connected incumbent industries may also contribute to the evolution of technological cohesion that may result in negative technological lock-in if not counterbalanced by industry entry.
The paper is structured as follows. The second section briefly outlines different approaches to measuring relatedness and explains how relatedness is measured in the context of this paper. The third section discusses the empirical findings linking relatedness to structural change and technological cohesion in 360 US metropolitan areas. The fourth section discusses an employment share-weighted measure of metropolitan technological cohesion and decomposes change in technological cohesion into selection, entry and exit effects. The fifth section concludes the paper.
MEASURING INTER-INDUSTRY RELATEDNESS
Three broad approaches to measure relatedness are distinguished in the literature (Neffke and Henning, Citation2013). The first relies on the hierarchy of industry classifications and defines industries that fall into the same broad industry classes as related. For instance, SIC-4-digit industries belonging to the same SIC-2-digit industry are considered as related. This is the approach chosen by Frenken et al. Citation(2007), Boschma and Iammarino Citation(2009), Boschma et al. (Citation2009, Citation2012), Quatraro Citation(2010), and Hartog et al. Citation(2012). This method is relatively easy to implement and available for a large number of secondary data for different countries and regions. However, the method is criticized on theoretical grounds, as classification of industries into broader industry groups does not necessarily mean that the industries are related technologically or knowledge is exchanged more easily between those sectors.
The second strategy that gained popularity in the recent literature defines relatedness through co-occurrence examining how often two industries are found together in the same economic entity. This work includes the co-occurrence of industries in a country's or a region's export portfolio (Hidalgo et al., Citation2007; Boschma et al., Citation2013), the likelihood of co-production of different products in the same plant said to reveal economies of scope through technological spillovers (Neffke and Henning, Citation2008; Neffke et al., Citation2011a), or the co-occurrence of patent citations (Rigby, 2012). However, co-occurrence assumes technological or cognitive proximity leading to co-production or diversification into related products/sectors and obscures the sources of economies of scope that may emerge from co-occurrence. As a result, it is difficult to determine the type of relatedness that has been measured (Neffke and Henning, Citation2013).
The third approach defines relatedness through similarity in resource use or flow of resources between firms and/or sectors focusing on the role of human capital and the similarity in occupation profiles (Farjoun, Citation1994; Dumais et al., 1997), technological resources using patent analysis (Breschi et al., 2003), and material resources using commodity flows measured through input–output linkages (Fan and Lang, Citation2000; Feser, Citation2003). Resource-based similarity measures suffer from bias because of the strategic relevance given to some resources. Patent-based indicators shed light on relatedness among patent-intensive industries, while input–output-based measures may be more useful for an investigation of manufacturing rather than service industries. Each of the approaches has advantages and disadvantages and the utility of them in various historical, geographical and sectoral contexts needs to be explored further through systematic accumulation of empirical material.
In order to examine whether resource-based measures result in similar conclusions on the link between relatedness and regional industrial branching, this paper follows the literature on input–output relations and adopts a measure of relatedness based on the relative strengths of value flows between pairs of industries.Footnote3 The inter-industry relatedness measure is derived from the ‘Make Table’ and ‘Use Table’ of the detailed 1987 benchmark input–output tables supplied by the Bureau of Economic Analysis (BEA) that include input–output flows between 563 industries. The ‘Make Table’ includes the value of commodities c, produced by industry i. The ‘Use Table’ contains the value of commodities c consumed by industry j. In order to obtain value flows between industries (rather than commodities that are produced by several industries), the following transformation was carried out. First, the ‘Make Table’ was used to find out how much of a commodity c was produced by various industries i. More specifically, sic refers to the share of one unit of commodity c produced by industry i. Second, the ‘Use Table’ was required to reveal the value, Fcj, of commodity c consumed by industry j. In order to obtain the value flows between industries i and j, Fcj was multiplied by the industry-commodity shares, sic. Third, summing the resulting values over industries i and j then yields an estimate of input–output flows, Fij between industries i and j (in US$). Following Fan and Lang Citation(2000), the input–output relatedness between industries i and j, IORij, is measured as:
(1)
One of the drawbacks of input–output tables is the lack of detailed industry classifications for non-manufacturing industries. Hence, the analysis was restricted to the 362 manufacturing sectors (IO Industry numbers 130100–641200) included in the BEA input–output tables. Unfortunately, those 362 IO industry numbers are only a subset of the 453 SIC codes used in census statistics. Because some IO numbers correspond to various SIC codes (for example, 141900 (Sugar) corresponds to SIC codes 2061, 2062 and 2063), the SIC sectors were aggregated to the IO industries resulting in a 362 × 362 industry matrix.Footnote4
This measure of IO–industry relatedness can now be used to examine the role of industry relatedness on structural change in the US space economy. As it is generally assumed that metropolitan areas most closely mirror functional economic spatial entities, the empirical analysis examines industrial branching in 360 US metropolitan statistical areas.Footnote5 In order to examine structural change in those metropolitan areas and the components of change of regional technological cohesion, it was necessary to identify the presence or absence of industries in a metropolitan area. County business patterns provide this information. For each year they include information on employment, number of plants and annual payroll for SIC-4-digit sectors per county. For confidentiality reasons, employment figures for small industries in small counties are often omitted and replaced with employment size bands. However, using the information on the number of plants in different plant size categories (which is not suppressed), Isserman and Westervelt Citation(2006) suggest a data-imputation method that reduces substantially the uncertainty in county–industry employment numbers. Following Isserman and Westervelt Citation(2006), data imputation was carried out for all years of the analysis to reduce the uncertainty in county–industry–employment figures. The second potential data problem arises from a change in industry classification system between 1987 and 1988. In order to analyse structural change, consistent industry classifications are required. A consistent set of industries between 1977 and 1997 was obtained by converting 1972 SICs into 1987 SICs using the Bartelsman–Becker–Gray conversion tables.Footnote6 Unfortunately, a more severe reclassification took place in 1997. Despite existing conversion tables, the new North American Industry Classification System (NAICS) is entirely different from the old SIC system such that consistency over time is compromised and the analysis presented in this paper is restricted to the twenty-year period from 1977 to 1997. For this period, a consistent set of 362 manufacturing industries for 360 metropolitan areas was constructed.
Combining the data on IO relatedness from the BEA input–output tables and industry employment data from the County Business Patterns allows for an analysis of the impact of industry relatedness on structural change in metropolitan areas.
STRUCTURAL CHANGE AND TECHNOLOGICAL COHESION IN US METROPOLITAN AREAS
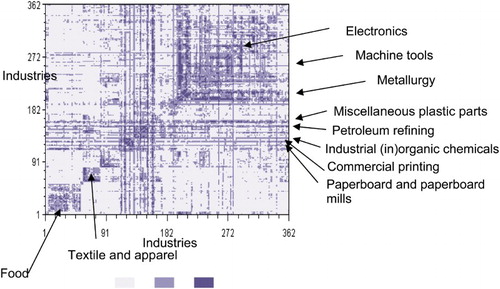
Before examining structural change in metropolitan areas, reveals the IO relatedness between 362 manufacturing sectors in 1987. In order to facilitate readability, the relatedness measure IORij was reduced to three categories using the values for the 90th (0.237) and 75th (0.024) percentiles as cut-off criteria. The white/light purple cells are those with an IORij measure of less than 0.024, medium grey/medium purple values represent those industry pairs with IORij values between 0.024 and less than 0.237, while the dark grey/dark purple values represent those industry pairs with values ≥ 0.237. There are a number of clusters along the main diagonal (food, textile/apparel) and some industries which are tied to most other industries (such as metallurgy and machine tools, petroleum refining, industrial inorganic and organic chemicals).
Fig. 1 Relatedness matrix based on the 1987 input–output table
As the main objective of this paper is to uncover the extent of structural change at the metropolitan level, depicts the change in metropolitan industry composition between 1975 and 1997. The solid line represents the share of industries in metropolitan areas that were present in those areas in 1975. The original set of industry–regions in 1975 constitutes 77.2% of metropolitan industries in 1997. Or put another way, one-quarter of industries that were present in 1975 disappeared from metropolitan industry portfolios by 1997. The dashed line represents the share of industries in metropolitan areas that were present in 1997 and reveals that only 61.0% of industry–regions present in 1997 existed in 1975. These values are similar to those observed for the Swedish case reported by Neffke et al. Citation(2011a).
Fig. 2 Structural change in US metropolitan areas, 1975–1997
The IOR measure reports the relatedness between industry pairs. As metropolitan areas host more than one industry, it is necessary to examine how strongly a single industry in a metropolitan area is related to all other industries that make up a regional portfolio. A regional portfolio of region r, RPFr, in any given year is defined as the set of industries with non-zero employment in the region. In order to count links only to closely related industries, the number of links to industries with IOR values above a certain threshold are counted. The closeness of a particular industry i to all other industries j comprising a regional portfolio r is then defined as:
(2)
where I(.) is an indicator function that takes the value of 1 if the argument is true and 0 if the argument is wrong. Any threshold value could be used to obtain the closeness index. A total of 0.237 is somewhat arbitrary but has been chosen because it constitutes the 90% percentile, that is, 10% of industry pairs have IORij > 0.237.Footnote7
For each region, technological cohesion is then defined as the average closeness value of industries present in a regional portfolio:
(3)
where Nr is the number of industries belonging to regional portfolio RPFr. depicts the technological cohesion of regional portfolios for the years 1977, 1982, 1988 and 1992 (solid line).Footnote8 In addition, the dotted line depicts the average closeness of industries belonging to a regional portfolio to all industries that are not part of the regional portfolio.
Fig. 3 Evolution of metropolitan technological cohesion
According to Neffke et al. Citation(2011a), a regional portfolio is considered to be cohesive if the average closeness of industries to the RPF industries is higher than to industries that are not part of the RPF (regions are considered cohesive if the solid line is above the dotted line). According to , regional portfolios are, on average, cohesive and stable over time. This stability seems somewhat at odds with the turnover of industries depicted in . It is thus useful to examine how the entry and exit of industries influences the technological cohesion of a regional portfolio. Entrants are defined as industries that entered over a five-year period, while exits are defined as industries that exited over a five-year period.Footnote9 The average closeness of entrants to the portfolio of industries in regions they enter is represented by upward-pointing triangles, while the average closeness of exits is represented by diamonds. Entrants tend to be closer to the regional portfolio of industries than industries that remain outside the region, suggesting that regions diversify into industries that are related to the existing industrial base. But entrants are less related to the regional portfolio members than the incumbent portfolio members, suggesting that entrants are complementing rather than simply reproducing the existing industry structure. Entry weakens the technological cohesion of regional portfolios and may be important for regions to avoid negative lock-in (see also ). Exits tend to be more closely related to the regional portfolio than industries that are not part of the regional portfolio, suggesting that they are not entirely unrelated to the regional portfolio of which they have been part. But exits are less close to the regional portfolio of industries than the industries remaining in the portfolio, which suggests that industries that are less close to their regional portfolio are less likely to benefit from knowledge spillovers and, hence, more likely to exit a region. Because the technological cohesion of exits is lower than the technological cohesion of the remaining regional portfolio industries, exit improves the overall cohesion of a region (see also ). Notice that there is little difference in the technological cohesion of entrants and exits. While entrants are closer to the regional portfolio in 1977, exits are closer to the regional portfolio in 1992. The differences between the closeness values of entrants and exits are not statistically significant in 1982 and 1988 (). This is different from the Swedish case, where the technological cohesion of entrants is considerably higher than the technological cohesion of exits and much closer to the technological cohesion of regional portfolio members. But overall, the results are similar despite the fact that relatedness is measured differently and the economic–geographic context differs for the two cases. More specifically, the three main sets of findings identified by Neffke et al. Citation(2011a) are broadly substantiated: First, regional portfolios are technologically cohesive and remain so over time. Second, industries are more likely to enter a region if they are technologically related to the existing regional portfolio of industries. Third, industries that are less closely tied to the regional portfolio than other portfolio members are more likely to exit the industry. These three findings are examined in further detail below.
Membership, entry and exit can be formally defined as:
(4)
(5)
(6)
The member variable takes on a value of 1 if industry i was part of regional portfolio RPFr at time t and 0 if it was not part of RPFr. The entry variable takes on a value of 1 if industry i was not part of regional portfolio RPFr in year t and was part of RPFr in year t + 5. The exit variable takes on a value of 1 if industry i was part of regional portfolio RPFr in year t and was no longer part of RPFr in year t + 5. presents descriptive information of the dummy variables and the size of regions and industries. All tables are based on industry–metropolitan area observations pooled across four five-year periods resulting in 521 280 (352 industries × 360 metropolitan areas × 4 periods) observations for calculations involving the membership dummies. Because entry can only occur if industries were not present in a region in year t, the number of observations involving the entry dummy is reduced to a subsample of 356 454 industry–regions. These are the potential entry opportunities for industries. Because exit can only occur if industries were present in year t, the subsample for potential exit opportunities of 164 826 industry–regions was used for the calculation of descriptive statistics involving the exit dummy. Adding both subsamples results in the complete sample again.
Table 1. Descriptive statistics
reveals the correlation coefficients between values for closeness and member, entry and exit dummies. While the relationship between closeness values and membership and entry dummies is positive, the correlation coefficient for exit is negative. Industries are more likely to be members of a regional portfolio and enter a metropolitan area if they are closely related to the existing portfolio while they are more likely to exit if they are less closely related to the portfolio. All correlation coefficients are statistically significant below the 0.0001 level.
Table 2. Correlation between the values for closeness and the membership, entry and exit dummy variables
In order to determine the economic importance of closeness, it is useful to examine how closeness affects the probabilities of membership, entry and exit. The probability of membership is 31.6% – the total number of industry–regions that exist in year t (164 826) divided by the total number of potential of industry–regions (521 280) – the probability of entry is 8.6% – the number of industry–region entrants (38 690) divided by the total number of potential entry opportunities (356 454) – and the probability of exit is 14.5% – the number of actual exits (31 407) divided by the number of potential exits (164 826). These probabilities can be calculated separately for different closeness values. Because of the large number of values that the closeness variable could assume, closeness values have been grouped into closeness classes with an interval width of five (for example, 0–4, 5–9, etc.). –c depict the probabilities of regional portfolio membership, entry and exit with increasing closeness values.
Fig. 4 Probabilities of membership (a), entry (b) and exit (c)
and reveal that the probabilities of membership and entry are well below average membership and entry probabilities for low closeness values and end up far above them for high closeness values. The probability of regional portfolio membership is more than five times as high for closeness values of thirty or more compared with membership probability for closeness values of 0–4. The relative frequency of entry is close to five times higher for closeness values of thirty or higher than the relative frequency for closeness values of 0–4. depicts the probabilities of exit and demonstrates that exit probabilities decrease from 22.7% for closeness values of 0–4 to 7.7% for closeness values of thirty or higher.
In order to control for potential confounding variables, presents the results of logistic regression analyses with membership (models 1a–c), entry (models 2a–c) and exit (models 3a–c) dummies as dependent variables. Logistic regression rather than ordinary least squares (OLS) is used because the dependent variables are binary variables (yes = 1; no = 0). Robust standard errors are reported in parentheses and odds ratios are reported in brackets. In Models 1a, 2a and 3a the closeness values of individual industries to the regional portfolio of industries are regressed on membership, entry and exit. Confirming the patterns from –c, closeness is positively related to membership and entry, but negatively related to exit. The odds ratios give an indication of how the odds of membership/entry/exit change after a unit change in the dependent variable (that is, one additional link). An odds ratio > 1 indicates an increase in the odds that the outcome is obtained, while an odds ratio < 1 indicates a decrease in the odds that an outcome is obtained when increasing the independent variable by 1 unit. reveals that the odds of membership increase by 6.9%, the odds of entry by 3.7% and the odds of exit decrease by 3.1% if an industry's closeness to the regional portfolio increases by one additional link.
Table 3. Logistic regression analysis of the probabilities of membership, entry and exit
The membership, entry and exit dummies are likely to be influenced by the size of industries and regions. Large industries are more likely to be part of a regional portfolio and are more likely to enter a region and less likely to exit a region. Larger metropolitan areas are able to sustain more industries and are more likely to attract new and retain existing industries. In order to control for size effects, the logarithm of total metropolitan employment and the logarithm (both with base 10) of total national industry employment has been included in models 1b, 2b and 3b. Both variables have the expected signs in all models, but the parameter estimates for closeness declined. The size of industries and metropolitan areas will positively influence membership and entry independent of the relatedness of specific industries to the regional portfolio of industries. Ceteris paribus, they will also influence exit probabilities negatively. In order to get an indication of the size of the effects, it is useful to look at the odds ratios again. The odds ratios for industry and metropolitan size are similar. Keeping the effects of other independent variables constant, a 1-unit increase in the size of a metropolitan area (equalling a tenfold employment increase), will increase the odds of membership by 5.9%, the odds of entry by 2.5% and decrease the odds of exit by 61.4%. Similarly, a 1 unit increase in the size of industry will increase the odds of membership by 5.1%, the odds of entry by 2.9% and decrease the odds of exit by 60.5%. On the other hand, a 1 unit change in the closeness variable would result in an increase in the odds of membership by 1.6% and the odds of entry by 1.4%, while it would decrease the odds of exit by 0.8%.
The probabilities of membership, entry and exit of an industry may also be influenced by its closeness to industry portfolios absent from the region as relatededness to industries in other regions may increase the probability of industries to exit from the regional portfolio and relocate to those regions. Models 1c, 2c and 3c thus add an industry's closeness to the portfolio of industries absent from the region to the model. This variable is negatively related to member and entry probabilities and positively related to exit probabilities. Under ceteris paribus conditions, if a large number of related industries is absent from a region, then membership and entry probabilities are lower and the probability of exit increases. Or, in other words, other regions that host related industries are more likely to host, attract and retain those industries. The signs of the parameter estimates for closeness (RPF), metropolitan and industry size do not change with the inclusion of this variable although the odds ratios for closeness (RPF) and industry size increase somewhat and the odds ratios for the size of metropolitan areas decreases. The odds ratio for the closeness to industries absent from a region is relatively small, lowering the odds of membership and entry by 1.1% and 1.0% and increasing the odds of exit by 0.4% with an additional link to industries absent from the region.
The analysis shows the membership, entry and exit probabilities of individual industries to regional portfolios but does not explain the contribution of industry entry and exit to changes in regional technological cohesion overall. While Neffke et al. Citation(2011a) conceptualize regional evolution as creative destruction through entry and exit of related industries, they do not consider selection effects. Entry and exit are probably the driving forces of change in the long-run, but the differential growth of industries will contribute to changes in regional technological cohesion in the short and medium run. The next section thus offers a decomposition of aggregate changes in metropolitan technological cohesion into selection, entry and exit effects.
COMPONENTS OF CHANGE IN TECHNOLOGICAL COHESION OF METROPOLITAN AREAS
In order to account for selection in addition to entry and exit effects on changes in technological cohesion, an employment-weighted measure of technological cohesion is required. Rather than treating each industry equal as assumed in the previous analysis, the contribution of an industry to the technological cohesion of a metropolitan area depends not only on its closeness to the regional portfolio, but also on its metropolitan employment share. Furthermore, the closeness measure (see equation 2) is in part influenced by the size of a metropolitan area and is expected to be higher in large metropolitan areas than in small metropolitan areas, as larger areas tend to sustain a larger number of industries and, hence, the expected number of links of any single industry is higher in large metropolitan areas with a large number of industries with which to link.Footnote10 Because the desire is to look at the relative effects of entry, exit and incumbents on technological cohesion, it is therefore useful to standardize the closeness of industry i to regional portfolio r by the number of industries in a region, Nr, to obtain the standardized closeness measure, SCir, where:
(7)
The value of this measure can be interpreted as the average number of links of industry i to all other regional portfolio members. depicts the average of SCir for industries belonging to a regional portfolio (solid line), industries absent from the regional portfolio (dashed line), and entering (upward-pointing triangles) and exiting (diamonds) industries. While the result appears similar to the average closeness values depicted in , entrants exhibit considerably higher standardized closeness values than exits (the differences between entry and exit are statistically significant at the 0.01 level for the periods 1977 and 1992, and at the 0.05 level for the periods 1982 and 1988).
Fig. 5 Evolution of standardized metropolitan technological cohesion
An employment-weighted measure of metropolitan technological cohesion of metropolitan area r and at time t, WTCtr, is then defined as:
(8)
where:
is the employment share of industry i in metropolitan area r at time t, divided by total manufacturing employment in the metropolitan area. Following the literature on productivity decomposition (Foster et al., Citation1998), the change in technological cohesion in metropolitan area r and between times t and t + 1 is then:
(9)
The subscript INC denotes incumbent industries, industries that exist in t and t + 1; N represents entering industries that exist in t + 1 but were not in operation in year t; and X denotes exiting industries, industries that were part of the regional portfolio in year t but were no longer present in the region in year t + 1.
Aggregate change in technological cohesion of a metropolitan area can then be understood as the sum of five components. The first three components in equation Equation(9)(9) represent changes relating to incumbent industries, while the fourth component represents changes attributed to entrants, and the fifth component represents changes attributed to exits. The first incumbent term measures the change in the standardized closeness values of incumbent industries assuming that employment shares of those industries remain constant. This term is usually interpreted as innovation effect in productivity studies, but here refers to the adaptation of the regional portfolio to the existing sets of industries. Because the relatedness between sectors, IORij (see equation 1) was kept constant over time, SCir can only change if the composition of the regional portfolio changes. Thus, a positive ‘portfolio effect’ means that the regional industry portfolio has become more closely related to its incumbent industries, that is, the net effect of entry and exit results in a more coherent portfolio (assuming that the relative weight of incumbent industries is kept constant). The second term represents a selection effect. This term is positive if industries with standardized relatedness values higher than the value for the regional average (weighted technological cohesion) expand their employment shares relative to those with relatedness values lower than the regional average. The term is negative if less related industries expand market shares or if more related industries shrink. If industries do indeed benefit from their relatedness with other sectors in the metropolitan area, then selection would expected to be positive. The third term is a covariance term that is positive if industries for which the regional portfolio of industries has become more closely related also expand their market shares. From an evolutionary point of view, the selection effect is the most interesting and meaningful of the three incumbent effects and, as illustrates, it is also the most important of the three incumbent effects to explain aggregate change in technological cohesion. The entry term is positive if entering industries are more closely related to the regional portfolio than average. The exit term is negative if industries more closely related to the regional portfolio than average exit the metropolitan area and positive if less closely related industries exit the industry (the exit of less related industries increases metropolitan technological cohesion).
Table 4. Components of change in employment-weighted metropolitan technological cohesion, 1977–1997
depicts the average contributions of each component to average change in metropolitan technological cohesion for each of the four periods. The percentages (in parentheses) are based on the share of each component on the sum of the absolute values of the five components.
The employment-weighted technological cohesion measure increased during all periods and growth was most pronounced in the periods 1977–1982 (2.87%) and 1992–1997 (2.78%). Although entry and exit contribute significantly to aggregate changes in technological cohesion in all periods (in particular up to the mid-1980s), selection effects are not negligible and selection was the most important effect from 1988 onwards. It is also noticeable that entry reduces technological cohesion, although the net effect of entry and exit results in an increase in cohesion save for the period 1992–1997. While industry entry and exit are important for shaping metropolitan technological cohesion, the decomposition analysis also demonstrates that selection operating on incumbent industries constitutes an important evolutionary force, at least in the short and medium run. The analysis also demonstrates that high contributions of selection and exit results in increasing employment concentrations in related industries.
CONCLUSION
This paper contributes to the conceptual and empirical development in evolutionary economic geography focusing on the emergence and path-dependent trajectory of technological and industrial variety (Boschma and Frenken, Citation2006; Boschma and Martin, Citation2010; Essletzbichler and Rigby, Citation2010; Essletzbichler, Citation2012). More specifically, it complements and augments the literature on relatedness and the conceptualization of regional evolution as industrial branching process (Frenken and Boschma, Citation2007; Neffke et al., Citation2011a). Rather than measuring relatedness through co-occurrence or exploiting information embedded in industry hierarchies, this paper attempted to corroborate the general findings of this literature with a relatedness measure based on the relative strength of input–output relations (Fan and Lang, Citation2000). One of the shortcomings of using a different relatedness measure is the inability to identify the sources of similarities and differences in results as they could arise from the properties of the respective relatedness measures or from differences in economic–geographic context (for example, differences in subsidies to keep unproductive industries alive, research and development (R&D) programmes to search actively for and attract new industries to a region, etc.).
Despite the differences in measurement and context, this paper confirms broadly the results of Neffke et al.'s (2011a) analysis of the Swedish manufacturing sector. First, the probabilities of metropolitan industry portfolio membership and entry to the portfolio are positively related to the closeness of those industries to their respective metropolitan industry portfolios, while exit probabilities increase with declining closeness to the metropolitan portfolio. Second, the average number of links of entrants and exits is smaller than the average number of links among metropolitan portfolio members. Thus, while entrants add technological variety and decrease technological cohesion, exits reduce technological variety and increase technological cohesion in a metropolitan area. Third, as a result of the combined entry and exit effects and despite considerable industry turnover, metropolitan technological cohesion remains relatively stable over time. While those results are broadly confirmed, the relative impact of relatedness on the probabilities of membership, entry and exit differs between the Swedish and US case. More systematic comparative research is necessary to examine the origin of those differences.
In a second step, the paper then examined the impact of different forces behind changes in technological cohesion including selection, entry and exit. For this purpose, an employment-weighted measure of technological cohesion was developed where not only relatedness, but also the relative size of sectors was taken into consideration. Changes in employment-weighted cohesion could then be decomposed into selection, entry and exit effects. While the entry/exit dynamic explains in part the evolution of metropolitan technological cohesion, selection effects are equally important in the US case. Cities become more cohesive because the positive effect of exit on technological cohesion is larger than the negative effect of entry and because those industries that are more closely related to the metropolitan industry portfolio expand their employment shares relative to those that are not. Because of the variety-reducing effects of selection and exit, entry is essential to inject novelty in metropolitan areas. The decomposition analysis demonstrates the importance of employment reallocation to related incumbent industries and the importance of entry to lower technological cohesion, but it does not answer the question whether technological cohesion, changes in cohesion or the contribution of individual components result in faster economic transformation or metropolitan growth.
The results point to a number of future research questions with important policy implications. First, while it is interesting to uncover the roots of path-dependent evolution in metropolitan areas, it is important to examine how the technological cohesion of metropolitan areas is linked to their performance including changes in employment and unemployment rates, productivity and output growth or the pace of technological change. Are regions that are more/less technologically cohesive expanding their market shares relative to those that are not?
Second, detailed historical industry case studies could help to examine the trajectories of individual metropolitan areas over time as performance is likely linked to particular metropolitan industry specializations (see also Hidalgo et al., Citation2007; Potter and Watts, Citation2012). Are areas with industries occupying central locations in product space more likely to diversify into new industries and, hence, rejuvenate their economies? Are those areas with industries occupying peripheral parts of the product space more likely to become locked into a declining regional trajectory and/or have less potential to create new evolutionary pathways?
Third, a more careful analysis of the components of change for individual metropolitan areas may help identify the main bottlenecks for future economic development. If incumbent industries dominate a metropolitan area, selection pressures may result in negative lock-in, while too much entry may result in technological incoherence and lack of knowledge spillovers between individual sectors.
Fourth, the focus on branching into related industries paints a picture of gradual metropolitan evolution. However, cities often go through phases of rapid transformation and surges of economic growth that are difficult to reconcile with this image of gradual change. Hence, the identification of threshold effects or minimum levels of relatedness could prove important for regional path creation and needs to be investigated in future papers on regional evolution. Future work also requires an explicit analysis of the time frame over which change is measured as radical technological breakthrough will occur necessarily in one place or another over longer time frames. It certainly will require new methodological work as existing industry, product or skill classifications will be unable to shed light on radically new industries, products or skills not yet defined as such. Work also needs to take into consideration the fact that relatedness measures are based on actually observed and already-made links, but that they do exclude industry complementarities that are not yet exploited and hence detectable with those measures.Footnote11
In this sense, the analysis presented in this paper complements and adds to the rapidly growing theoretical and empirical literature in evolutionary economic geography on the role of relatedness for the creative destruction of regional and metropolitan economies. It points towards the need for theoretical refinement and systematic comparative empirical work to understand the influence of different relatedness measures, time frames and geographic context on the empirical findings.
Acknowledgement
The author would like to thank the three independent reviewers for their critical engagement with an earlier version of this paper and for excellent suggestions to improve it.
Notes
1. SIC = Standard Industry Classification.
2. Exploring the existence of critical threshold effects to generate rapid regional transformations would be an interesting study of research and could point towards regional evolution as punctuated equilibria rather than gradual change.
3. As one of the reviewers pointed out, this paper contributes a novel empirical analysis to the existing set of studies on industrial branching, but is unable to offer a clear conclusion on the origin of diverging results from other studies as not only the measure of relatedness, but also the geographic and temporal contexts vary.
4. In this analysis industry relatedness is held constant over the whole period to facilitate the component-of-change analysis. Treating relatedness as a dynamic concept is left for future investigation.
5. For a complete list and definition of metropolitan areas, see http://www.census.gov/population/metro/data/metrodef.html/. Metropolitan areas in Alaska, Hawaii and Puerto Rico were excluded from the analysis.
6. See http://www.nber.org/nberces/.
7. Substituting these relatedness values with the original IORij values or a threshold value of 0.024, the 75th percentile, does not produce qualitatively different results from those presented here. The logistic regression results are presented in in Appendix A.
8. The year 1988 rather than 1987 was chosen as the starting year of the third period in order to eliminate a potential impact of the industry reclassification on entry and exit rates.
9. Experiments with one-year periods did not alter the conclusions of the results.
10. This was addressed through the inclusion of metropolitan size as an independent variable in the regression analysis presented in .
11. The author thanks one of the reviewers who pointed this out as this is an important methodological question that will need addressing especially when examining change over long time frames.
Related Research Data
REFERENCES
- Baldwin J. (1998). The Dynamics of Industrial Competition. A North American Perspective. Cambridge University Press, Cambridge.
- Bathelt H., Malmberg A. and Maskell P. (2004). Clusters and knowledge: local buzz, global pipelines and the process of knowledge creation, Progress in Human Geography 28, 31–56.
- Beaudry C. and Schiffauerova A. (2009). Who's right, Marshall or Jacobs? The localization versus urbanization debate, Research Policy 38, 318–337.
- Boschma R., Eriksson R. and Lindgren U. (2009). How does labour mobility affect the performance of plants? The importance of relatedness and geographical proximity, Journal of Economic Geography 9, 169–190.
- Boschma R. and Frenken K. (2006). Why is economic geography not an evolutionary science? Towards and evolutionary economic geography, Journal of Economic Geography 6, 273–302.
- Boschma R. and Frenken K. (2011) Technological Relatedness and Regional Branching. Working Paper Series Number 09.07, Papers in Evolutionary Economic Geography, Utrecht University, Utrecht.
- Boschma R. and Iammarino S. (2009). Related variety, trade linkages and regional growth, Economic Geography 85, 289–311.
- Boschma R. and Martin R. (Eds) (2010). The Handbook of Evolutionary Economic Geography. Edward Elgar, Cheltenham.
- Boschma R., Minondo A. and Navarro M. (2012). Related variety and regional growth in Spain, Papers in Regional Science 91, 241–256.
- Boschma R., Minondo A. and Navarro M. (2013). The emergence of new industries at the regional level in Spain: a proximity approach based on product relatedness, Economic Geography 89, 29–51.
- Boschma R. and Wenting R. (2007). The spatial evolution of the british automobile industry. Does location matter?, Industrial and Corporate Change 16, 213–238.
- Breschi S., Lissoni F. and Malerba F. (2003) Knowledge-relatedness in firm technological diversification, Research Policy 32, 69–87..
- Davis S., Haltiwanger J. and Schuh S. (1996). Job Creation and Destruction. MIT Press, BostonMA.
- De Groot H. L. F., Poot J. and Smit M. J. (2009). Agglomeration externalities, innovation and regional growth: theoretical perspectives and meta-analysis, in Capello R. and Nijkamp P. (Eds) Handbook of Regional Growth and Development Theories. Edward Elgar, NorthamptonMA256–281.
- Dumais G., Ellison G. and Glaeser E. (1997) Geographic Concentration as Dynamic Process. NBER Working Paper Number 6270. National Bureau of Economic Research (NBER), Cambridge, MA..
- Dunne T., Roberts M. and Samuelson L. (1988). Patterns of firm entry and exit in U.S. manufacturing industries, Rand Journal of Economics 19, 495–515.
- Duranton G. and Puga D. (2001). Nursery cities: urban diversity, process innovation, and the life cycle of products, American Economic Review 91, 1454–1477.
- Essletzbichler J. (2004). The geography of job creation and destruction in the US manufacturing sector, 1967–1997, Annals of the Association of American Geographers 94, 602–619.
- Essletzbichler J. (2012). Generalized Darwinism, group selection and evolutionary economic geography, Zeitschrift für Wirtschaftsgeographie 56, 129–146.
- Essletzbichler J. and Rigby D. L. (2002). The impact of industry mix, technological change, selection, and plant entry and exit on metropolitan labor productivity in the United States, Urban Geography 23, 279–298.
- Essletzbichler J. and Rigby D. L. (2005). Competition, variety and the geography of technology evolution, Tijdschrift voor Economische en Sociale Geografie 95, 48–62.
- Essletzbichler J. and Rigby D. L. (2010). Generalized Darwinism and evolutionary economic geography, in Boschma R. and Martin R. (Eds) The Handbook of Evolutionary Economic Geography. Edward Elgar, Cheltenham43–61.
- Fan J. P. H. and Lang L. H. P. (2000). The measurement of relatedness: an application to corporate diversification, Journal of Business 73, 629–660.
- Farjoun M. (1994). Beyond industry boundaries: human expertise, diversification and resource related industry groups, Organization Science 5, 185–199.
- Feser E. (2003). What regions do rather than make: a proposed set of knowledge-based occupation clusters, Urban Studies 40, 1937–1958.
- Foster L., Haltiwanger J. and Krizan C. (1998) Aggregate Productivity Growth: Lessons from Microeconomic Evidence. NBER Working Papers Number 6803. National Bureau of Economic Research (NBER), Cambridge, MA.
- Frenken K. and Boschma R. A. (2007). A theoretical framework for evolutionary economic geography: industrial dynamics and urban growth as a branching process, Journal of Economic Geography 7, 635–649.
- Frenken K., Izquierdo L. R. and Zeppini P. (2012) Recombinant Innovation and Endogeneous Technological Transitions. Working Paper Number 12.01. Eindhoven Centre for Innovation Studies, Eindhoven University of Technology, Eindhoven.
- Frenken K., van Oort F. G. and Verburg T. (2007). Related variety, unrelated variety and regional economic growth, Regional Studies 41, 685–697.
- Glaeser E., Kallal H. D., Scheinkman J. A. and Schleifer A. (1992). Growth in cities, Journal of Political Economy 100, 1126–1152.
- Grabher G. (1993). The weakness of strong ties – the lock-in of regional development in the Ruhr area, in Grabher G. (Ed.) The Embedded Firm, pp. 255–277. Routledge, London.
- Hartog M., Boschma R. and Sotarauta M. (2012). The impact of related variety on regional employment growth in Finland 1993–2006: high-tech versus medium/low-tech, Industry and Innovation 19, 459–476.
- Hassink R. and Shin D. H. (2005). Guest Editorial: The restructuring of old industrial areas in Europe and Asia, Environment and Planning A 37, 635–356.
- Hausmann R. and Klinger B. (2007) The Structure of the Product Space and the Evolution of Comparative Advantage. Working Paper Number 146. Center for International Development, Harvard University, Cambridge, MA.
- Henderson J. V., Kuncoro A. and Turner M. (1995). Industrial development in cities, Journal of Political Economy 103, 1067–1085.
- Hidalgo C. A., Klinger B., Barabasi A.-L. and Hausmann R. (2007). The product space conditions and the development of nations, Science 317, 482–487.
- Isserman A. M. and Westervelt J. (2006). 1.5 million missing numbers: overcoming employment suppression in Country Business Patterns data, International Regional Science Review 29, 311–335.
- Jacobs J. (1969). The Economy of Cities. Vintage, New YorkNY.
- Klepper S. (2007). Disagreements, spinoffs, and the evolution of Detroit as the capital of the U.S. automobile industry, Management Science 53, 616–631.
- Marshall A. (1920) The Principles of Economics, 8th Edn. Macmillan, London..
- Martin R. (2010). Rethinking regional path-dependence: beyond lock-in to evolution, Economic Geography 86, 1–27.
- Martin R. and Sunley P. (2006). Path dependence and regional economic evolution, Journal of Economic Geography 6, 395–437.
- Neffke F. and Henning M. (2008) Revealed Relatedness: Mapping Industry Space. Working Paper Series Number 08.19. Papers in Evolutionary Economic Geography, Utrecht University, Utrecht.
- Neffke F. and Henning M. (2013). Skill relatedness and firm diversification, Strategic Management Journal 34, 297–316.
- Neffke F., Henning M. and Boschma R.How do regions diversify over time? Industry relatedness and the development of new growth paths in regions, Economic Geography2011a87, 237–265.
- Neffke F., Henning M., Boschma R., Lundquist K. J. and Olander L. O.The dynamics of agglomeration externalities along the life cycle of industries, Regional Studies2011b45, 49–65.
- Nooteboom B. (2000). Learning and Innovation in Organizations and Economies. Oxford University Press, Oxford.
- Potter A. and Watts D. (2012). Revisiting Marshall's agglomeration economies: Technological relatedness and the evolution of the Sheffield metals cluster, Regional Studies doi: 10.1080/00343404.2012.667560.
- Quatraro F. (2010). Knowledge coherence, variety and economic growth: manufacturing evidence from Italian regions, Research Policy 39, 1289–1302.
- Rigby D. L. (2012). The Geography of Knowledge Relatedness and Technological Diversification in U.S. Cities, Papers in Evolutionary Economic Geography (PEEG) Number 1218. Utrecht University, Utrecht.
- Rigby D. and Essletzbichler J. (2000). Impacts of industry mix, technological change, selection and plant entry/exit on regional productivity growth, Regional Studies 34, 333–342.
- Rigby D. L. and Essletzbichler J. (2006). Technological variety, technological change and a variety of production techniques, Journal of Economic Geography 6, 45–70.
- Rosenthal S. and Strange W. (2004). Evidence on the nature and sources of agglomeration economies, in Henderson J. V. and Thisse J. F. (Eds) Handbook of Regional and Urban Economics, Vol. 4, pp. 2119–2171. Elsevier, New YorkNY.
- Schumpeter J. (1939). Business Cycles. McGraw-Hill, New YorkNY.
- Storper M. and Walker R. (1989). The Capitalist Imperative. Blackwell, New YorkNY.
- Tödtling F. and Trippl M. (2004). Like phoenix from the ashes: the renewal of clusters in old industrial areas, Urban Studies 41, 1175–1195.
- Von Hippel E. (1988). Sources of Innovation. Oxford University Press, Oxford.