
 ?Mathematical formulae have been encoded as MathML and are displayed in this HTML version using MathJax in order to improve their display. Uncheck the box to turn MathJax off. This feature requires Javascript. Click on a formula to zoom.
ABSTRACT
The operationalization of smart specialization policy has been rather limited because a coherent set of analytical tools to guide the policy directives remains elusive. We propose a policy framework around the concepts of relatedness and knowledge complexity. We show that diversifying into more complex technologies is attractive but difficult for European Union regions to accomplish. Regions can overcome this diversification dilemma by developing new complex technologies that build on local related capabilities. We use these findings to construct a policy framework for smart specialization that highlights the potential risks and rewards for regions of adopting competing diversification strategies.
INTRODUCTION
In a market economy, the rapidity of technological change forces continuous adaptation as innovation and economic crises reshuffle the competitive standing of firms and regions alike. Within this environment, the capacity to develop new ideas, to recombine existing knowledge assets and blaze new technological trajectories is imagined to offer at least temporary respite to the relentless pressure of falling costs. Facing a variety of technological possibilities and an uncertain future, however, few economic agents are in a position to identify the best way forward. It was against this backdrop that the European Union (EU) forged the ambitious growth strategy called Europe 2020.
At the core of this development strategy is smart specialization, a vision of regional growth possibilities built around existing place-based capabilities (Barca, Citation2009; Foray, David, & Hall, Citation2009, Citation2011; McCann & Ortega-Argilés, Citation2015). The goal of smart specialization is not to make the economic structure of regions more specialized (i.e., less diversified), but instead to leverage existing strengths, to identify hidden opportunities and to generate novel platforms upon which regions can build competitive advantage in high value-added activities. Smart specialization emanated from the idea that regions across the EU have different economic and institutional structures that shape possibilities for their future development (Kroll, Citation2015). The result was a clear denunciation of the top-down ‘one-size-fits-all’ policy that had led the EU to fund nation-states rather than individual regions, and fashionable sectoral targets rather than realistic industrial foundations (Asheim, Grillitsch, & Trippl, Citation2016; Tödtling & Trippl, Citation2005).
The question remained: how does one identify the targets of place-based development policy? An answer was readily available in the recommendations of the Knowledge for Growth Expert Group (Foray et al., Citation2009). Their call for smart specialization focused on building competitive advantage in research domains and sectors where regions possessed strengths and leveraging those capabilities through diversification into related activities (Foray et al., Citation2012). In important ways, this work built a series of policy prescriptions around the concept of heterogeneity in regional knowledge bases and path dependence in their evolution (Rigby & Essletzbichler, Citation1997) and the related variety concept (Frenken, Van Oort, & Verburg, Citation2007). However, the operationalization of smart specialization has been criticized as a ‘perfect example of policy running ahead of theory’ (Foray, David, & Hall, Citation2011, p. 1), lacking an ‘evidence base’ (Morgan, Citation2015; Unterlass et al., Citation2015), and building on ‘anecdotal evidence rather than the application of theoretically grounded methodologies’ (Iacobucci & Guzzini, Citation2016, p. 1511; see also Santoalha, Citation2016).
This paper aims to contribute to this debate in three ways. First, it provides a theoretical framework for smart specialization around the concepts of relatedness (Hidalgo, Klinger, Barabassi, & Hausmann, Citation2007; Neffke, Henning, & Boschma, Citation2011) and knowledge complexity (Balland & Rigby, Citation2017; Hidalgo & Hausmann, Citation2009). Second, it assesses this policy framework empirically and provides new evidence on how EU regions develop new technological fields. To achieve this goal, we identify existing knowledge bases of EU regions, develop a measure of relatedness between technological categories using data from the European Patent Office (EPO) and calculate a knowledge complexity measure of technology classes using network-based techniques. Third, it combines the relatedness and complexity measures in a smart specialization policy tool that assesses the costs and benefits of alternative technological trajectories in each region.
The paper is organized as follows. The next section presents the theoretical concepts of relatedness and knowledge complexity as key building blocks of smart specialization policy. The third section shows how these may be operationalized using patent documents and network-based techniques. The fourth section presents new econometric evidence on how relatedness and knowledge complexity have shaped diversification patterns in European regions between 1990 and 2009. The fifth section combines the relatedness and complexity measures in a smart specialization policy framework. The sixth section applies this framework to examine diversification prospects across a series of EU regions. The seventh section provides a brief conclusion and discusses some remaining questions related to smart specialization policy.
BUILDING BLOCKS OF SMART SPECIALIZATION
This section connects the smart specialization literature (Foray et al., Citation2009, Citation2011) with the regional diversification (Hidalgo et al., Citation2007; Neffke et al., Citation2011) and economic complexity literature (Hidalgo & Hausmann, Citation2009). We argue that relatedness and knowledge complexity are key building blocks of smart specialization, which we envisage as a place-based policy in which regions aim at renewing and upgrading their economic structure by building on their existing capabilities (Boschma, Citation2014).
Technological relatedness and regional diversification
Competition in today’s global economy rests heavily on innovation as many of the standard price-based forms of economic advantage have been flattened. As the overall stock of knowledge has expanded, a division of labour distributed its parts widely across agents and different regions. Thus, regional economies are increasingly understood as localized communities of practice that reflect place-bound sets of technological capabilities, routines and institutional arrangements (Storper, Citation1997). With knowledge production increasingly conceived as a process of recombining existing ideas (Weitzman, Citation1998), so regional economies are imagined to move along place-based technological trajectories, where processes of search and exploration are guided by existing knowledge capabilities and well-established routines (Dosi, Citation1982; Rigby & Essletzbichler, Citation1997). This is not to argue that knowledge spillovers and other forms of knowledge sharing are always localized (Bathelt, Malmberg, & Maskell, Citation2004). However, the tacit nature of much knowledge means that geography continues to play a critical role in the emergence and evolution of technology, especially that which is complex and more valuable, for many kinds of knowledge do not travel well (Balland & Rigby, Citation2017; Maskell & Malmberg, Citation1999; Sorenson, Rivkin, & Fleming, Citation2006).
The idea that new technology is born of existing ideas has rekindled the debate on the costs and benefits of regional diversity (Balland et al. Citation2015; Essletzbichler, Citation2015). Frenken et al. (Citation2007) suggest that more important than the overall variety of sectors found in different regions is the extent to which elements of that variety are related. The relatedness concept rests on the idea that knowledge has an architecture that is based upon similarities and differences in the way that different types of knowledge can be used. When knowledge subsets are close substitutes for one another, or when they demand similar sets of cognitive capabilities and skills for their use, we think of them as being related or proximate to one another in some form of ‘knowledge space’ (Breschi, Lissoni, & Malerba, Citation2003). Organizations compete through extending their knowledge domains and their capacity to use more components of the knowledge space. They do this by search and exploration of different parts of that space. Search costs rise rapidly around the boundaries of existing expertise and thus the cost of diversification hinges critically on the distance between knowledge components that are known and those that remain as yet unknown (Atkinson & Stiglitz, Citation1969; Chatterjee & Wernerfelt, Citation1991; Webber, Sheppard, & Rigby, Citation1992).
For Frenken and Boschma (Citation2007), diversification is imagined as a branching process that gives rise to new activities within regions. Related diversification of cities and regions is depicted as a higher-order reflection of micro-level dynamics in which individuals and organizations extend the scope of their activities around the technological competencies and the behavioural routines that they accumulate over time (Balland, Citation2016). Thus, the emergence of new technologies and new sectors within regions is not random, rather it reflects the existing collective capacity of agents that produce regions with distinctive technological and industrial profiles. A large and expanding volume of empirical studies provides supporting evidence (Boschma, Citation2017). Hidalgo et al. (Citation2007) explored how countries expand their mix of exports around the products in which they already established a comparative advantage. Neffke et al. (Citation2011) used product portfolios of manufacturing plants to understand sectoral relatedness and exploited this methodology to examine industrial diversification in Swedish regions. Along similar lines, Rigby (Citation2015) and Boschma, Balland, and Kogler (Citation2015) used measures of relatedness between patent classes to predict the evolution of technological change within US cities. At a more global scale, Petralia, Balland, and Morrison (Citation2017) analyzed technological branching using patent applications by inventors in 65 countries.
Based on this discussion, we formulate two hypotheses on relatedness that will be tested for European regions, and which will be used in the fifth section to formulate a smart specialization policy framework in which relatedness reflects the difficulty or cost of moving from one technology to another.
Hypothesis 1: Regions are more likely to develop new specializations in technological activities that are related to their knowledge bases.
Hypothesis 2: Regions are more likely to experience technological growth in technological activities that are related to their knowledge bases.
Knowledge complexity and regional diversification
Knowledge bases of regions vary in terms not only of their technological composition but also of their value. The value of knowledge types or technologies, like most goods, reflects a balance of supply and demand. Technologies that are simple to copy, and which can be moved easily over space, tend to be of little value and thus do not provide a source of long-run rents. Technologies that are more complex and difficult to imitate are more sticky in space: they hold promise as sources of competitive advantage for the firms and regions in which they are generated. A standard distinction separates forms of knowledge that are codified from that which is tacit (Maskell & Malmberg, Citation1999). Because tacit knowledge is built around interpersonal contact and collections of routines embodied in individual firms and localized networks, it tends to be rooted in place. Tacit knowledge is viewed as a primary source of competitive advantage for firms (Kogut & Zander, Citation1992) and regions (Asheim & Gertler, Citation2005; Lawson & Lorenz, Citation1999). Though competition renders much that is tacit codifiable over time, continuous learning and recombinant innovation provide sustained economic advantage to more technologically dynamic regions.
Which regions hold the most valuable knowledge, especially that which is tacit and therefore difficult to access? So far it has proven difficult to answer this question, at least in part because there are no readily available measures of tacit knowledge, let alone its spatial distribution. Kogut and Zander (Citation1993) argue that complexity is a critical dimension of what makes some knowledge tacit. After Simon (Citation1962), the complexity of a technology, a subset of knowledge, is understood as a function of the number of components out of which it is constructed and the interdependence of those components (Fleming & Sorenson, Citation2001). Hidalgo and Hausmann (Citation2009) developed an idea of product and place complexity based on the product-level diversity of national economies and the ubiquity (or range) of countries across which individual products are produced. They argue that countries develop different core competences: countries that amass larger sets of capabilities tend to produce more specialized products that are hard to copy or imitate by others. The complexity of an economy is embodied in the wide range of knowledge or capabilities that are combined to make products: less ubiquitous products are more likely to require a greater variety of capabilities. These specialized (complex) goods tend to be produced by relatively few national economies and form the basis for long-run competitive advantage. Complex goods also tend to be in their early stages of development, which enhances further their growth potential. Balland and Rigby (Citation2017) report wide variations in the complexity of knowledge produced across US cities that correlate highly with longer-run patterns of economic performance, with only a few metropolitan areas capable of producing the most complex technologies.
It should be clear that regions benefit from building comparative advantage in complex technologies. Regions that are early innovators lock in growth around new technologies based on cumulative technological advantages and quasi-monopolistic rents. However, complex technologies are relatively scarce and it is therefore difficult for agents that comprise regional economies to develop competences in these fields. These two tendencies give rise to a ‘diversification dilemma’. On the one hand, the search for technological rents pushes regional actors to seek out complex knowledge possibilities. On the other hand, complex technologies remain out of reach for most because they lack the diversity of capabilities out of which complex technologies are derived. The general solution to the ‘diversification dilemma’ is for regional economies to develop their existing knowledge cores and to expand their technological repertoires along related trajectories that lead toward more complex technologies.
Based on this discussion, we formulate four hypotheses on complexity that will be tested for European regions, and which will be used in the fifth section to formulate a smart specialization policy framework in which complexity is associated with the benefits of moving from one technology to another:
Hypothesis 3: Regions are less likely to develop new specializations in complex technological activities.
Hypothesis 4: Regions are more likely to experience technological growth in complex technological activities.
Hypothesis 5: Regions are more likely to develop new specializations in complex technological activities when related to their knowledge bases.
Hypothesis 6: Regions are more likely to experience technological growth in complex technological activities when related to their knowledge bases.
DATA AND METHODS
A key challenge for smart specialization policy is to develop a framework to identify systematically technological opportunities in regions. We define technological opportunity as the potential to develop critical capacity in a technology that (1) draws on the specific knowledge bases of the region and (2) leads to technological upgrading. Technological opportunities can be identified as those technologies in which a region does not yet possess critical capacity but that have a high degree of relatedness with the region’s existing knowledge base, and which will enhance the knowledge complexity of the region. We use patent data to measure relatedness between different sets of knowledge (captured by patent classes) and the complexity value of technologies. The relatedness measure provides an indicator of the cost of moving from one technology to another, while complexity provides a way of assessing the potential benefits of such movement.
We use the OECD-REGPATFootnote1 database to identify technological fields and compute measures of relatedness and knowledge complexity. The OECD-REGPAT derives from PATSTAT: it contains all patent applications to the EPO between 1977 and 2011. Patent applications are regionalized at the NUTS-2 level by inventor address.Footnote2 Although the geographical coverage of the data spans all OECD countries, the focus is restricted to the EU-28 plus Iceland, Norway and Switzerland. Patent applications are classified in technological domains according to the International Patent Classification (IPC). We use Cambridge Econometrics to measure regional population, population density and gross domestic product (GDP) per capita.
Measuring relatedness between technologies
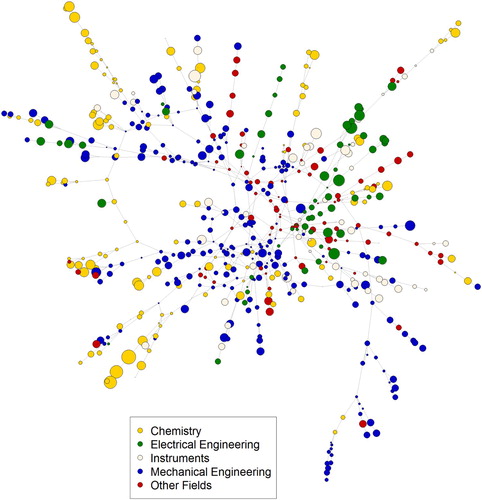
To measure technological relatedness between patent classes, we use the distribution of knowledge claims by IPC class on each patent across the EU as a whole, following Boschma et al. (Citation2015) and Rigby (Citation2015). This is done by counting the number of EU patents for a given period that contains a co-class pair, say i and j, and then standardizing this count by the total number of patents that record knowledge claims in IPC classes i and j. Relatedness is, therefore, a standardized measure of the frequency with which two IPC classes appear on the same patent. We use a standardization method (Steijn, Citation2017) based on Van Eck and Waltman (Citation2009), as implemented in the relatedness function of the EconGeo R package (Balland, Citation2017).Footnote3 The relatedness between technologies can be formalized as a network, the knowledge space. The knowledge space is an n*n network where the individual nodes i (i = 1, … , n) represent technological categories (IPC classes), and the links between them indicate their degree of relatedness. We compute relatedness () between each pair of technologies i and j for five different non-overlapping periods: 1985–89, 1990–94, 1995–99, 2000–04 and 2005–09. shows the relatedness network for the EU for the period 2005–09. Individual nodes are coloured according to the five aggregate technological fields defined by Schmoch (Citation2008).Footnote4
Figure 1. European knowledge space.
While displays the relatedness between technology pairings for the EU as a whole, it is also possible to identify the knowledge structure of individual regions within the EU. We are particularly interested in exploring the knowledge cores of regions (Heimeriks & Balland, Citation2016), or how much of the technology produced within each NUTS-2 region (as captured by number of patents) tends to cluster around individual technological fields. Thus, for each region r, we calculated the density of technology production in the vicinity of individual technologies i. Following Hidalgo et al. (Citation2007) and Boschma et al. (Citation2015), the density of knowledge production around a given technology i in region r at time t is derived from the technological relatedness of technology i to all other technologies j in which the region has relative technological advantage (RTA), divided by the sum of technological relatedness of technology i to all the other technologies j in the reference region (Europe) at time t:Footnote5
RTA is a binary variable that assumes the value 1 when a region possesses a greater share of patents in technology class i than the reference region (the EU as a whole); and 0 otherwise. A region r has RTA in production of technological knowledge i (r = 1, … , n; i = 1, … , k) such that
if:
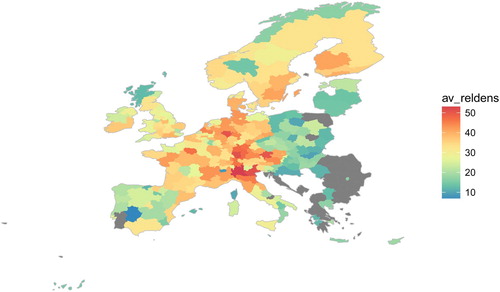
shows for all European regions the average relatedness density between existing technologies in a region and all potential alternative technologies for the period 2005–09. The higher the region’s score on relatedness density, the closer, on average, its existing set of technologies to those technologies that are missing in the region. In other words, it reflects an overall average score of the potential of a region to develop new technologies. shows there are huge differences in branching potential between countries and between regions in Europe. In general, Central Europe (north Italy, south Germany, Austria) shows high potentials to develop new technologies, in contrast to many regions in southern and eastern Europe where branching opportunities are much lower.
Figure 2. Branching opportunities of European regions.
Measuring knowledge complexity
Which technologies and regions hold the most valuable knowledge, especially that which is tacit and thus difficult to access? A long literature explores the characteristics and value of innovations (Abernathy & Clark, Citation1985). Using patent data, it is common to assess the quality and value of knowledge using forward citations (Trajtenberg, Citation1990) or composite indicators including citations, family size, renewals and litigation (Castaldi, Frenken, & Los, Citation2015; Harhoff, Scherer, & Vopel, Citation2003). However, it remains unclear whether such measures accurately capture the characteristics of knowledge stocks that generate value. Maskell and Malmberg (Citation1999) suggest that tacit forms of knowledge are valuable because they are difficult to replicate. But this raises the problem of measuring the tacit dimension of knowledge. Kogut and Zander (Citation1993) argue that complexity is a critical component of tacit knowledge and thus propose complexity as a proxy measure of tacit knowledge.
How then to measure knowledge complexity? From Simon (Citation1962), complexity is understood as a function of the number of components out of which knowledge is constructed and the interdependence of those components. Fleming and Sorenson (Citation2001) develop these ideas in a measure of complexity for individual patents that captures the difficulty of combining knowledge subsets represented by different technology subclasses in patent data. Hidalgo and Hausmann (Citation2009), in their analysis of product exports by country, offer an alternative measure of complexity that reflects the difficulty of mastering the capabilities required to export a particular commodity (indexed by the rarity of exports of a given type), the diversity of capabilities held by different countries and the relatedness between them. An analogy with the board game Scrabble is often used to explicate understanding of this measure. Thus, those countries (players) that have rare capabilities (letters) tend to produce more complex outputs (words), especially when those countries possess broader sets of related capabilities (a greater variety of letters that may be combined to produce many different words).
Using patent data, Balland and Rigby (Citation2017) explore the technological complexity of US metropolitan regions between 1976 and 2005. They outline an eigenvector reformulation of the method of reflections proposed by Hidalgo and Hausmann (Citation2009), that we employ below. The starting point of the knowledge complexity index is the binary-valued network that connects regions to the knowledge classes in which they have an RTA, represented as an n × k two-mode binary adjacency matrix (M). The matrix (M) has dimension n = 282 regions (NUTS-2) by k = 33 technological domains (two-digit level),Footnote6 as proposed by Schmoch (Citation2008). Following our calculations of relatedness, we divide the years for which we have patent data into six periods of five years each, and we construct the two-mode binary adjacency matrix (M) for each of the periods: 1985–89, 1990–94, 1995–99, 2000–04 and 2005–09.
To construct our index of knowledge complexity, the matrix (M) is row standardized along with its transpose (). The product matrix
is a square matrix with dimension equal to the number of technological classes (33). The technological complexity index (TCI) for each of these classes is given by the elements of the second eigenvector
of matrix (B). These elements are standardized as:
The technological classification shown in Table A1 in Appendix A in the supplemental data online corresponds to the two-digit level of IPC, and is further broken down at the three-digit level for the empirical analysis. Table A1 shows that the most complex technologies are related to digital communication, computer technology, biotechnology and semiconductors in the period 2005–09. The least complex ones belong to textiles, mechanical elements, materials and metallurgy.
RELATEDNESS, KNOWLEDGE COMPLEXITY AND DIVERSIFICATION IN EUROPEAN UNION REGIONS
This section presents the results of two econometric models that analyze: (1) the probability that a region develops a new RTA in a given technology (entry); and (2) the growth rate of technologies in regions, as measured by the growth of patents in a given technology (growth). Following the theoretical framework, the main variables of interest are relatedness density between a given technology and the overall technological portfolio of a region (i.e., proximity to existing technologies) and the knowledge complexity of technologies (i.e., potential upgrading of technological structure).
We also include control variables: (1) four variables at the regional level, i.e., population (log), GDP per capita, population density and technological stock (the total number of technological claims in a region); and (2) one variable at the technological level, i.e., technological size (the total number of technological claims of a technology). Population allows one to account for different sizes of regions. The level of economic development (GDP per capita) is an important driver of technological diversification (Petralia et al., Citation2017). We included population density as a proxy for agglomeration economies (Boschma et al., Citation2015), and technological stock as a proxy for the number of ideas that could potentially be combined in a given region or for a given technology. Table A2 in Appendix A in the supplemental data online provides summary statistics for the variables.
All specifications are estimated at the region-technology level. We use a linear probability model (LPM) to assess the probability that a region specializes in a new technological field (entry) using the following specification (a similar econometric model is used for the growth models):We expect a positive coefficient for relatedness density in both the entry model (hypothesis 1) and the growth model (hypothesis 2), and a negative coefficient for complexity in the entry model (hypothesis 3) and a positive one in the growth model (hypothesis 4). The baseline specification is a two-way fixed-effects model where
is a region fixed effect,
is a time fixed effect and
is a regression residual. Since errors are correlated within regions and technologies, the regression results presented in all regression outputs are adjusted for clustering at the region and technology level. Our panel consists of data for 282 NUTS-2 regions and 617 technologies (IPC) over the period 1985–2009. We average the data over non-overlapping five-year periods, denoted by t. To dampen potential endogeneity issues, all the independent variables are lagged by one period, denoted by t – 1.
Entry models – full sample
In all entryFootnote7 models in ,Footnote8 we find that relatedness density has a positive and significant effect on the probability that a region specializes (RTA > 1) in a new technological field, which is consistent with other findings (Balland, Citation2016; Boschma et al., Citation2015; Rigby, Citation2015). The effect of relatedness is also strong: an increase of 10% in relatedness density is associated with a 23–26% relative increase in the probability of entry.Footnote9 The effect of knowledge complexity on entry is more ambiguous. The sign for knowledge complexity is positive and significant in the simplest specification (model 2), still positive but insignificant when regional and technology controls are added (model 4), and negative and significant in the fixed-effect model (model 5). Overall, the effect is always small: when the complexity of a technology goes up by 10 points (on a scale of 0–100), the relative likelihood that a region specializes in this technology increases by 0.30% in the simplest specification and decreases by 0.35% in the fixed-effects specification. This result might indicate the ‘diversification dilemma’ mentioned above: complex knowledge is more attractive (a positive effect on entry) but at the same time also more difficult to produce (a negative effect on entry). Therefore, the relationship between knowledge complexity and new specialization is not linear and might be region specific (Petralia et al., Citation2017; Pinheiro, Alshamsi, Hartmann, Boschma, & Hidalgo, Citation2018).
Table 1. Entry models – full sample.
Entry models for high and low levels of relatedness
To investigate this further and test hypothesis 5, we split the sample between observations with high levels of relatedness and observations with a low level of relatedness. The results are presented in .
Table 2. Entry models by level of relatedness.
The main result is that the effect of complexity on entry appears to be conditional on the level of relatedness. When relatedness is high, i.e., when models include only the top 10% of region-technology observations in terms of relatedness density,Footnote10 knowledge complexity has a positive, significant impact on the development of new technologies. When the complexity of a technology goes up by 10 points, the likelihood that a region will develop this technology increases by 1.3% in the simplest specification, which is five times higher than what was found in the specifications unconditional to relatedness. In the more conservative fixed-effects specification, complexity is still positive and significant. What is interesting is that when relatedness is low, i.e., when models include only the bottom 10% of region-technology observations in terms of relatedness density, complexity never has a significant impact on the development of new technologies. What these results indicate is that relatedness conditions access to complex technologies and tends to solve the ‘diversification dilemma’: when relatedness is high, regions are more likely to diversify into complex technologies, confirming hypothesis 5.
Growth models – full sample
To investigate further the impact of technological relatedness and knowledge complexity on sustainable specializations, we now turn to technological growth models in .
Table 3. Growth models – full sample.
We find that both relatedness and complexity have a positive, strong and statistically significant impact on technological growth at the regional level, confirming hypotheses 2 and 4. This pattern holds across all econometric specifications. We find that an increase of relatedness density by 10 points is associated with an increase in technological growth by about 2.0–4.64%. In contrast to the entry models, the impact of knowledge complexity is now in the same order of magnitude. An increase in complexity by 10 points is now associated with an increase in technological growth by about 1.2–2.0%. This means that once regions manage to diversify into more complex technologies, they tend to experience higher technological growth. Apparently, the most difficult step for regions is to enter complex technological fields, but the rewards of technological upgrading seem to be fairly strong.
Growth models for high and low levels of relatedness
As for the entry models, to test hypothesis 6 we now split the sample into observations with high or low levels of relatedness. The results are presented in .
Table 4. Growth models by level of relatedness.
We find results in line with the entry models. Regions are more likely to experience technological growth if they specialize in complex technologies that are related to their capabilities, confirming hypothesis 6. When relatedness is high, i.e., when models include only the top 10% of region-technology observations in terms of relatedness density, complexity has a positive, significant impact on technological growth. When the complexity of a technology goes up by 10 points, technological growth increases by about 2.27–3.25%. When relatedness is low, however, i.e., when models include only the bottom 10% of region-technology observations in terms of relatedness density, complexity tends to have a negative impact, though it is non-significant. In the fixed-effect specification (for low complexity), the negative coefficient is statistically significant, though its impact is small (–0.3% growth for a 10-point increase). Therefore, relatedness conditions technological growth in regions, suggesting that regions need to upgrade their technological structure by building on related, pre-existing capabilities.
FRAMEWORK FOR SMART SPECIALIZATION
We now formalize the implications of these results into a framework for smart specialization. We present a framework to identify systematically technological opportunities for regions, based on the relatedness density and knowledge complexity of individual technologies. This framework reflects the fact that regions have different sets of core competences, and thus a top-down ‘one-size-fits-all’ model built around picking champions is unlikely to be successful. Instead, we offer a model for smart specialization built around relatedness that demands a bottom-up approach. This framework could be used to identify hidden technological opportunities, avoid unrealistic investments and assess how entrepreneurial discoveries that emerge from regional actors fit in the overall economic landscape of the region.
This framework is presented in . Operationalization requires identification of the knowledge base of regions to which a specific set of technological possibilities is tailored. The framework uses the relatedness measure to map technologies in which the region does not yet possess an RTA but which are relatively close to the region’s existing technology core. Relatedness measures allow precise mapping of the accessibility of new regional growth paths and thus an accounting of the costs of their deployment. An index of the relative ease with which a region might be able to develop an RTA in a new technology is defined along the x-axis. The y-axis reflects the complexity of all technologies in which the region does not have an RTA. Thus, for each region, the quadrants in the x–y space of represent the relatedness between the region’s knowledge base and each technology for which the RTA does not exist in the region, and a measure of how the development of the RTA in each of these technologies would shift the region’s overall knowledge complexity. Hausmann et al. (Citation2014) proposed a similar strategy to identify future economic opportunities for countries.
Figure 3. Framework for smart specialization.
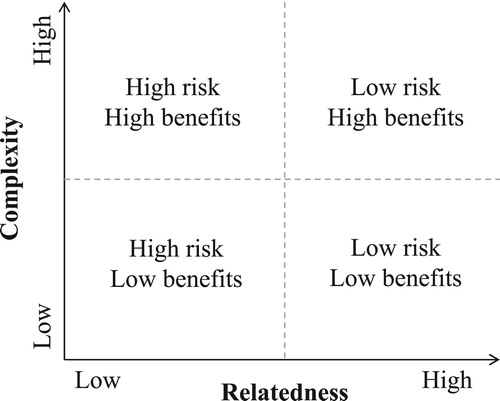
Our smart specialization policy framework () allows policy-makers to weigh the relative ease of developing a new technology in a region in relation to the gains in knowledge complexity. Technologies with high relatedness represent new technological possibilities that are closely connected to the current knowledge base of the region. These technologies might reasonably be developed at relatively low cost and thus represent a low-risk strategy for the region. Technologies with a low level of relatedness in relation to a region’s existing knowledge base represent new techniques that are distant from the region’s existing specializations and for which development is likely to be more costly, embodying greater risk. Each of these potential technology types is associated with a change in the region’s complexity or the value of the knowledge generated in the region. Potential new technologies that have high complexity are likely to add considerably to the complexity of the region and the overall value of the region’s knowledge assets, in contrast to potential new technologies with low complexity.
The four quadrants of highlight the cost–benefit trade-off that undergirds smart specialization policy. An attractive smart specialization approach is the one that supports potential technologies that occupy the north-east quadrant of , for these technologies promise above-average returns and can be developed at relatively low risk. We refer to that as the ‘high road’ policy. In contrast, a policy focus on potential technologies in the south-west quadrant represent technologies that are far removed from the existing knowledge base of the region and their development is thus risky. Alongside the risk, these technologies are unlikely to raise the complexity value of the regional knowledge base. Therefore, we refer to such a policy as a ‘dead-end’ policy. The north-west quadrant reflects a potentially high-benefit strategy, but it is not rooted in regional capabilities and therefore likely to fail due to high risks. This policy aims at developing new technologies from scratch, which we therefore refer to as a ‘casino’ policy. The fourth policy option focuses on technologies in the south-east quadrant, which reflects a relatively low-risk strategy because it builds on related capabilities. We dub this the ‘slow-road’ policy because these potential technologies offer few expected benefits.
Therefore, the core idea of the smart specialization framework is that region-specific capabilities define not only the set of opportunities to develop new growth paths but also the limits on those choices. By operationalizing this idea, we can eschew the one-size-fits-all policy model and offer place-based policy adapted to the particular conditions of regions (Tödtling & Trippl, Citation2005). In the past, regional technology policy was too often focused only on the y-axis of . Such a policy of picking winners, of building ‘cathedrals in the desert’, paid insufficient attention to whether host regions had the technological capacity to support such ventures. Balancing the dimensions of relatedness and knowledge complexity provides an evidence-based platform on which to develop smart specialization, a platform that is more attuned to region-specific capabilities and thus less likely to lead to duplication and waste of scarce public and private resources.
REGIONAL CASES TO ILLUSTRATE FURTHER THE SMART SPECIALIZATION FRAMEWORK
For illustration purposes, we apply the smart specialization framework to four types of NUTS-2 regions that can be considered representative cases (Camagni & Capello, Citation2013): a core leading region (Île-de-France), a high-tech region (Noord-Brabant, the Netherlands), an old industrial region (Lancashire, UK) and a lagging, peripheral region (Extremadura, Spain). We present the four cases in (a–d), following the same structure of , with relatedness density on the horizontal axis and knowledge complexity on the vertical axis. The nodes (circles) represent potential technologies (or new growth paths) in which the region does not exhibit an RTA in the period 2005–09. The size of the nodes represents the total number of patents in each technology class, though note that all such classes are smaller than might be expected in the regions, based on the share of patents in these classes at the European level. Colours show the one-digit classification of the technological classes. The distribution of the nodes in each figure makes clear that not all regions are in the same situation to build new growth trajectories: the size and content of the list of choices, as well as their accessibility, vary from one region to another.
Figure 4. Application of the framework: (a) Île-de-France (France, FR10); (b) Noord-Brabant (the Netherlands, NL41); (c) Lancashire (UK, UKD4); and (d) Extremadura (Spain, ES43).
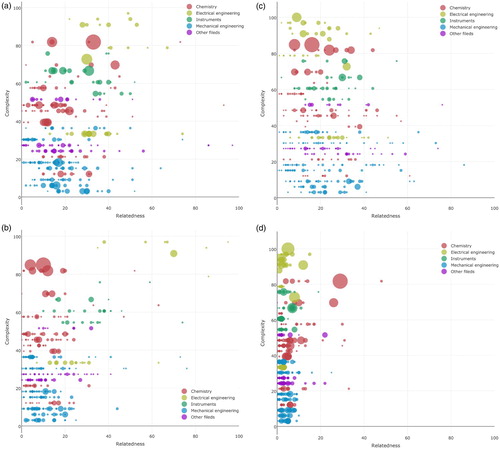
The Île-de-France is the region with most patent applications. Its diversified portfolio of activities reveals the existence of a large set of capabilities the region can rely on to branch out towards new activities. (a) shows that the Île-de-France has a relatively high relatedness with a large number of technologies in which it is not specialized, many belonging to fields such as electrical engineering and chemistry which are already established in the region, and to a lesser extent to mechanical engineering and instruments. Thus, the Île-de-France has a wide range of options to diversify at relatively low risk. They involve both high- and low-complexity technologies, making the second criterion of our framework relevant when choosing the direction by discriminating among the low-risk alternatives. Since more complex technologies tend to have higher upgrading and growth potential, the Île-de-France could easily implement a ‘high-road’ smart specialization policy that targets the development of potential technologies in the north-east quadrant.
Noord-Brabant is a typical high-tech region, located around Eindhoven, the Netherlands. In spite of its relatively small size, the region ranked as one of the top 10 most innovative regions in the EU. (b) shows the technologies in which Noord-Brabant could diversify by redeploying its existing capabilities. The menu of potential low-risk paths is less rich and more limited than for the Île-de-France, i.e., the number of potential technologies with relatively high relatedness is smaller. While for the Île-de-France the low-risk options are in high- and low-complexity technologies, in Noord-Brabant they tend to be concentrated in high-complexity technologies (such as communication) in the electrical engineering domain. Investing in other complex technology domains such as chemistry (in the north-west quadrant) would imply a radical diversification strategy that is very risky, given the current, relatively specialized, technological structure of the Noord-Brabant economy.
Lancashire, in the north-west of England, is a typical case of an old industrial region. Its patenting activity is far below the EU average, and less diversified than the previous two cases. (c) shows that Lancashire, as Noord-Brabant, has many diversification options related to existing technologies. From the complexity angle, however, the story is different. Almost all potential technologies in Lancashire are closely related to low-complexity domains mostly in mechanical engineering, while complex domains, with high-growth potential, are difficult to access given the current strengths of the region. Thus, for Lancashire, there are no low-risk–high-benefit smart specialization options. Targeting most electrical engineering technologies might reflect a ‘casino’ policy, while policy focus on most mechanical engineering technologies comes down to a ‘slow-road’ approach. A smart specialization approach for Lancashire could target technologies that are relatively complex (upgrading its local economy), but still related to existing capabilities, such as some instruments and a few chemical technologies in the centre of the graph.
Finally, Extremadura, in western Spain, is a typical peripheral region with a weak technological base ((d)). This severely limits the ability of the region to develop new growth paths. In the terminology of our framework, the region has many policy options in the high-risk quadrants, with both high- and low-expected benefits, but none in the low-risk quadrants, because most missing technologies show low relatedness. Peripheral regions provide one of the most complicated cases to build an effective smart specialization policy, which is also echoed in writings on smart specialization policy (Foray, Citation2015; Morgan, Citation2015). Extremadura could go for a ‘casino’ strategy focusing on complex technologies because the expected benefits are higher. However, complex technologies require a large set of capabilities that makes such successful long jumps for peripheral regions near to impossible. In our framework, every region can find a smart specialization policy by adjusting its ambitions to the local economic context. In the case of Extremadura, the subset of chemical technologies can be a reasonable starting point to accumulate knowledge and capabilities that can further be redeployed into increasingly complex technologies.
DISCUSSION AND CONCLUSIONS
This paper has attempted to tackle the perceived lack of a strong theoretical and empirical foundation for smart specialization policy in Europe. First, it constructed a theoretical framework for smart specialization built around the concepts of relatedness and knowledge complexity. Second, it operationalized this framework empirically by calculating relatedness between technologies using EPO patent data and measuring the knowledge complexity of technologies using network-based techniques. Third, it used these measures to provide new evidence on how EU regions develop new technologies. We find that relatedness has a positive effect on technological diversification within regions. Diversifying into complex technologies is difficult for many regions, though it is easier when such technologies are more closely related to the existing knowledge core of the region. And regions tend to grow more if they specialize in complex technologies related to existing technologies in the region.
Based on these theoretical and empirical underpinnings, we proposed a policy framework for smart specialization that highlights the potential risks and rewards for regions of adopting alternative diversification strategies. We showed how potential risks of smart specialization may be assessed using the concept of relatedness, and how potential benefits can be derived from estimates of the complexity of technologies. Our policy framework incorporates the key logic of smart specialization, that is, a bottom-up policy approach based on the idea that regions should leverage their existing capabilities to develop and secure comparative advantage in related high-value-added activities. We underlined further the relevance of such a policy framework and the need for a region-specific focus by identifying the diversification opportunities in different types of regions.
Although this paper provides some important pieces to the puzzle of smart specialization, we are still far from a comprehensive framework. We have not focused on the design and implementation of smart specialization policy, and what exact role public agents need to play (Capello & Kroll, Citation2016; Iacobucci, Citation2014; Kroll, Citation2015; Matti, Consoli, & Uyarra, Citation2017; Moodysson, Trippl, & Zukauskaite, Citation2016; Valdaliso, Magro, Navarro, Aranguren, & Wilson, Citation2014). Moreover, our framework focuses primarily on the supply side, and less so on the demand side (such as internal or external demand, and market access), at least not explicitly (Montresor & Quatraro, Citation2017; Tanner, Citation2014). We now discuss some other important issues that still need to be tackled.
This paper has focused on technological knowledge, and only that part of knowledge embodied in patent activity. It is crucial to emphasize that smart specialization policy is about diversifying from regional capabilities in general, not only from knowledge captured by patents. The proposed smart specialization policy framework could and should, therefore, assess diversification options for regions that include other forms of knowledge and capabilities not captured by patents, such as products, industries, scientific disciplines and jobs (Cortinovis, Xiao, Boschma, & van Oort, Citation2017; Unterlass et al., Citation2015). It could also be applied to tacit and symbolic forms of knowledge through targeted educational programmes and college degrees. This is especially important for bringing smart specialization policy more in line with the objective of Cohesion Policy that aims at reducing disparities between EU regions, and which has repeatedly been mentioned as one of the key challenges in EU regional innovation policy (McCann & Ortega-Argilés, Citation2013, Citation2015; Morgan, Citation2015). This is because non-technological knowledge (of both high and low complexity) also provides diversification opportunities for regions, especially in the more peripheral parts of the EU (Asheim, Boschma, & Cooke, Citation2011).
We need to think more deeply about how to tackle the inherent tension within smart specialization policy between prioritizing and selecting activities based on regional potentials (as in the proposed framework), on the one hand, and reliance on the entrepreneurial discovery process in which this selection process is completely decentralized, bottom-up and process-led, on the other hand (Coffano & Foray, Citation2014). One potential way to solve this tension is, first, to identify diversification opportunities in each region based on their scores on relatedness and complexity, after which, within that range of opportunities, the entrepreneurial discovery process will unfold, in which a range of local actors will decide which activities to target and assist (Boschma & Gianelle, Citation2013). Or the other way around, a range of activities will first be selected through the entrepreneurial discovery process, which are then assessed within the diversification opportunities of each region identified by our framework.
Our smart specialization framework still has to be framed in relation to territorial terms (Iacobucci & Guzzini, Citation2016; Sörvik, Midtkandal, Marzocchi, & Uyarra, Citation2016; Thissen, van Oort, Diodato, & Ruijs, Citation2013) to account for non-local linkages to avoid regional lock-in (Bathelt et al., Citation2004), as these give regions access to complementary capabilities elsewhere (Miguelez & Moreno, Citation2017; Tavassoli & Carbonara, Citation2014). One example is the recent focus on trade networks and value chains and how to incorporate these into smart specialization strategies (Radosevic & Ciampi Stankova, Citation2015). Another challenge is how smart specialization policy can assist in linking peripheral regions to the outside world to compensate for lack of local capabilities (Fitjar & Rodríguez-Pose, Citation2011; Grillitsch & Nilsson, Citation2015). And we need to think how smart specialization policy can incorporate the crucial importance of inflows of skilled labour for related diversification and structural change in regions (Neffke, Hartog, Boschma, & Henning, Citation2018).
Another building block of smart specialization policy is the need for the right institutional governance structure to be in place at the local level (Grillitsch, Citation2016; McCann, van Oort, & Goddard, Citation2017; Morgan, Citation2017). When the quality of institutional governance differs greatly between regions, as it does in Europe (Rodríguez-Pose, di Cataldo, & Rainoldi, Citation2014), it is also likely to affect their ability to move into new and more complex technologies. This might require a local institutional context (governance, social capital) that facilitates the coordination and combination of a wide range of capabilities (Cortinovis et al., Citation2017). Especially, peripheral regions suffer from institutional weaknesses that might limit smart specialization strategy (Karo & Kattel, Citation2015; Rodríguez-Pose & Wilkie, Citation2015), such as a traditional approach to governance (no experimentation culture), weak administrative capabilities, a low quality of government, tight connections with local vested players, weak entrepreneurial capacities and the absence of a local culture of collaboration.
Lastly, there is an ongoing discussion whether smart specialization policy should focus on disruptive activities, as echoed in recent pleas for mission-oriented policies such as curing cancer or greening the economy (Frenken, Citation2016; Mazzucato, Citation2013). While there is little understanding about how mission-oriented policies should actually be designed (except for setting specific targets and directions for future development), our framework shows how risky such demand-led policy targeting very complex and unknown technologies will be when formulated and implemented without embedding it in the appropriate technological and institutional context in countries and regions. When ignoring that, it is not difficult to foresee that such mission-oriented policies will fall into the same traps that smart specialization policy aims to avoid, such as picking fashionable activities from scratch, and duplicating major research and innovation investments. This is not to deny the fact that public policy can play a key role in initiating transformative change when fundamental uncertainty is the rule, but only when embedded in an appropriate territorial context (Boschma, Citation2017; Montresor & Quatraro, Citation2017; Uhlbach, Balland, & Scherngell, Citation2017; Unterlass et al., Citation2015). Our proposed framework may be instrumental to make such informed choices.
Supplemental data.pdf
Download PDF (55 KB)ACKNOWLEDGEMENTS
The authors thank Christopher Esposito and Wolf-Hendrik Uhlbach for their excellent research assistance.
DISCLOSURE STATEMENT
No potential conflict of interest was reported by the authors.
ORCID
Pierre-Alexandre Balland http://orcid.org/0000-0003-2787-4376
Joan Crespo http://orcid.org/0000-0003-4053-8158
Additional information
Funding
Notes
1. September 2015 Edition. OECD = Organisation for Economic Co-operation and Development.
2. Fractional counts cleaned by inpadoc families of PATSTAT. NUTS = Nomenclature of Territorial Units for Statistics.
3. In this paper we used EconGeo, version 1.3 (see https://github.com/PABalland/EconGeo).
4. Source: WIPO IPC Technology Concordance Table.
5. Our notion of relatedness is inspired by the related variety literature (Frenken et al., Citation2007), but we apply it to the topic of regional (related) diversification, instead of regional growth. Some papers on (related) diversification have used related variety as an explanatory factor for diversification in regions (e.g., Xiao, Boschma, & Andersson, Citation2018). However, a positive correlation between related variety and the entry of new technologies at the regional level does not necessarily imply that the new technologies are related to existing regional technologies, as measured by related variety. Therefore, we make use of relatedness density, as this indicator measures directly the degree of relatedness between existing technologies in the region and missing technologies in the region.
6. The two-mode network used to compute complexity is based on the two-digit technological domains and not IPC classes because of the high size heterogeneity of IPC classes. In fact, using IPC classes as nodes in the region–technology network would lead to a noisy complexity estimation because some IPC classes are very small (fewer than 20 patent applications a year), while others are very large (more than 3000 patent applications a year). Using the broader and more homogenous classification proposed by Schmoch (Citation2008) allows one to circumvent this problem. The EU complexity ranking is consistent with that in the United States described by Balland and Rigby (Citation2017). As a robustness check, we also computed complexity using the model proposed by Fleming and Sorenson (Citation2001) and found no major differences.
7. In the entry models, we cannot distinguish between diversification induced by new or existing firms, by small or big firms, or by local or non-local firms because firm-level data are not available. See Neffke et al. (Citation2018) for such a firm-level analysis of regional diversification.
8. The control variables GDP per capita, population and technological size have a positive and significant impact on technological entry in most models, while the regional technological stock and population density tend to have a negative and significant impact.
9. In the baseline model 1, for instance, the unconditional probability of entry is around 16% (as all independent variables are mean centred, the constant is equal to the unconditional probability of entry = 0.1632872). An increase by 10% in relatedness density (relatedness density ranges from 0 to 100%) increases the relative probability of entry by (0.0042477*10)/0.1632872 = 26%. In the most conservative model (fixed effect, model 5), we find an increase in the relative probability of entry of about (0.0037696*10)/0.1639320 = 23%. The intercept in a fixed-effect model cannot be interpreted as the unconditional probability of entry by definition. The unconditional probability of entry for this model can be found as the intercept of model 4.
10. Therefore, relatedness density is excluded from this model.
Related Research Data
REFERENCES
- Abernathy, W. J., & Clark, K. B. (1985). Innovation: Mapping the winds of creative destruction. Research Policy, 14(1), 3–22. doi: 10.1016/0048-7333(85)90021-6
- Asheim, B., Boschma, R., & Cooke, P. (2011). Constructing regional advantage: Platform policies based on related variety and differentiated knowledge bases. Regional Studies, 45(7), 893–904. doi: 10.1080/00343404.2010.543126
- Asheim, B., Grillitsch, M., & Trippl, M. (2016). Smart specialization as an innovation-driven strategy for economic diversification: Examples from Scandinavian regions (Papers in Innovation Studies No. 2016/23) (pp. 73–97). Lund: Centre for Innovation, Research and Competence in the Learning Economy (CIRCLE), Lund University.
- Asheim, B. T., & Gertler, M. S. (2005). The geography of innovation: Regional innovation systems. In J. Fagerberg, D. C. Mowery, & R. R. Nelson (Eds.), The Oxford handbook of innovation (pp. 291–317). Oxford: Oxford University Press.
- Atkinson, A. B., & Stiglitz, J. E. (1969). A new view of technological change. Economic Journal, 79, 573–578. doi: 10.2307/2230384
- Balland, P. A. (2016). Relatedness and the geography of innovation. In R. Shearmur, C. Carrincazeaux, & D. Doloreux (Eds.), Handbook on the geographies of innovation (pp. 127–141). Northampton: Edward Elgar.
- Balland, P. A. (2017). EconGeo: Computing key indicators of the spatial distribution of economic activities, R package version 1.3. Retrieved from https://github.com/PABalland/EconGeo
- Balland, P. A., & Rigby, D. (2017). The geography of complex knowledge. Economic Geography, 93(1), 1–23. doi: 10.1080/00130095.2016.1205947
- Balland, P. A., Rigby, D., & Boschma, R. (2015). The technological resilience of U.S. cities. Cambridge Journal of Regions, Economy and Society, 8(2), 167–184. doi: 10.1093/cjres/rsv007
- Barca, F. (2009). An agenda for a reformed Cohesion Policy: A place-based approach to meeting European Union challenges and expectations (Independent report prepared at the request of the European Commissioner for Regional Policy, Danuta Hübner). Brussels: European Commission.
- Bathelt, H., Malmberg, A., & Maskell, P. (2004). Clusters and knowledge: Local buzz, global pipelines and the process of knowledge creation. Progress in Human Geography, 28, 31–56. doi: 10.1191/0309132504ph469oa
- Boschma, R. (2014). Constructing regional advantage and smart specialisation: Comparison of two European policy concepts. Italian Journal of Regional Science, 13(1), 51–68. doi: 10.3280/SCRE2014-001004
- Boschma, R. (2017). Relatedness as driver of regional diversification: A research agenda. Regional Studies, 51(3), 351–364. doi: 10.1080/00343404.2016.1254767
- Boschma, R., Balland, P. A., & Kogler, D. (2015). Relatedness and technological change in cities: The rise and fall of technological knowledge in US metropolitan areas from 1981 to 2010. Industrial and Corporate Change, 24(1), 223–250. doi: 10.1093/icc/dtu012
- Boschma, R., & Gianelle, C. (2013). Regional branching and smart specialization policy (Policy Note November 2013). Seville: Institute for Prospective Technological Studies (IPTS).
- Breschi, S., Lissoni, F., & Malerba, F. (2003). Knowledge-relatedness in firm technological diversification. Research Policy, 32(1), 69–87. doi: 10.1016/S0048-7333(02)00004-5
- Camagni, R., & Capello, R. (2013). Regional innovation patterns and the EU regional policy reform: Toward smart innovation policies. Growth and Change, 44(2), 355–389. doi: 10.1111/grow.12012
- Capello, R., & Kroll, H. (2016). From theory to practice in smart specialization strategy: Emerging limits and possible future trajectories. European Planning Studies, 24(8), 1393–1406. doi: 10.1080/09654313.2016.1156058
- Castaldi, C., Frenken, K., & Los, B. (2015). Related variety, unrelated variety and technological breakthroughs: An analysis of US state-level patenting. Regional Studies, 49(5), 767–781. doi: 10.1080/00343404.2014.940305
- Chatterjee, S., & Wernerfelt, B. (1991). The link between resources and type of diversification: Theory and evidence. Strategic Management Journal, 12(1), 33–48. doi: 10.1002/smj.4250120104
- Coffano, M., & Foray, D. (2014). The centrality of entrepreneurial discovery in building and implementing a smart specialisation strategy. Italian Journal of Regional Science, 13, 33–50. doi: 10.3280/SCRE2014-001003
- Cortinovis, N., Xiao, J., Boschma, R., & van Oort, F. (2017). Quality of government and social capital as drivers of regional diversification in Europe. Journal of Economic Geography, 17, 1179–1208. doi.org/10.1093/jeg/lbx001
- Dosi, G. (1982). Technological paradigms and technological trajectories: As suggested interpretation of the determinants and directions of technical change. Research Policy, 11(3), 147–162. doi: 10.1016/0048-7333(82)90016-6
- Essletzbichler, J. (2015). Relatedness, industrial branching and technological cohesion in US metropolitan areas. Regional Studies, 49, 752–766. doi: 10.1080/00343404.2013.806793
- Fitjar, R. D., & Rodríguez-Pose, A. (2011). When local interaction does not suffice: Sources of firm innovation in urban Norway. Environment and Planning A, 43(6), 1248–1267. doi: 10.1068/a43516
- Fleming, L., & Sorenson, O. (2001). Technology as a complex adaptive system: Evidence from patent data. Research Policy, 30, 1019–1039. doi: 10.1016/S0048-7333(00)00135-9
- Foray, D. (2015). Smart specialization: Opportunities and challenges for regional innovation policy. London: Routledge/Regional Studies Association.
- Foray, D., David, P. A., & Hall, B. H. (2009). Smart specialization. The concept (Knowledge Economists Policy Brief No. 9, June). Brussels: European Commission.
- Foray, D., David, P. A., & Hall, B. H. (2011). Smart specialization. From academic idea to political instrument, the surprising career of a concept and the difficulties involved in its implementation (MTEI Working Paper, November). Lausanne: MTEI.
- Foray, D., Goddard, J., Morgan, K., Goenaga Beldarrain, X., Landabaso, M., Nauwelaers, C., & Ortega-Argilés, R. (2012). Guide to research and innovation strategies for smart specialisation (RIS 3), S3 smart specialisation platform. Seville: Institute for Prospective Technological Studies (IPTS)-Joint Research Centre (JRC) of the European Commission.
- Frenken, K. (2016). A complexity-theoretic perspective on innovation policy (Papers in Evolutionary Economic Geography No. 16.19). Utrecht: Department of Economic Geography, University of Utrecht.
- Frenken, K., & Boschma, R. A. (2007). A theoretical framework for evolutionary economic geography: Industrial dynamics and urban growth as a branching process. Journal of Economic Geography, 7(5), 635–649. doi: 10.1093/jeg/lbm018
- Frenken, K., Van Oort, F. G., & Verburg, T. (2007). Related variety, unrelated variety and regional economic growth. Regional Studies, 41(5), 685–697. doi: 10.1080/00343400601120296
- Grillitsch, M. (2016). Institutions, smart specialisation dynamics and policy. Environment and Planning C: Government and Policy, 34, 22–37. doi: 10.1177/0263774X15614694
- Grillitsch, M., & Nilsson, M. (2015). Innovation in peripheral regions: Do collaborations compensate for a lack of local knowledge spillovers? Annals of Regional Science, 54(1), 299–321. doi: 10.1007/s00168-014-0655-8
- Harhoff, D., Scherer, F., & Vopel, K. (2003). Citations, family size, opposition and the value of patent rights – Evidence from Germany. Research Policy, 32, 1343–1363. doi: 10.1016/S0048-7333(02)00124-5
- Hausmann, R., Hidalgo, C. A., Bustos, S., Coscia, M., Simoes, A., & Yildirim, M. A. (2014). The atlas of economic complexity: Mapping paths to prosperity. Cambridge, MA: MIT Press.
- Heimeriks, G., & Balland, P. A. (2016). How smart is specialisation? An analysis of specialisation patterns in knowledge production. Science and Public Policy, 43(4), 562–574. doi: 10.1093/scipol/scv061
- Hidalgo, C., & Hausmann, R. (2009). The building blocks of economic complexity. Proceedings of the National Academy of Sciences, 106, 10570–10575. doi: 10.1073/pnas.0900943106
- Hidalgo, C., Klinger, B., Barabassi, A., & Hausmann, R. (2007). The product space conditions the development of nations. Science, 317, 482–487. doi: 10.1126/science.1144581
- Iacobucci, D. (2014). Designing and implementing a smart specialisation strategy at regional level: Some open questions. Italian Journal of Regional Science, 13, 107–126. doi: 10.3280/SCRE2014-001006
- Iacobucci, D., & Guzzini, E. (2016). Relatedness and connectivity in technological domains: Missing links in S3 design and implementation. European Planning Studies, 24(8), 1511–1526. doi: 10.1080/09654313.2016.1170108
- Karo, E., & Kattel, R. (2015). Economic development and evolving state capacities in Central and Eastern Europe: can ‘smart specialization’ make a difference? Journal of Economic Policy Reform, 18(2), 172–187. doi: 10.1080/17487870.2015.1009068
- Kogut, B., & Zander, U. (1992). Knowledge of the firm, combinative capabilities, and the replication of technology. Organization Science, 3, 383–397. doi: 10.1287/orsc.3.3.383
- Kogut, B., & Zander, U. (1993). Knowledge of the firm and the evolutionary theory of the multinational corporation. Journal of International Business Studies, 24, 625–645. doi: 10.1057/palgrave.jibs.8490248
- Kroll, H. (2015). Efforts to implement smart specialization in practice – Leading unlike horses to the water. European Planning Studies, 23(10), 2079–2098. doi: 10.1080/09654313.2014.1003036
- Lawson, C., & Lorenz, E. (1999). Collective learning, tacit knowledge and regional innovative capacity. Regional Studies, 33, 305–317. doi: 10.1080/713693555
- Maskell, P., & Malmberg, A. (1999). Localised learning and industrial competitiveness. Cambridge Journal of Economics, 23(2), 167–186. doi: 10.1093/cje/23.2.167
- Matti, C., Consoli, D., & Uyarra, E. (2017). Multilevel policy mixes and industry emergence. The case of wind energy in Spain. Environment and Planning C, 35(4), 661–683.
- Mazzucato, M. (2013). The entrepreneurial state, debunking public vs. Private sector myths. London: Anthern.
- McCann, P., & Ortega-Argilés, R. (2013). Transforming European regional policy: A results-driven agenda and smart specialization. Oxford Review of Economic Policy, 29(2), 405–431. doi: 10.1093/oxrep/grt021
- McCann, P., & Ortega-Argilés, R. (2015). Smart specialization, regional growth and applications to European Union Cohesion Policy. Regional Studies, 49(8), 1291–1302. doi: 10.1080/00343404.2013.799769
- McCann, P., van Oort, F., & Goddard, J. (Eds.). (2017). The empirical and institutional dimensions of smart specialisation. Abingdon: Routledge.
- Miguelez, E., & R. Moreno. (2017). Relatedness, external linkages and regional innovation in Europe. Regional Studies. doi: 10.1080/00343404.2017.1360478
- Montresor, F., & Quatraro, F. (2017). Regional branching and Key enabling technologies: Evidence from European patent data. Economic Geography, 93(4), 367–396. doi: 10.1080/00130095.2017.1326810
- Moodysson, J., M. Trippl, & E. Zukauskaite. (2016). Policy learning and smart specialization: Balancing policy change and continuity for new regional industrial paths. Science and Public Policy, 44, 382–391. doi: 10.1093/scipol/scw071
- Morgan, K. (2015). Smart specialisation: Opportunities and challenges for regional innovation policy. Regional Studies, 49(3), 480–482. doi: 10.1080/00343404.2015.1007572
- Morgan, K. J. (2017). Nurturing novelty: Regional innovation policy in the age of smart specialisation. Environment and Planning C, 35(4), 569–583.
- Neffke, F., Hartog, M., Boschma, R., & Henning, M. (2018). Agents of structural change. The role of firms and entrepreneurs in regional diversification. Economic Geography, 94, 23–48. doi: 10.1080/00130095.2017.1391691
- Neffke, F., Henning, M., & Boschma, R. (2011). How do regions diversify over time? Industry relatedness and the development of new growth paths in regions. Economic Geography, 87(3), 237–265. doi: 10.1111/j.1944-8287.2011.01121.x
- Petralia, S., Balland, P. A., & Morrison, A. (2017). Climbing the ladder of technological development. Research Policy, 46(5), 956–969. doi: 10.1016/j.respol.2017.03.012
- Pinheiro, F. L., Alshamsi, A., Hartmann, D., Boschma, R., & Hidalgo, C. (2018). Shooting low or high: Do countries benefit from entering unrelated activities? (Papers in Evolutionary Economic Geography No. 18.07). Utrecht: Utrecht University.
- Radosevic, S., & Ciampi Stankova, K. (2015). External dimensions of smart specialization. Opportunities and challenges for trans-regional and transnational collaboration in the EU-13 (Joint Research Centre S3 Working Paper Series No. JRC96030). Luxembourg: Publications Office of the European Union.
- Rigby, D. (2015). Technological relatedness and knowledge space: Entry and exit of US cities from patent classes. Regional Studies, 49(11), 1922–1937. doi: 10.1080/00343404.2013.854878
- Rigby, D. L., & Essletzbichler, J. (1997). Evolution, process variety, and regional trajectories of technological change in U.S. manufacturing. Economic Geography, 73(3), 269–284. doi: 10.2307/144484
- Rodríguez-Pose, A., di Cataldo, M., & A. Rainoldi. (2014). The role of government institutions for smart specialisation and regional development (S3 Policy Brief Series No. 4). Luxembourg: Publications Office of the European Union. doi: 10.2791/71842
- Rodríguez-Pose, A., & Wilkie, C. (2015). Institutions and the entrepreneurial discovery process for smart specialization (Papers in Evolutionary Economic Geography No. 15.23). Utrecht: Utrecht University.
- Santoalha, A. (2016). New indicators of smart specialisation. A related diversification approach applied to European regions (TIK Working Papers on Innovation Studies No. 20161220). Oslo: University of Oslo.
- Schmoch, U. (2008). Concept of a technology classification for country comparisons (Final report to the World Intellectual Property Organisation – WIPO).
- Simon, H. A. (1962). The architecture of complexity. Proceedings of the American Philosophical Society, 106, 467–482.
- Sorenson, O., Rivkin, J., & Fleming, L. (2006). Complexity, networks and knowledge flow. Research Policy, 35(7), 994–1017. doi: 10.1016/j.respol.2006.05.002
- Sörvik, J., Midtkandal, I., Marzocchi, C., & E. Uyarra. (2016). How outward looking is smart specialization? Results from a survey on inter-regional collaboration in smart specialisation strategies (S3 Policy Brief Series No. 16/2016, EUR 27795 EN). Luxembourg: Publications Office of the European Union. doi: 10.2791/943671
- Steijn, M. P. A. (2017). Improvement on the association strength: implementing probability measures based on combinations without repetition (Working Paper). Utrecht: Utrecht University.
- Storper, M. (1997). The regional world. Territorial development in a global economy. New York: Guilford.
- Tanner, A. N. (2014). Regional branching reconsidered: Emergence of the fuel cell industry in European regions. Economic Geography, 90(4), 403–427. doi: 10.1111/ecge.12055
- Tavassoli, S., & Carbonara, N. (2014). The role of knowledge variety and intensity for regional innovation. Small Business Economics, 43, 493–509. doi: 10.1007/s11187-014-9547-7
- Thissen, M., van Oort, F., Diodato, D., & Ruijs, A. (2013). Regional competitiveness and smart specialization in Europe. Place-based development in international economic networks. Cheltenham: Edward Elgar.
- Tödtling, F., & Trippl, M. (2005). One size fits all? Towards a differentiated regional innovation policy approach. Research Policy, 34(8), 1203–1219. doi: 10.1016/j.respol.2005.01.018
- Trajtenberg, M. (1990). A penny for your quotes: Patent citations and the value of innovations. RAND Journal of Economics, 21, 172–187. doi: 10.2307/2555502
- Uhlbach, W. H., Balland, P. A., & Scherngell, T. (2017). R&D policy and technological trajectories of regions: Evidence from the EU framework programmes (Papers in Evolutionary Economic Geography No. 17.22). Utrecht: Utrecht University.
- Unterlass, F., Reinstaller, A., Friesenbichler, K. S., Charos, A., Hranyai, K., Reschenhofer, P., … Weingärtner, S. (2015). The relationship between export and technological specialisation profiles across EU countries and regions and the identification of development potentials (Research Report). Vienna: Austrian Institute of Economic Research (WIFO).
- Valdaliso, J. M., Magro, E., Navarro, M., Aranguren, M. J., & Wilson, J. R. (2014). Path dependence in policies supporting smart specialisation strategies: Insights from the Basque case. European Journal of Innovation Management, 17(4), 390–408. doi: 10.1108/EJIM-12-2013-0136
- Van Eck, N. J., & Waltman, L. (2009). How to normalize cooccurrence data? An analysis of some well-known similarity measures. Journal of the American Society for Information Science and Technology, 8, 1635–1651.
- Webber, M., Sheppard, E., & Rigby, D. (1992). Forms of technical change. Environment and Planning A, 24, 1679–1709. doi: 10.1068/a241679
- Weitzman, M. L. (1998). Recombinant growth. Quarterly Journal of Economics, 113(2), 331–360. doi: 10.1162/003355398555595
- Xiao, J., R. Boschma, & M. Andersson. (2018). Resilience in the European Union: The effect of the 2008 crisis on the ability of regions in Europe to develop new industrial specializations. Industrial and Corporate Change, 27, 15–47. doi: 10.1093/icc/dtx023