
 ?Mathematical formulae have been encoded as MathML and are displayed in this HTML version using MathJax in order to improve their display. Uncheck the box to turn MathJax off. This feature requires Javascript. Click on a formula to zoom.
ABSTRACT
This paper evaluates a programme of subsidies for collaborative industrial research (co-)funded by the European Union’s Cohesion Policy in Italy mobilizing over €1 billion. In the 2007–13 funding cycle, the programme was a precursor to some of the key features of Smart Specialisation Strategy (S3) programmes, offering evidence-based insights into potential challenges of the practical application of the S3 approach. The programme was unsuccessful in boosting investments, value added or employment of beneficiary firms. The collaborative dimension of the projects added limited value and a more generous funding level would not have improved effectiveness. However, positive impacts emerged in low-tech sectors.
INTRODUCTION
The Smart Specialisation Strategy (S3) is a novel approach to the design and implementation of innovation policies. The Smart Specialisation concept emerged from the Knowledge for Growth expert group in the framework of the European Research Area (ERA) (Foray, David, & Hall, Citation2009) as a means to explain the productivity gap between Europe and the United States in terms of the differential penetration of information and communication technologies (ICT) in the two continents. According to Foray, David, and Hall (Citation2011), Smart Specialisation is ‘largely about the policy process to select and prioritize fields or areas where a cluster of activities should be developed, and to let entrepreneurs discover the right domains of future specialisation’ (p. 7). The S3 approach advocates the concentration of public resources in a set of clearly defined predetermined priority areas to be selected with a bottom-up approach based on a process of ‘entrepreneurial discovery’Footnote1 involving all relevant local stakeholders that should cooperate to elaborate the best possible innovation strategy for their own developmental future. In this framework, each individual locality is supposed to embark on ‘a rigorous self-assessment of [its] knowledge assets, capabilities and competences and the key players between whom knowledge is transferred’ (McCann & Ortega-Argilés, Citation2015, p. 3).
Despite being a recent concept with limited theoretical elaboration, supporting evidence and applications, the new approach proved an unprecedented success in the European political market. Presented by the Foray group in 2009, it already became a cornerstone of European Union (EU) policies in 2013 when the final deal on the 2014–20 programming period was agreed. Smart Specialisation is now a key component of the EU 2020 Innovation Plan as well as the reformed EU Cohesion Policy, shaping both innovation and regional development policies of the EU. As a result, the Smart Specialisation approach is currently being deployed in all countries and regions of the EU, representing a potentially unprecedented shift from pre-existing innovation policies.
The evolution of EU innovation and Cohesion Policies towards a Smart Specialisation approach was so rapid that it did not allow much room for small-scale trialling of programmes inspired by the proposed paradigm or for policy learning before large-scale implementation. Therefore, the new practices and procedures established in the 2014–20 programming period lack a solid evidence basis on their effectiveness and value added (e.g., in comparison with pre-existing policies) and suffer from a limited understanding of what works (and what does not) in practice and in different contexts. While the ex-ante characteristics of the S3 strategies elaborated by the EU regions in compliance with the new policy framework have been widely analyzed, it is still too early to develop any ex-post evaluation of their (intended and unintended) impacts. Expenditure data for the 2014–20 period are currently available only at the programme level, with no information on beneficiaries and applicants.Footnote2 Conversely, crucial decisions are now forthcoming on: (1) how to maximize the impact of ongoing S3 programmes; and (2) how to shape post-2020 EU strategies in this area. In this context, the analysis of the functioning and impact of ‘forerunner programmes’ can provide useful insights to inform an evidence-based debate on both fronts.
This paper exploits as an ‘experimental field’ the unique features of a large innovation programme implemented in Italy with the support of the EU Cohesion Policy during the programming cycle 2007–13: the Collaborative Industrial Research (CIR) Programme. The CIR was designed to support industrial research in less developed Italian regions (the ‘Mezzogiorno’) and it acted as a forerunner to many of the practical features later introduced in S3 programmes over the 2014–20 cycle. In particular: (1) funding (approximately €1 billion) was distributed to beneficiaries according to local demand for innovation activities; (2) the programme funded only specific, preselected and highly innovative (‘smart’) sectors; (3) it aimed at stimulating collaboration among firms and between firms and universities; and (4) both the selection of the projects to be financed (assessed by independent committees) and their monitoring during implementation needed to meet stringent transparency criteria. Thanks to the scoring system that assigned CIR funding to individual applicant firms, it is possible to assess the impact of the programme by means of state-of-the-art counterfactual methods. In particular, we compare firm performance within a bandwidth of the scoring threshold using regression discontinuity design (RDD) techniques. We evaluate the impact of the programme in terms of first-order effects on investments and second-order effects on value added and employment. We also analyze the extent to which some ‘S3-style’ features of this programme influenced effectiveness. Finally, we provide far-from-the-threshold inference and predict what would have happened if firms with scores below the funding threshold (and therefore not funded) would have gained access to the scheme by virtue of a more generous funding of the programme.
The empirical results offer helpful insights into how to maximize the impacts of similar programmes inspired by the S3 strategy. The CIR did not produce any impact on the performance of the beneficiary firms in terms of investments, value added and employment. The results suggest that a more (or less) generous level of funding of the programme would have not improved its effectiveness. The findings offer limited support for the practical benefits from the collaborative dimension of the projects or for the inclusion of research centres in the project partnerships. Conversely, the programme was more successful in supporting firms in low-tech sectors, suggesting that these might be viable targets for well-balanced S3 programmes. Finally, the effectiveness of the scheme on value added (investment) is higher (lower) for firms with high patenting capacity, while there seems to be scant support for the idea that multinational corporations are key to successful innovative collaborations.
IMPLEMENTATION OF THE SMART SPECIALISATION STRATEGY (S3): KEY KNOWLEDGE GAPS
The Lisbon Agenda presented the generation of new (technological) knowledge as key to productivity and economic growth by increasing total EU research and development (R&D) investments to 3% of EU gross domestic product (GDP) by 2010. However, both the 2003 Sapir Report and the 2005 Mid-term review of the Lisbon Strategy highlighted the fundamental failure to achieve the proposed targets by means of a strategy exclusively focused on R&D. The Knowledge for Growth expert group (advising the European Commissioner for Research) seemed to provide a new solution to an ‘old’ EU problem: ‘Smart Specialisation’ as a means to ‘address the grand challenge’ (Foray et al., Citation2009). ‘A more promising strategy appears to be to encourage investment in programmes that will complement the country’s other productive assets to create future domestic capability and interregional comparative advantage. We have termed this strategy “smart specialisation”’ (p. 20). Smart Specialisation strategies posit that entrepreneurs should be supported in their search for the most promising technological sector so as to target their investments better. Smart Specialisation is one of the key pillars of the EU 2020 strategy, aiming to promote a smart, sustainable and inclusive economy delivering high levels of employment, productivity and social cohesion. In particular the Smart Specialisation pillar includes three ‘flagship’ initiatives largely reflecting the priorities of the Smart Specialisation strategy: Innovation Europe (focused on R&D); Youth on the Move (focusing on human capital); and A Digital Agenda for Europe (targeting ICT).
EU Cohesion Policy has fully internalized the Smart Specialisation approach by aiming to identify the optimal regional-level matching between innovation efforts, human capital, and local industrial and technological advantages (McCann & Ortega-Argilés, Citation2015). The architecture of the 2014–20 EU Cohesion Policy rests on the assumption that the Smart Specialisation principles are applicable to all regions: innovation is important for all regions; for advanced ones to remain ahead and lagging ones to catch up. The process of ‘entrepreneurial discovery’ triggered by S3 is supposed to generate structural change through the inclusive process of stakeholder involvement and to make new activities (rather than sectors or individual firms) the core priorities (Foray, Citation2015; Morgan, Citation2016). Therefore, S3 requires stakeholders to have a global perspective on their potential competitive advantage, to be aware of their potential for cooperation, and to focus their efforts and resources on a limited number of ambitious realistic priorities through which to create a critical mass of research and development (R&D) activities, leading to structural change and growth (Radosevic, Curaj, Gheorghiu, Andreescu, & Wade, Citation2017). S3 is therefore expected to allow EU countries and regions to ‘strengthen their research and innovation systems, maximize knowledge flows, improve absorption and utilization capacities as well as spread the benefits of innovation throughout their economies’ (Hegyi & Rakhmatullin, Citation2017, p. 5).
Coherent with this approach, the European Commission presents all EU regions with a portfolio of tools inspired by the S3 approach to be selected, combined and coordinated in line with local needs: innovation clusters, innovation-friendly environment for small and medium-sized enterprises (SMEs), lifelong learning in research and innovation, regional research infrastructure and centres of competence, creativity and cultural industries, fast internet applications and easy access to online contents, and the use of public procurement to support demand for innovative products and services.
What is the evidence for the impact of the innovation policy tools implemented so far by the EU regions? A recent comprehensive review (What Works Centre for Local Economic Growth, Citation2015)Footnote3 of impact evaluation analyses of publicly funded programmes supporting innovation highlighted that only 17 of 42 reviewed papers identified some positive impact of active innovation policies on productivity (Aguiar & Gagnepain, Citation2013; Grilli & Murtinu, Citation2012; Sissoko, Citation2013), employment (Benavente, Crespi, & Maffioli, Citation2007; Einiö, Citation2014; Moretti & Wilson, Citation2013), or other measures of firm performance, for example, sales, turnover and profit (Nishimura & Okamuro, Citation2011). Moreover, the review concluded that programmes emphasizing public–private collaboration tend to perform better than those that exclusively support private firms. Additionally, only competitive subsidies have positive effects. Finally, the more general consolidated evidence is that evaluating the impact of R&D loans, subsidies and grants is extremely complex, even when individual programmes are relatively simple in terms of policy design and implementation. Only a limited number of impact evaluation studies can directly trace the full range of policy effects; none can attribute these effects to specific features of the corresponding programme (on the case of Italy, see Bertamino, Bronzini, De Maggio, & Revelli, Citation2016; Bondonio & Greenbaum, Citation2012; Bronzini & Piselli, Citation2016; Corsino, Gabriele, & Giunta, Citation2015; Fantino & Cannone, Citation2013; and Merito, Giannangeli, & Bonaccorsi, Citation2010).
If the existing literature is far from unanimous on the impact of active innovation policies on a variety of measures of firm performance, solid evidence on the returns to the novel features introduce by S3 is non-existent. A large part of the existing empirical literature on Smart Specialisation has focused on the engagement with private firms, government and civil society (Gianelle, Guzzo, & Mieszkowski, Citation2017), on the capacity of firms and regional and local governments to prioritize needs and opportunities clearly (Vivanco, Elorduy, & Eguía, Citation2016), on patterns of regional diversification (Balland, Boschma, & Rigby, Citation2016), and on the challenges for implementation in less developed regions (Innocenti & Lazzaretti, Citation2016).
The magnitude of the financial resources mobilized by S3 as well as its spatial and thematic extent make it particularly urgent to fill the substantial gap in the policy knowledge basis. If it is too early for any credible counterfactual assessment of the impacts of S3 measures, it is still possible to look into the copious experience accumulated over previous programming periods in order to identify suitable programmes that brought forward (at least some of) the features of the ‘new’ programmes inspired by the S3 approach. A policy-learning exercise aimed to extrapolate out from a particular ‘historical’ case in order to draw some (at least tentative) conclusions and guidance for ongoing policies.
THE COLLABORATIVE INDUSTRIAL RESEARCH (CIR) PROGRAMME
The CIRFootnote4 is a scheme of the Research and Competitiveness Programme (PON R&C), which accounts for almost 50% of the total budget of the National Operational Programmes co-funded in Italy by the 2007–13 EU Cohesion Policy. The CIR budget – roughly €1 billion jointly funded by the European Regional Development Fund (ERDF) and national sourcesFootnote5 – is intended to subsidize industrial research projects undertaken by firms located in less developed Italian regions (i.e., the regions included in the Convergence Objective for the 2007–13 programming cycle: Calabria, Campania, Apulia and Sicily). The CIR competitive funding scheme is coordinated by a national strategic unit and activated by local stakeholders in collaboration with each other. Firms apply for funding made available by the programme by submitting detailed project applications based on the identification of their own priorities and collaboration strategies with other firms and other research-active local stakeholders. The programme aims to foster both public and private R&D by means of the interactions between direct grants to universities and R&D subsidies to private firms. CIR applicants should identify and justify their own context-specific priorities within a set of nine preselected highly innovative activities eligible for funding: ICT; advanced materials; energy and energy saving; health and biotechnology; agro-industrial system; aerospace and aeronautics; cultural heritage; transport and advanced logistics; environment and safety (for additional information, see Appendix A in the supplemental data online). Only projects that fall clearly into one of these priority areas are eligible for funding (concentration of resources). In addition, CIR applicants should also identify ex-ante their collaboration strategy, with the CIR guidelines dictating that each project should be submitted by multiple firms and that consortia that also include research centres would be favoured in the selection process (collaborative dimension).
The National Operational Programme in charge of the implementation of the CIR in 2007–13 later acquired responsibility over the implementation of the national S3 in 2014–20. In addition, the CIR in 2007–13 and S3 in 2014–20 have a number of other similarities that make the S3 the natural large-scale evolution of the CIR. The same managing authority (the Ministry of Economic Development together with the Ministry of Education, Universities and Research) has responsibility over both CIR and S3 programmes. Both the CIR and S3 address the same categories of local beneficiaries (i.e., firms, universities, research centres). The size of their financial endowment and the financing funds are comparable. The territorial coverage (Mezzogiorno regions) is the same. The selection process of the projects to be funded is also very similar in terms of both procedures and timeline. They also share the same submission platform (named SIRIO). Finally, they both actively promote partnerships among firms, and university–industry collaborations, concentrating financial support in specific preselected, and almost perfectly overlapping, sectors. These similarities not only show the conceptual, operational and administrative continuity between the CIR and S3 but also suggest that the CIR anticipated some relevant characteristics later picked up by other schemes implemented in the 2014–20 period under the S3 framework.
While a number of relevant points of contact between the CIR and S3 do exist – making policy learning possible – some key caveats should be taken into account when assessing the external validity of the results. First, the CIR was implemented in less developed regions (Mezzogiorno) within the institutional setting of a Mediterranean country (Italy) during the years immediately following the Great Recession. Furthermore, the CIR did not embed any entrepreneurial discovery processes typical of the S3 approach: even if in practice the CIR targeted nine preselected sectors almost perfectly matching the 12 areas of intervention later identified by the S3 in 2014–20,Footnote6 the CIR’s sectoral targeting was not driven by a fully fledged self-diagnostic process but rather based on national strategic priorities.
The CIR was launched in January 2010 by means of an open call issued by the managing authority of the PON R&C, inviting firms to submit industrial research projects for the scheme to finance. By the end of April 2010 (the submission deadline), 533 applications were submitted for a total amount of requested subsidies of approximately €6 billion. Applications involved approximately 2000 entities (firms, research centres and/or universities). The evaluation of the funding applications by panels of independent expertsFootnote7 took place in May–June 2010. Applications were evaluated in light of their expected economic returns by means of a three-step evaluation procedure. The call for applications specified that a key selection criterion for the successful projects was the assessment by the selection panel of the expected impacts on industrial competitiveness of the development and implementation of the new technologies proposed in the application. In May 2010, the ranking of the applications was released. A single score was assigned to each application project ranging from 20.48 and 138.17. All project applications scoring below 96.0 were deemed ineligible for financing by the call for applications. The remaining eligible proposals (196 in total) were funded subject to budget availability following their rank order. Given the available budget and total funding requested by each project, only projects that received a score above 104.4 were in fact funded, whereas some eligible projects did not receive any funding due to lack of sufficient funding (32 projects received no subsides, notwithstanding their eligibility granted by a score above 96). A total of 143 large enterprises, 229 SMEs, 167 micro-enterprises, 237 universities and 161 research entities received funding. The average value of the financed projects was roughly €9 million, with an average subsidy of roughly €6 million.
Funded projects were mandated to start the proposed activities as soon as possible following the announcement of the results and to conclude the entire project in a maximum of three years from the start date. In order to enforce these requirements strictly, projects could benefit from an upfront transfer of up to 75% of the total funding conditional on having started the project by 30 October 2011. It is also important to stress that projects that received funding under the CIR programme could not receive any funding from any other source. This made it possible to exclude a priori any additional confounding source of funding at the time of the application as well as for the entire duration of the project. Unfortunately, the same conditions did not apply to the projects that did not receive funding. In order to mitigate any confounding factor, we checked with the OpenCoesioneFootnote8 data set to see whether firms applying for projects not financed by the CIR received any other form of EU funding from 2012 onwards, and we excluded from the analysis all firms that received other forms of funding.Footnote9
DATA
All data related to the CIR were taken from its official database (named SIRIO), which we accessed thanks to the PON R&C managing authority. For each project, the database included the evaluation score as well as a wide set of characteristics, including the tax code of the participating firms. The firms’ tax code allowed a merging of the CIR data set with firms’ balance-sheet information from CERVED (a database with firm-level budget data), employment data from the National Institute for Social Security (INPS), patent data from ORBIS (a firm-level database provided by Bureau van Dijk merged with Organisation for Economic Co-operation and Development (OECD) Patstat), as well as additional project-level data from OpenCoesione. The analysis focused on firm-level data. Each firm could, in principle, participate in more than one funded project (while firms participating in both a subsidized and an unsubsidized project were removed from the analysis). In order to account for the heterogeneous start dates of projects, we considered the yearly averages (referring to the time span in which firms actually received funding) as outcomes. The variables used in the empirical analysis are listed in Appendix B in the supplemental data online.
EMPIRICAL ANALYSIS AND IDENTIFICATION STRATEGY
The empirical analysis aims to evaluate whether the receipt of CIR subsidies makes a difference to the firms’ performance. As discussed above, subsidies were granted according to the scoring assigned by the independent evaluators: only the projects that received a score above the cut-off of 104.4 were actually funded. We exploited this discontinuity to investigate the causal impact of the CIR scheme on firm performance. In principle, projects ranked differently may differ in terms of many observed and unobserved characteristics that can be correlated with measures of firm performance. For instance, highly scored projects might be of superior intrinsic quality and, therefore, they might not face any credit constraint that would prevent their implementation even in absence of the funding. By applying an RDD, we were able to differentiate out all the characteristics of the projects that may confound the identification of the causal effect of the scheme. The key intuition behind this research design was that projects just below the cut-off (non-financed) make a suitable comparisons for those just above the cut-off (financed). This strategy was deemed preferable to other non-experimental methods because if the units of analysis cannot precisely manipulate the forcing variable (the ranking), the variation in treatment around the threshold is randomized as if the projects had been randomly drawn just below or just above the threshold (Lee & Card, Citation2008).
One implication of the local randomized result is that the empirical validity of the RDD can be empirically tested. If the variation in the treatment near the threshold is approximately randomized, it follows that all ‘baseline covariates’ – those variables determined before the realization of the forcing variable (the score) – should have about the same distribution just above and just below the cut-off. We present below a test for the absence of discontinuity in baseline characteristics around the threshold that substantiates the empirical strategy. The causal effect of the CIR is assessed by allowing the outcome variable to be a function of the score and testing the existence of a discontinuity in the intercept at the threshold. The forcing variable is centred at the cut-off value. In order not to impose any restrictions on the underlying conditional mean functions, the function of the centred score was interacted with the treatment dummy (Angrist & Pischke, Citation2011), using the specification:(1)
(1) where i is the firm; j is the project; t is the time period (2011–14); and the standard errors are robust to heteroskedasticity and clustered at the project level (Lee & Card, Citation2008). In the main specification models are estimated by following Athey and Imbens (Citation2016), that is, within the optimal bandwidth and with the optimal polynomial degree (Calonico, Cattaneo, & Titiunik, Citation2014). For the purpose of robustness checks, models were also estimated with a global polynomial function of up to degree three with the Akaike information criterion (AIC) selecting the best specification. We also provided estimation results to check for the presence of heterogeneous impacts at the threshold. In this case (as in Becker, Egger, & von Ehrlich, Citation2013; and Accetturo, de Blasio, & Ricci, Citation2014), we added to equation (1) an additional forcing variable (Z) that accounts for the conditioning aspect under investigation. Specifications (1) and (2) were also estimated by including firms’ fixed effects:Footnote10
(2)
(2) While the identification strategy delivers a highly credible picture of the effect of the subsidy for the subpopulation of firms close to the threshold, the RDD results may be less informative for those further away. This is unfortunate because, in the present case, identification away from the cut-off is particularly relevant, policy-makers might want to know what might have happened if firms with scores below the threshold would have gained access to the scheme. By the same token, they might wonder whether the public money spent on the firms that easily pass the admission threshold carries with it deadweight losses. To gain some insights into this regard, we make use of the Angrist and Rokkanen (Citation2015) conditional independence assumption (CIA). The CIA breaks the relationship between treatment status and outcomes by means of a vector of covariates such that, conditional on it, outcomes are (mean) independent of the running variable. The vector of covariates is then used to identify counterfactual values for the outcome variables of interest away from the cut-off.
EMPIRICAL FINDINGS
In this section we first document the baseline RDD results at the 104.4 cut-off. We the substantiate the validity of the RDD identification strategy by looking at manipulation, balancing and placebos. Next, we search for interesting asymmetries at the threshold, which might clarify the mechanisms at work. Finally, we provide the extrapolations away from the cut-off.
Baseline
reports the baseline results. We consider three outcome variables: Investment, Value Added and number of Employees. All are specified as a logarithmic growth rate (over the 2011–14 period) standardized with respect to the initial (2010) size of the balance sheet.Footnote11 The variable Investment includes both tangible and intangible capital outlays, as the CIR does not discriminate between the two. We sum all investments undertaken by each firm. Estimates are derived from a semiparametric estimator, where the optimal bandwidth and the polynomial degree, according to which the models are estimated, are selected by the Stata routine robust (Athey & Imbens, Citation2016; Calonico et al., Citation2014). The number of observations reported in are therefore ‘determined’ by the routine as they correspond to the optimal bandwidth which it has identified. The results reported in suggest that the impact at the threshold is negative and generally not significant (borderline statistical significance is found for Value Added).
Table 1. Impact of Collaborative Industrial Research (CIR) on investments, value added and employment (non-parametric results).
As a preliminary robustness check, we want to verify that these results continue to hold for different specifications. Table C1 in Appendix C in the supplemental data online reports those from parametric (global higher order polynomial approximations) regressions. In this case, the impact at the threshold is estimated by considering the full sample of observations. The forcing variable is included with the degree of polynomial (f) allowed to vary differently on the two sides of the threshold, interacted with the treatment dummy and selected by the AIC. The AIC suggests that the best degree of the polynomial approximations are (1-1), (3-1) and (3-1) respectively for the three outcomes. These additional results confirm those reported in , with a non-significant impact of the CIR for all outcomes. Figure C1 in Appendix C illustrates the classical RDD graph for the outcome Investment in the AIC preferred specification, where the threshold is normalized to zero for convenience.
Testing the validity of the identification framework
The RDD framework relies on the fact that firms cannot manipulate their ranking in order to obtain funding. In our case, this requirement seems to be trivially verified, as the score is assigned by the panel of independent experts. In any case, we investigate the smoothness of our forcing variable (the score) around the threshold. Figure C2 in Appendix C in the supplemental data online plots the density of firms (using bin sizes of 10). A visual inspection shows no increase in the probability mass after the threshold. At any rate, the hypothesis of non-random sorting around the cut-off is rejected on the basis of the test developed by McCrary (Citation2008).
To test the assumption that the assignment of the treatment near the cut-off is approximately randomized, we examine whether the observed baseline covariates are locally balanced on either side of the cut-off. The regression discontinuity provides a natural framework to check whether some confounding factor is driving some spurious correlation. It suffices to run RDD regressions (of the type in equation 1) using as dependent variables those factors that the researcher suspects might be driving the results. If no effect is detected, then that variable can be considered as controlled for in the RDD exercise. We focus on a long list of firm and project characteristics: from balance sheet data we focus on tangible and intangible capital, indicators of cash flow and of the liability side of the balance sheet, which proxy for credit constraints, traditional proxies for profitability, labour and service costs, and the number of employees (from the INPS). We also test the project and firm features that capture the S3 elements, such as the nature and dimension of the project’s partnership (presence of a university, number of subjects collaborating), the activity of the project, the economic sectors of the firms, its innovative capacities and its internationalization. These variables will be used below to check for heterogeneous effects at the threshold. The results (which are derived from the same specification as in ) are shown in . No jump occurs at the threshold for most of the baseline covariates. Exceptions refer to the return on assets (ROA). As explained by Lee and Lemieux (Citation2010), some of the differences in covariates across the threshold might be statistically significant by random chance. To check for this possibility, we combine the multiple tests into a single test statistic that measures whether data are broadly consistent with the random treatment hypothesis around the cut-off. We carry out a test for discontinuity gaps by estimating seemingly unrelated regressions (SUR), where each equation represents a different baseline covariate. In none of the equations is there any evidence of discontinuities.Footnote12
Table 2. Balancing for the baseline covariates.
Table C2 in Appendix C in the supplemental data online documents some of the experiments we ran to test the robustness of the results further. We show coefficients from placebo experiments, estimating the impact of the CIR on Investments, Value Added and Employment where no treatment takes place. We document the results obtained by using a fictitious threshold (we use 94.4 instead of the actual 104.4) and then a fictitious time window (we maintain the true cut-off and verify what happens in the pretreatment period 2008–10 rather than the post-intervention period). Should these placebos provide statistically significant results, the comparability between treated and controls units in the sample might be in jeopardy. Reassuringly, the results are very supportive, except for the coefficient on Employment when a mock threshold is used. This finding (which, however, does not show up when different fake thresholds are used) signals that the evidence on CIR employment impacts might be less robust when compared with those on Investment and Value Added.
Heterogeneity at the threshold
We move next to check whether the results at the border show any discernible asymmetries. In particular, we are interested in the S3 forerunner characteristics of the CIR. shows the results obtained by estimating equation (2) with reference to six additional forcing variables, those indexed by Zk (with k = 1–6). Preliminarily, it should be noted that the variables Zk are continuous at the 104.4 threshold, as shown in . Therefore, the estimation of equation (2) is a feasible exercise (Becker et al., Citation2013; Accetturo et al., Citation2014). Note that the findings reported in should be interpreted with care, as the additional forcing variables Zk might be cross-correlated. Moreover, some might be endogenous to the scheme. For instance, knowing that the inclusion of an academic partner raises the CIR score might have induced participants to include universities in their applications in order to maximize their probability of receiving the grants, with limited interest in actual collaborations.
Table 3. Heterogeneity at the threshold.
The investigation of the CIR mechanisms that more directly pre-empted some of the features of the programmes inspired by the S3 approach leads to the following evidence.
The participation of a university (Z1) in the application seems to have a positive effect (which is significant when we control for firms’ fixed effects) on employment in the beneficiary firms. However, in contrast to the predictions of an extensive literature on the benefits of university–industry collaborations, no effect is recorded on firms’ Investments and Value Added. In general, the collaborative dimension of the applications (Z2) does not seem to add to the overall impact of the scheme. On average, projects that involve a larger number of firms (i.e., those with more than 13 partners among firms and universities) perform relatively worse than others (the negative interactions enter highly significantly when the outcomes are Value Added and Employment).
As for the innovative nature of the activities supported by the scheme, we consider those that can be classified as ‘advanced’ in terms of knowledge intensity and technological capabilities. Since knowledge generation, accumulation and diffusion have been widely recognized as key drivers of firm competitiveness, knowledge-intensive activities should in principle attract the larger share of the benefits from the scheme. In particular, we identify CIR projects in the activity areas: ICT, advanced materials, health and biotechnologies and aerospace and aeronautics (Z3). However, the results suggest that funds channelled to this type of activities do not offer higher firm-level returns in comparison with other – more traditional – areas of activity (i.e., energy and energy reduction, agro-industrial system, cultural heritage, transport and advanced logistics, environment and safety). When firm-level fixed effects are included, the results suggest that CIR has a negative impact on employment levels: firms involved in advanced activities shift their production process towards more capital-intensive processes reducing labour input.
Looking at the characteristics of the beneficiary firms, the empirical evidence suggests that the scheme has benefited relatively more firms operating in low-tech sectors (Z4) (as to the EUROSTAT/OECD classificationsFootnote13). These firms are those facing stronger constraints in terms of access to credit as well as those for which collaboration with more innovative counterparts might offer the highest returns (for more evidence on this category of firms in the case of Italy, see Benfratello, Schiantarelli, & Sembenelli, Citation2008; and Giovannetti, Ricchiuti, & Velucchi, Citation2011). Firms active in low-tech sectors can expand both their investments and employment with no immediate trade-off between capital deepening and employment levels.
The results for firms with a high ex-ante patenting track record (Z5) are instead less straightforward: the impact on Investment is negative (although not significant when controlling for firms’ fixed effects), while Value Added seems to have been positively influenced by the subsidies. This evidence is probably capturing the lifecycle of innovative activities: firms can take full advantage of CIR incentives in terms of innovation output (measured by value added) when their stock of knowledge (existing patents) is already formed. In this case, CIR incentives are used to capitalize on the potential of previous investments (by increasing sales, for instance) rather than to support further investment. When controlling for firms’ fixed effects, therefore, we could observe that firms with a high ex-ante patenting stock also experience a positive impact in terms of employment.
Finally, a programme’s effectiveness was limited for multinational corporations (Z6), suggesting that in order to maximize returns to innovative investment, S3 programmes would need to find the right approach to take into account the specificities of these firms and mobilize their potential. Even if domestic/SMEs can play an important role in innovation processes, the key innovation players remain large and often multinational firms.
Far-from-the-threshold extrapolations
The results discussed so far are valid only for firms very close to the funding cut-off. By using Angrist and Rokkanen’s (Citation2015) CIA we can analyze the impact of the CIR far from the threshold. This is equivalent to exploring what might have happened with a more stringent (or more generous) funding threshold. As discussed in the fifth section, the possibility to extrapolate the impact of CIR for firms distant from the cut-off relies on breaking the relationship between treatment status and outcomes by means of a vector of covariates such that, conditional on it, outcomes are (mean) independent of the running variable.
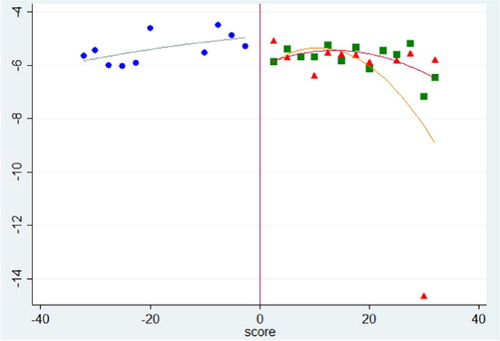
To ensure that the relationship between the running variable and the outcomes has been removed, we run for each outcome CIA tests from estimation windows of various width. The CIA test comes from models that control for tangible and intangible capital, value added, total balance sheet, cash flow, labour cost, service cost and employees (all measured in 2010 before the launch of the programme). The results show that for both Investment and Value Added the CIA is violated starting from the smallest bandwidth used (15 score points on the two sides of the financing cut-off). Therefore, for these two outcomes we cannot provide far-from-the-threshold extrapolations. On the other hand, for the outcome Employment and up to the bandwidth of [–32, 32] score points, we fail to find any sign of CIA violations (see Table C3 in Appendix C in the supplemental data online). Therefore, limited to Employment we can provide far-from-the-threshold inference for up to the 30% of the observations in the sample. The results suggest that a more (or less) generous level of funding of the scheme would not have affected the programme’s effectiveness. The CIA extrapolations for employment on the right of the cut-off are depicted in .
Figure 1. Conditional independence assumption (CIA)-based estimates, employment.
Note: Graphical representation of CIA-based estimates (Angrist & Rokkanen, Citation2015). The extrapolations are computed through a linear reweighting procedure. The fitted values for observed outcomes are represented by the dots (to the left of the cut-off) and the squares (to the right of the cut-off). On the right of the cut-off triangles represent the CIA-based extrapolations.
CONCLUSIONS
This paper has investigated the impact of CIR – a programme designed to foster industrial innovation in less developed regions of the Italian Mezzogiorno. Given the lack of direct empirical evidence on S3 impact to inform current scholarly and policy debate, the analysis of this forerunner programme might offer relevant insights to support the design and implementation of programmes inspired by the S3 approach in the 2014–20 programming cycle and provide helpful material for evidence-based reflections on post-2020 EU policies.
The results suggest that the impact of CIR on firm performance has been limited in terms of additional investments, value added and employment. The analysis has also unveiled the heterogeneity of the estimated impacts along a number of features of the scheme and of the beneficiary firms. Unfortunately, as customary in the programme evaluation literature, we can identify the (average and heterogeneous) effects of the policy but cannot draw conclusions about the underlying drivers (e.g., are the tools selected by CIR appropriate to achieve innovation?; are the selection procedures suitable to identify the most suitable beneficiaries? etc.).
However, the key insights from the analysis call for a cautious approach to the reform of innovation policies. The simultaneous introduction of new features, conditionalities and requirements in innovation programmes might be a risky choice if not accompanied by specific processes consolidating the policy’s framework. The entrepreneurial discovery processes embedded in the S3 framework might still be able to make the difference during the 2014–20 period where fully and correctly implemented in less developed regions notwithstanding their generally weak institutional context. In general, a gradual and evidence-based approach to policy reforms might be the best approach until robust evidence is produced about the impact and value added of alternative policy options.
Collaboration is an increasingly important feature of all innovative activities (Crescenzi, Nathan, & Rodríguez-Pose, Citation2016) and the S3 has created the preconditions for the development of policy tools aimed at reinforcing the collaborative dimension of innovation policies. However, when collaborations are not the result of an open and unconstrained search for the best possible partners but – on the contrary – are induced by public policy incentives, they fail to generate positive impacts. Collaborations with universities have offered limited benefits to partner firms but also collaborations with other private firms have generated no impact on the effectiveness of CIR. Moreover, large partnerships have proven highly dysfunctional leading to negative impacts on firm performance. In light of this evidence, policy-makers should consider very carefully the practical tools leveraged by the various S3 programmes in order to foster collaboration. Collaboration should reflect the genuine needs of local innovation agents and single-applicant submissions might be the best option in some cases. Therefore, the collaborative dimension of S3 projects should not be a requirement to be ‘rewarded’ as such but should be supported only when a clear rationale is provided in light of the specific technological problem that the applicant intends to solve.
The preselection of high-knowledge-intensity areas of activity has also failed to deliver the intended benefits when compared with more traditional technological domains. Again, this calls for a broad approach to innovation policies to be based on careful diagnoses of the features of the regional economy. Where more traditional technological domains can be identified as a potential source of competitive advantage, policy-makers should not signal any preference in the allocation of funding in favour of more advanced sectors. On the contrary, at the moment many EU less developed regions – irrespective of their initial conditions – have submitted their S3 Operational Programmes, placing a strong emphasis on advanced technological domains in an attempt to maximize their chances to receive funding for their ‘smart’ choices.
The capability of firms to benefit from S3 is likely to be heterogeneous. The analysis of CIR suggests that firms active in low-tech sectors are those more likely to benefit from S3-style support to their innovation activities. These firms face more difficulties in accessing credit to fund their innovation projects. In this context, the CIR has addressed a clear market failure, allowing them to expand their investment and foster their collaborations. Based on this evidence, S3 strategies might offer relevant opportunities to firms in traditional sectors. This calls for more attention in less developed regions for balanced S3 strategies. Low-tech sectors might be a less flashy but more rewarding target for public resources. Innovative firms – as measured by their patent stock – (irrespective of their sector of activity) might benefit from policies inspired by S3 principles but displacement effects of private investments are to be expected and additional impacts are likely to remain limited to the exploitation and commercialization of pre-existing ideas. Impacts on multinational internationalized firms are absent. The complexity of the scheme with its collaborative requirements – by increasing transaction and coordination costs – reduces the returns for complex and internally diversified organizations. In light of this evidence, the mobilization of larger firms remains a challenge for current and future S3 strategies that should be carefully considered.
These findings provide some initial evidence-based insights to inform and reinforce the debate on the S3 approach and its future post-2020 within the informative boundaries (and limitations) imposed by the specific methodology and, more generally, by the programme evaluation approach. For instance, external validity is a fundamental challenge and our results based on the experience of the less developed regions of Italy during the years of the Great Recession may not be immediately applicable to other EU regions under less extreme circumstances. Therefore, the results of this paper call for the investigation of further case studies in different EU countries by means of robust counterfactual evaluation methods. The impacts of current S3 programmes will not unfold early enough for their evaluation to inform evidence-based debates. The rigorous analysis of forerunner programmes might be the only feasible approach to the development of evidence to inform key decisions on the future of EU policies after 2020.
Supplemental Material
Download PDF (179.4 KB)ACKNOWLEDGEMENTS
The views and opinions herein are those of the authors and do not involve the responsibility of the institutions to which they are affiliated. The authors gratefully acknowledge feedback from participants at the congresses of the European Regional Science Association (ERSA) in Lisbon, Portugal, 2015, and Vienna, Austria, 2016; the Spatial Economic Research Centre (SERC) Annual Conference at the London School of Economics and Political Science (LSE), London, UK, 2016; and the Regional Studies Association (RSA) conference on Smart Specialisation and Territorial Development, Seville, Spain, 2016. All errors remain the authors’ own.
DISCLOSURE STATEMENT
No potential conflict of interest was reported by the authors.
Notes
1. This process involves the search activities of entrepreneurs that identify the potential advantages of general-purpose technologies in their own economic domain, as ‘entrepreneurs … are in the best position to discover the domains of R&D and innovation in which a region is likely to excel given its existing capabilities and productive assets’ (Foray et al., Citation2011, p. 7).
2. Cohesion Data Platform (see https://cohesiondata.ec.europa.eu/).
3. The What Works Centre for Local Economic Growth is a collaboration between the LSE, Centre for Cities and Arup.
4. For detailed information, see the PON R&C website (http://www.ponrec.it/).
5. The co-financing share plus additional national resources earmarked to research activities from the Research Facilitation Fund (FAR).
6. See S3platform.jrc.ec.europa.eu/.
7. After the preliminary checks of formal validity of the proposals pursued by a dedicated ministerial office, nine thematic panels of technical–scientific experts (one panel for each area of activity) evaluated the projects, attributing them a score. Subsequently, an additional final evaluation was pursued by another independent committee that took into account the views of the experts and attributed to the projects an additional score according to the results of detailed checks on the physical establishment where the proposed activities would have been carried out.
8. OpenCoesione (https://opencoesione.gov.it/it/) is the Italian governmental portal that collects data on all financial subsidies co-financed by EU funds and those financed by national resources in Italy. This covers the overwhelming majority of the subsidies available for firms located in less developed regions.
9. The control leads to a 40% reduction of the initial sample: 1172 of 2078 observations remain in the sample after matching the CIR database with the CERVED database on firm-level characteristics. The composition of the sample in terms of treated (11%) and non-treated firms remains balanced.
10. The inclusion of firms’ fixed effects does not change the results of the RDD estimations. For the results, see Appendix C in the supplemental data online.
11. This is the standard specification in the literature (e.g., Bronzini & Iachini, Citation2014). However, to test robustness, we check for alternative specifications of the outcomes variables. In particular, we specified them as relative variation and used the variation only between 2010 and 2014, with qualitatively similar results.
12. The results are available from the authors upon request.
13. See www.ec.europa.eu/eurostat/.
REFERENCES
- Accetturo, A., de Blasio, G., & Ricci, L. (2014). A tale of an unwanted outcome: Transfers and local endowments of trust and cooperation. Journal of Economic Behavior and Organization, 102, 74–89. doi: 10.1016/j.jebo.2014.03.015
- Aguiar, L., & Gagnepain, P. (2013). European cooperative R&D and firm performance: Evidence based on funding differences in key actions (CEPR Discussion Paper No. DP9426). London: Centre for Economic Policy Research (CEPR).
- Angrist, J. D., & Pischke, J. S. (2011). Mostly harmless econometrics. An empiricist’s companion (eBook). Princeton: Princeton University Press.
- Angrist, J. D., & Rokkanen, M. (2015). Wanna get away? Regression discontinuity estimation of exam school effects away from the cutoff. Journal of the American Statistical Association, 110(512), 1331–1344. doi: 10.1080/01621459.2015.1012259
- Athey, S., & Imbens, G. (2016). The state of applied econometrics – Causality and policy evaluation. arXiv:1607.00699, July. Retrieved from https://arxiv.org/abs/1607.00699
- Balland, P. A., Boschma, R., & Rigby, D. L. (2016, September). Relatedness, knowledge complexity and technological opportunities of regions: A framework for Smart Specialization. Conference Paper: First SMARTER Conference on Smart Specialisation and Territorial Development. Regional Studies Association (RSA).
- Becker, S. O., Egger, P. H., & von Ehrlich, M. (2013). Absorptive capacity and the growth and investment effects of regional transfers: A regression discontinuity design with heterogeneous treatment effects. American Economic Journal, 5(4), 29–77. doi: 10.1257/pol.5.4.29
- Benavente, J. M., Crespi, G., & Maffioli, A. (2007). Public support to firm-level innovation: An evaluation of the FONTEC program (Office of Evaluation and Oversight (OVE) Working Paper No. 05 07). Washington, DC: Inter-American Development Bank (IADB).
- Benfratello, L., Schiantarelli, F., & Sembenelli, A. (2008). Banks and innovation: Microeconometric evidence on Italian firms. Journal of Financial Economics, 90, 197–217. doi: 10.1016/j.jfineco.2008.01.001
- Bertamino, F., Bronzini, R., De Maggio, M., & Revelli, D. (2016). Regional policies for innovation: The case of technology districts in Italy. Regional Studies, 51(12), 1826–1839. doi: 10.1080/00343404.2016.1255321
- Bondonio, D., & Greenbaum, R. T. (2012). Revitalizing regional economies through enterprise support policies: An impact evaluation of multiple instruments. European Urban and Regional Studies, 21(1), 79–103. doi: 10.1177/0969776411432986
- Bronzini, R., & Iachini, E. (2014). Are incentives for R&D effective? Evidence from a regression discontinuity approach. American Economic Journal: Economic Policy, 6(4), 100–134. doi: 10.1257/pol.6.4.100
- Bronzini, R., & Piselli, P. (2016). The impact of R&D subsidies on firm innovation. Research Policy, 45(2), 442–457. doi: 10.1016/j.respol.2015.10.008
- Calonico, S., Cattaneo, M. D., & Titiunik, R. (2014). Robust nonparametric confidence intervals for regression-discontinuity designs. Econometrica, 82(6), 2295–2326. doi: 10.3982/ECTA11757
- Corsino, M., Gabriele, R., & Giunta, A. (2015). Research and development subsidies: The effectiveness of a regional policy. In P. P. Patrucco (Ed.), The economics of knowledge generation and distribution The role of interactions in the system dynamics of innovation and growth (pp. 223–251). London: Routledge.
- Crescenzi, R., Nathan, M., & Rodríguez-Pose, A. (2016). Do inventors talk to strangers? On proximity and collaborative knowledge creation. Research Policy, 45(1), 177–194. doi: 10.1016/j.respol.2015.07.003
- Einiö, E. (2014). R&D subsidies and company performance: Evidence from geographic variation in government funding based on the ERDF population-density rule. Review of Economics and Statistics, 96(4), 710–728. doi: 10.1162/REST_a_00410
- Fantino, D., & Cannone, G. (2013). Evaluating the efficacy of European regional funds for R&D (Bank of Italy Working Paper No. 902 1-40). Rome: Bank of Italy.
- Foray, D. (2015). Smart Specialisation opportunities and challenges for regional innovation policy. London: Routledge.
- Foray, D., David, P. A., & Hall, B. (2009). Smart Specialisation – The concept (Knowledge Economists Policy Brief No. 9, June ). Retrieved from http://ec.europa.eu/invest-in-research/pdf/download_en/kfg_policy_brief_no9.pdf?11111
- Foray, D., David, P. A., & Hall, B. (2011). Smart Specialization. From academic idea to political instrument, the surprising career of a concept and the difficulties involved in its implementation (MTEI Working Paper). Management of Technology & Entrepreneurship Institute (METI). Retrieved from https://pdfs.semanticscholar.org/29ad/6773ef30f362d7d3937c483003d974bc91c5.pdf
- Gianelle, C., Guzzo, F., & Mieszkowski, K. (2017). Smart Specialisation at work: Analysis of the calls launched under ERDF Operational Programmes (Joint Research Centre (JRC) Technical Reports, S3 Working Paper Series No. 11/2017). Retrieved from http://s3platform.jrc.ec.europa.eu/documents/20182/222593/Smart+Specialisation+at+work_Analysis+of+the+calls+launched+under+ERDF+Operational+Programmes/ed9f9e8d-c2e1-4667-832f-f1551f62f583
- Giovannetti, G., Ricchiuti, G., & Velucchi, M. (2011). Size, innovation and internationalization: A survival analysis of Italian firms. Applied Economics, 43(12), 1511–1520. doi: 10.1080/00036840802600566
- Grilli, L., & Murtinu, S. (2012). Do public subsidies affect the performance of new technology-based firms? The importance of evaluation schemes and agency goals. Prometheus: Critical Studies in Innovation, 30(1), 97–111. doi: 10.1080/08109028.2012.676836
- Hegyi, F. B., & Rakhmatullin, R. (2017). Implementing Smart Specialisation-thematic platform on industrial modernization (Joint Research Centre (JRC) Technical Reports, S3 Policy Brief Series No. 22/2017). Retrieved from http://s3platform.jrc.ec.europa.eu/documents/20182/221350/jrc108028_hegyi_rakhmatullin_.pdf/f5b2f333-ce42-4a50-b871-8b1f41a84124
- Innocenti, N., & Lazzaretti (2016, September). Smart Specialization, culture, creativity and tourism in Italian convergence regions. Conference Paper: First SMARTER Conference on Smart Specialisation and Territorial Development. Regional Studies Association (RSA).
- Lee, D. S., & Card, D. (2008). Regression discontinuity inference with specification error. Journal of Econometrics, 142, 655–674. doi: 10.1016/j.jeconom.2007.05.003
- Lee, D. S., & Lemieux, T. (2010). Regression discontinuity designs in economics. Journal of Economic Literature, 48(2), 281–355. doi: 10.1257/jel.48.2.281
- McCann, P., & Ortega-Argilés, R. (2015). Smart Specialization, regional growth and applications to European Union Cohesion Policy. Regional Studies, 49(8), 1291–1302. doi: 10.1080/00343404.2013.799769
- McCrary, J. (2008). Manipulation of the running variable in the regression discontinuity design: A density test. Journal of Econometrics, 142(2), 698–714. doi: 10.1016/j.jeconom.2007.05.005
- Merito, M., Giannangeli, S., & Bonaccorsi, A. (2010). Do incentives to industrial R&D enhance research productivity and firm growth? Evidence from the Italian case. L’industria, 2007(2), 221–242.
- Moretti, E., & Wilson, D. J. (2013). State incentives for innovation, star scientists and jobs: Evidence from biotech (FRBSF Working Paper No. 2013-17). San Francisco: Federal Reserve Bank of San Francisco (FRBSF).
- Morgan, K. (2016). Smart Specialisation: Opportunities and challenges for regional innovation policy. Regional Studies, 49(3), 480–482. doi: 10.1080/00343404.2015.1007572
- Nishimura, J., & Okamuro, H. (2011). Subsidy and networking: The effects of direct and indirect support programs of the cluster policy. Research Policy, 40, 714–727. doi: 10.1016/j.respol.2011.01.011
- Radosevic, S., Curaj, A., Gheorghiu, R., Andreescu, L., & Wade, I. (2017). Advances in the theory and practice of Smart Specialization. Academic Press/Elsevier. doi: https://doi.org/10.1016/C2015-0-00922-4
- Sissoko, A. (2013). R&D subsidies and firm-level productivity: Evidence from France (IRES Discussion Paper No. 2011-2). Paris: Institut de Recherches Economiques et Sociales (IRES).
- Vivanco, B., Elorduy, J. P., & Eguía, B. B. (2016, September). Entrepreneurial discovery as the main vector of specialized diversification: Lessons on how to reach Smart Specialization. Conference Paper: First SMARTER Conference on Smart Specialisation and Territorial Development. Regional Studies Association.
- What Works Centre for Local Economic Growth. (2015). Evidence Review 9. Innovation: Grants, loans and subsidies (October). London: What Works Centre for Local Economic Growth. Retrieved from www.whatworksgrowth.org