
 ?Mathematical formulae have been encoded as MathML and are displayed in this HTML version using MathJax in order to improve their display. Uncheck the box to turn MathJax off. This feature requires Javascript. Click on a formula to zoom.
ABSTRACT
This study investigates the connection between network centrality and firm growth on a sample of 3224 financial services firms located in the UK in the aftermath of the global financial crisis. The findings, based on a spatial econometric model of long-term firm growth, indicate that firms that span structural holes, engage in co-management appointments and have network connections to related companies in other financial centres grow faster. In contrast, such connections generate substantial negative indirect effects on proximate firms, leading to a divergence of growth rates between globally connected and locally embedded firms.
INTRODUCTION
The aftermath of the global financial crisis has seen a sharp reduction in employment in financial services in the UK,Footnote1 shrinking bank balance sheetsFootnote2 and a reduction in global investment banking revenueFootnote3 (Wójcik & MacDonald-Korth, Citation2015; Wójcik, Knight, O’Neill, & Pažitka, Citation2018a). Underneath this grim veil, however, there was a lot of variation in the effects of the global financial crisis on individual financial centres (FCs) and even more so on individual firms.
There is a highly unequal urban hierarchy of FCs in the UK, with substantial functional differences between different FCs (Parr & Budd, Citation2000). While London hosts most of the big banks and offers a wide range of complementary products, the remainder of the FCs in the UK, with Edinburgh in the lead, offer only a fraction of the capabilities of London (Clark, Citation2002; Cook, Pandit, Beaverstock, Taylor, & Pain, Citation2007; Parr & Budd, Citation2000). Consequently, different FCs and firms performed very differently in the post-global financial crisis period. The implications of these processes are far reaching and extend beyond the financial sector owing to the interconnectedness between financial services and the real economy (Coe, Lai, & Wójcik, Citation2014; Wójcik, Citation2018).
The financial geography literature offers several contributions assessing the effect of the global financial crisis on financial services; however, a substantial gap remains regarding the variation in growth performance of firms (Wójcik & MacDonald-Korth, Citation2015). Coe et al. (Citation2014) and Wójcik (Citation2018) develop the global financial networks (GFNs) framework, which has networks formed by the activities of financial and business services (FABS) firms at its heart. This literature is, however, yet to produce empirical studies of GFNs. Pandit, Cook, and Swann (Citation2001) study the effect of clustering on firm growth; however, their study predates the global financial crisis and it does not consider the role of network connections. A substantial literature focusing on firm growth exists in economics (Evans, Citation1987; Macpherson & Holt, Citation2007); however, it does not consider potential interactions among co-located firms or the role of networks. Complementing this work with the research on financial networks (Arjaliès, Grant, Hardie, MacKenzie, & Svetlova, Citation2017; Clark & Monk, Citation2017; Pichler & Wilhelm, Citation2001; Pollock, Porac, & Wade, Citation2004; Wójcik, Citation2018) leads to a research design that puts the positioning of individual firms in financial networks at the forefront of explaining their long-run growth performance and allows for interactions among co-located firms.
The objective of this paper is to study the effect of network centrality of financial services firms within syndication networksFootnote4 on their long-term growth rate and the indirect effects on other co-located firms. Owing to the relationship-oriented nature of investment banking, the primary subsector of financial services considered here, individual firms rely on their network capital to access valuable business opportunities, to develop relationships with new clients and to remain competitive. Consequently, it is likely that positioning within syndication networks has important consequences for long-term growth of financial services firms. To explore this proposition, we focus on the following two research questions:
Do financial services firms with more central positioning within syndication networks grow faster?
How are financial services firms located within the proximity of well-connected firms affected?
We use a sample of 3224 financial services firms sourced from the Bureau van Dijk’s Financial Analysis Made Easy (FAME) database and estimate a series of spatial econometric models of their average annual growth rates in the period 2007–15. We construct several specifications of network centrality, including degree centrality, betweenness centrality and network constraint (Burt, Citation2004). We use data on syndicated capital market deals,Footnote5 supplied by Dealogic, to operationalize the measures of network centrality. The results indicate that firms with higher network centrality grow faster, ceteris paribus. This effect holds for network centrality measures based on the number of network connections, brokerage as well as the size of FCs to which they are connected. Network centrality, however, leads to a divergence of growth rates between central and peripheral firms. This suggests that any benefits associated with networking primarily benefit focal firms and in turn lead to increased competitive pressure and lower growth prospects for other proximate firms. Consequently, we interpret these connections as a source of competitive advantage for the focal firm.
The paper is structured as follows. The literature and hypotheses section reviews the relevant literature on the topic and develops four hypotheses. The research design section details the econometric modelling methodology and data set used. We then present the results and comment on the validity of the tested hypotheses. We draw conclusions, discuss the limitations of this study and make recommendations for public policy and corporate strategy in the final section.
LITERATURE AND HYPOTHESES
Research on clusters can be traced at least as far back as the work of Marshall (Citation1920), and the trinity of original propositions for clustering still bears relevance. The cross-fertilization between the fields of economic geography and industrial dynamics has led to a rich literature on the dynamics of clustering, which can be divided into two themes: (1) the effect of clustering on firm entry, growth and survival; and (2) evolution of clusters. This literature draws on studies of firm growth in economics (Evans, Citation1987; Macpherson & Holt, Citation2007) and incorporates measures of clustering in models of firm growth (Frenken, Cefis, & Stam, Citation2015). Presently, however, it lacks studies that empirically disentangle the different types of localized inter-firm interactions and explicitly consider relational ties of firms.
Financial and economic geographers have contributed to these debates by studying the effects of clustering on firm growth (Beaudry & Swann, Citation2009; Pandit et al., Citation2001), while contributions from financial economics and business studies expand this work by considering network connectivity (Ljungqvist, Marston, & Wilhelm, Citation2009; Shipilov, Citation2006). Geographers studying FABS have long been interested in the problem of clustering of firms in urban areas (Cook et al., Citation2007) as well as the networks formed by FABS that connect cities (Taylor & Derudder, Citation2016; Wójcik, Citation2018). While the former studies are primarily interested in reasons for clustering and localized interactions, the latter focus on conceptualizing and operationalizing measures of network connectivity among cities. There are presently several complementary modelling approaches that consider networks of FABS firms and multinational enterprises in the context of cities and clusters. Taylor and Derudder (Citation2016) use the interlocking world city network model (IWCNM) based on office networks of FABS firms; Alderson and Beckfield (Citation2004) consider ownership ties within multinational enterprises; and Pažitka, Wójcik, and Knight (Citation2018) use inter-organizational projects. The GFNs framework developed by Coe et al. (Citation2014) and Wójcik (Citation2018) is broader in scope and considers the ties between FCs, offshore jurisdiction and the rest of the world facilitated by FABS.
To understand the growth dynamics of financial services firms, we must look beyond the locational advantages provided by clustering and consider their relational ties within the financial sector. Financial markets are central to understanding relationality in investment banking and asset management, and the market can be thought of as the medium through which many types of relational ties are formed (Arjaliès et al., Citation2017; Clark & Monk, Citation2017). We will now discuss in turn both the vertical and horizontal dimensions of such networks formed by market interactions.
Investors and issuers, the two principal parties in capital markets, are typically connected by complex chains of financial intermediaries, thus leading to a vertically differentiated, but highly integrated, structure of financial services (Arjaliès et al., Citation2017). These chains of financial intermediaries feature investment banks as the central intermediaries responsible for underwriting new issues of securities and allocating them to investors, who are typically represented by asset managers. Investment banks rely heavily on their reputational capital, which they develop over time by jointly satisfying the need of issuers to maximize proceeds raised from the issuance of new securities and that of institutional investors, who compete on a risk-adjusted rate of return and rely on favourable valuation of securities allocated to them by investment banks (Clark & Monk, Citation2017; Dunbar, Citation2000). To satisfy these competing objectives, investment banks have relied on their ability to reduce information asymmetries between investors and issuers by acting as reputable intermediaries, who put their reputation at stake and guarantee a fair valuation of the securities they underwrite (Dunbar, Citation2000; Vithanage, Neupane, & Chung, Citation2016).
In addition to the vertical dimension of networks of financial intermediaries, it is commonplace for financial services firms also to form horizontal network ties. To optimize their role as intermediaries between issuers and investors, investment banks form underwriting syndicates, which allow them to pool their expertise, financial resources and, perhaps most importantly, their reputational and network capital. An underwriting syndicate can leverage its ties to a wider pool of institutional investors than any individual bank and deliver a superior service to the issuer by reducing the costs of offering and maximizing proceeds (Pichler & Wilhelm, Citation2001; Pollock et al., Citation2004). Securities underwriters with high network centrality can leverage their network both to disseminate information and to extract information relevant to the pricing of new offerings (Bajo, Chemmanur, Simonyan, & Tehranian, Citation2016). The inclusion of reputable co-managers and commercial banks in underwriting syndicates is documented to lead to lower floatation costs and, consequently, higher net proceeds for issuers (Jeon & Ligon, Citation2011). This evidence is corroborated by research on multiple lead underwriting syndicates, which shows that by pooling their reputational capital, investment banks can reduce informational asymmetry between investors and issuers (Vithanage et al., Citation2016). This leads to lower initial public offering (IPO) under-pricing, lower variance of returns and superior long-run returns for investors. Dunbar (Citation2000) links these factors to the variance in market share of investment banks in IPO underwriting and corroborates the notion that benefits, which underwriting syndicates offer issuers and asset managers, in turn lead to higher market shares of investment banks that convey them.
It is, however, not only the sheer number of network ties that investment banks form that seems to affect the benefits they derive from their network centrality. Burt (Citation2004) proposes that actors in social networks can serve as brokers by spanning structural holes and thus connecting otherwise disconnected actors within the network. Brokerage function is hypothesized to benefit such actors by giving them a privileged access to information and resources flowing through the network and may also give them a form of network power, by intermediating ties among others. In the context of investment banking syndication, brokerage is linked to the ability of investment banks to access deal flow and gain appointments in underwriting syndicates. Consequently, banks with strategic positioning within syndication networks that span structural holes are shown to benefit from higher market shares in future (Shipilov, Citation2006). Taken altogether, the universe of underwriting syndicates gives rise to syndication networks, which evolve with every new underwriting syndicate.
Hypothesis 1. Firms with higher network centrality within syndication networks grow faster and they benefit from both the number of ties to other firms and the brokerage opportunities provided by their positioning in syndication networks.
In contrast, only well-established and reputable banks can reduce information asymmetry between issuers and investors and in turn allow them to benefit from lower flotation costs, reduced risk of offering and better long-run investment performance (Bajo et al., Citation2016; Jeon & Ligon, Citation2011; Vithanage et al., Citation2016). Consequently, for an underwriting syndicate to deliver the benefits mentioned above, it needs to feature both reputable banks and underwriters with appropriate expertise. The former is necessary to reduce information asymmetry and reassure investors that the offering is priced appropriately, while the latter is needed to arrive at the appropriate valuation in the first place (Pollock et al., Citation2004; Shipilov, Citation2006). Banks with established reputation and pre-existing ties with issuers are typically selected as lead-managers of securities offerings. It is, however, not feasible for every bank to have in-house equity research analysts covering every stock and this consequently creates opportunities for lesser established investment banks to join underwriting syndicates. In contrast to lead-managers, which typically serve pre-existing clients, co-managers are often able to establish new relationships with issuers, which may ultimately lead to more lucrative lead-management appointments in the future (Ljungqvist et al., Citation2009). Consequently, we would expect that engaging in co-management appointments is more likely to lead to the expansion of a bank’s clientele and future growth than lead-management appointments, which instead serve as a means of maintaining relationships with existing clients and maximizing current revenue.
Hypothesis 2. Engaging in co-management appointments leads to higher long-term growth, while lead-management appointments are of lesser benefit to future growth prospects in return for higher current revenue.
Provided it is in fact the access to deal flow that motivates banks to design their networks strategically by spanning structural holes, as hypothesized by Shipilov (Citation2006), it is plausible that inter-cluster network ties could convey benefits that intra-cluster ties do not. Examples of such benefits include the following. First, financial services firms located in different geographical areas are likely to have smaller overlap in the client base and consequently such network connections are more likely to lead to the formation of relationships with new clients (Wójcik et al., Citation2018a). Second, inter-cluster network ties may span structural holes and connect otherwise disconnected participants in these networks (Burt, Citation2004). Third, inter-cluster network ties may open access to new market segments and allow financial services firms to benefit from the reputational capital and local expertise of their syndication partners (Ljungqvist et al., Citation2009). Finally, access to a wider pool of institutional investors also drives the formation of underwriting syndicates (Pollock et al., Citation2004). Provided there is a lesser overlap in the pools of institutional investors that investment banks located in different FCs are connected to, we expect that forming inter-cluster network ties can lead to a bigger pool of institutional investors subscribing to an offering. This, in turn, has implications for the valuation of the offering, first-day returns and stock price volatility (Vithanage et al., Citation2016).
Hypothesis 3. Inter-cluster network connections are more valuable than intra-cluster network connections with respect to a firm’s long-term growth.
Hypothesis 4. Firms with central positioning in syndication networks outcompete other proximate financial services firms and effectively grow at their expense, leading to a negative indirect effect of network centrality on firm growth.
RESEARCH DESIGN
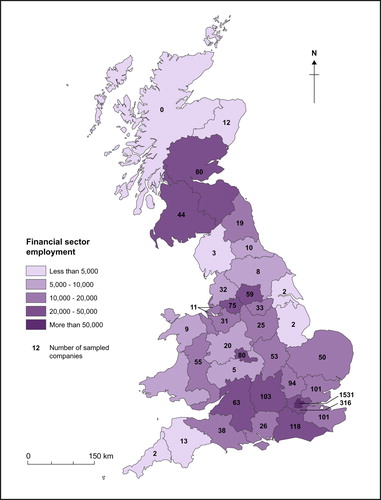
The related literature typically adopts a definition of clusters based on market and non-market connections among co-located firms, which rely on similar inputs, use similar technologies and knowledge, compete and cooperate, rather than simply being spatial concentrations of firms from the same industry (Porter, Citation2000). Consequently, standard industrial classifications are not ideal for defining clusters and can lead to serious omissions in sampling. We begin with selecting two industry categories – commercial bankingFootnote6 and investment banking and securities dealing,Footnote7 which are at the core of FCs – and sample companies with total assets data available in at least one year in the period 2007–09 from the Bureau van Dijk’s FAME database.Footnote8 We restrict ourselves to those with a primary trading address in England, Scotland or Wales. This yields 2868 companies with the required data available. We then search the Dealogic databasesFootnote9 for all advisors who have served UK clients as underwriters of primary offerings of equity and debt securities, arrangers of syndicated loans, or advisors in mergers and acquisitions (M&As). This leads to a combined sample of 3224 companies. In terms of industrial structure, commercial banks (39%) and investment banks (33%) dominate the sample. Other types of financial firms are also covered, including consulting firms, based on their participation in advisory roles for the four types of services considered here. In terms of geographical location, the sample is heavily weighted towards Inner London (47.5%) and Outer London (9.8%) NUTS-2 regions. However, it also represents the rest of the UK, with 42.7% of sampled companies located outside of the capital city ().
Figure 1. Spatial distribution of the sampled financial services firms.
Note: Financial sector employment is the sum of full-time employment in financial services activities except insurance and pension funding (Standard Industrial Classification (SIC) 2007 code 64) plus employment in activities auxiliary to financial services and insurance activities (SIC 2007 code 66). Employment data were sourced from the Office for National Statistics’ (ONS) Business Register and Employment Survey (BRES) database and are measured as of 2007. The number of sampled companies is pooled across 2007–09 and is based on the availability of company total assets data from the Bureau van Dijk’s Financial Analysis Made Easy (FAME) database. Regional boundaries are consistent with the NUTS-2 2010 classification. Sources: Authors’ calculation based on FAME and BRES data.
We use a spatial econometric model with local spillovers, presented in equations (1–3). Equation (1) is estimated by the spatial Durbin error model (SDEM), and equations (2) and (3) detail the structure of error term (Anselin, Citation2013):(1)
(1)
(2)
(2)
(3)
(3) where y is the dependent variable; X is a vector of explanatory variables; β1 is a vector of direct effects; W is a spatial weighting matrix; β2 is a vector of indirect effects; u is a spatially correlated residual; ε is a normally distributed residual with mean zero and constant variance; and λ is the spatial error autocorrelation coefficient. The β1 coefficients can be interpreted as partial derivatives in the same way as in non-spatial models, while the β2 coefficients are interpreted as the cross-partial derivatives, meaning that they are the average spatial spillovers falling on each neighbour. This interpretation of β2 coefficients relies on the use of binary symmetric adjacency matrix (W) (Anselin, Citation2013).
While spatial econometric models of long-term growth are common in studies of regions or countries, they are less common in micro-economic studies (Anselin, Citation2013). Such applications present their unique set of challenges, given that W can no longer be meaningfully based on contiguity and the positions of firms are not fixed in space indefinitely. We consider several specifications of W based on varying great circle distances in the range 30–70 km to show that the results are reasonably robust to the size of the neighbourhood selected. The specification of W does not allow for firms to move their head office among cities; however, it is robust to relocations within metropolitan areas set by the great circle boundaries specified above. Given that FABS firms seldom move their headquarters from one city to another, we expect that this only has a marginal effect on the results.
Figure A1 in Appendix A in the supplemental data online provides a schematic illustration of the set-up used for our econometric models. The explanatory variables are measured at the beginning or before the growth period modelled. The growth period represents an eight-year window, over which we calculate an average annual growth rate of total assets. We also use shorter six-year windows for robustness checks. The averaging of growth rates across multiple annual periods is warranted, given that annual firm growth rates are generally too volatile to model. Therefore, we define the dependent variables as:where
is the growth rate of total assets averaged across a (t2 – t1) period;
is the natural logarithm of total assets at the beginning of the period; and
is the natural logarithm of total assets at the end of the period.
The set of explanatory variables used in our models is detailed in Table B1 and the descriptive statistics are in Table B2 in Appendix B in the supplemental data online. To control for clustering of both related and unrelated activities, we construct two variables: the natural logarithm of full-time employment in FABS and full-time employment in all other sectors at the NUTS-2 level. FABS employment is defined as employment in financial services activities except insurance and pension funding (Standard Industrial Classification (SIC) 2007 code 64) plus employment in activities auxiliary to financial services and insurance activities (SIC 2007 code 66). Employment data were sourced from the Office for National Statistics’ (ONS) Business Register and Employment Survey (BRES) database. In studies of firm growth, there is typically a fraction of the sampled companies with missing growth rates, because they have exited the sample during the studied period. If exits are not random and are correlated with explanatory variables in the growth equation, this may result in biased coefficient estimates. To address this problem, we use Heckman’s (Citation1979) correction method for dealing with selection bias in the sampling process.
We rely on the concept of the inter-organizational project to operationalize our measures of network centrality. Inter-organizational projects are defined as those involving multiple financial services firms and delivered to a single client, as a form of service provision (Pažitka et al., Citation2018). We do not consider all possible inter-organizational projects, but instead focus on underwriting syndicates of equity and debt securities, syndicated loans and M&As with multiple advisors. To construct measures of network centrality of individual financial services firms, we use affiliation matrices, which include data on syndicated deals in these four categories and the respective syndicate members for each deal. The affiliation matrices are populated with data for three years preceding the beginning of measurement period for our dependent variable.
To address the network boundary specification problem, we do not restrict our networks to the UK, but base the network centrality measures on a global network of 7458 firms involved in the provision of these services. This sample was obtained by sampling the top 500 bookrunner (ECM, DCM), mandated lead arrangers (LOANS) and acquirer/target advisors (M&As) in each year between 2000 and 2015. On a value-weighted basis, this sample represents in excess of 99% of transactions in these markets.
We consider multiple measures of network centrality including degree centrality, betweenness and Burt’s (Citation2004) network constraint. We distinguish between intra- and inter-cluster ties by dividing the degree centrality measure into two separate variables based on the relative positioning of financial services firms (Bathelt et al., Citation2004). Additionally, we distinguish between network ties formed by lead-management appointmentsFootnote10 and co-management appointmentsFootnote11 (Ljungqvist et al., Citation2009). This leads to a directed network, where ties are directed from lead-managers to co-managers. Bathelt et al. (Citation2004) also propose that the value of long-distance network ties is likely to be influenced by the size and importance of the cluster that they connect the focal firm to. To account for this, we include a specification of inter-cluster ties weighted by the aggregate fees of the FC that these ties connect the focal firm to.
RESULTS
Main results
Hypothesis 1
The coefficient estimate on degree centrality (, model [1]) implies that for every 10% increase in the number of unique ties with other firms, there is an estimated 0.24% increase in the average annual growth rate. We then use betweenness centrality in model [2] to account for brokerage opportunities offered by the focal firm’s positioning in the syndication network. The coefficient estimate on betweenness centrality implies a 0.12% increase in annual firm growth due to 10% increase in betweenness. These estimates are of modest economic significance; however, this is likely due to the inability of these measures of network centrality to account comprehensively for the positioning of firms in networks. In the context of financial services, it has been argued that both the brokerage opportunities and the sheer number of network ties are important (Shipilov, Citation2006). We therefore also employ Burt’s (Citation2004) network constraint measure, which effectively combines the previous two measures and varies with both the number of connections and brokerage opportunities. The estimate in model [3] implies a 1.99% increase in firm growth per 10% decrease in network constraint.Footnote12 We interpret the much larger estimated marginal effect of the network constraint in contrast to either degree centrality or betweenness as an evidence of the joint significance of both the number of ties and the brokerage opportunities presented by them and a likely interaction between the two types of centralities with respect to the benefits they offer.
Table 1. Main results.
To assess fully the economic significance of such changes in network constraint, we must also consider the frequency of large changes in network constraint that materially impact firm growth. We therefore examine the distribution of annual percentage changes in network constraint. We find that 4.3% of the observed annual changes represent 10% or higher reduction in network constraint. We then zoom in on the non-zero annual changes only and find that 31% of such changes are of 10% or higher reduction, 24% of them exceed 20% reduction, 10% exceed 50% reduction, and 5% exceed 70% reduction in network constraint. Similarly, increases in network constraint that imply a deterioration of firm’s network centrality are not uncommon. In fact, 57% of the non-zero annual changes that we observe are positive and 36% represent a 10% or higher increase in network constraint.
Hypothesis 2
Building on the work of Ljungqvist et al. (Citation2009) on co-management appointments, we make the distinction between network ties formed by co-management and lead-management appointments. The results indicate that network ties formed through co-management appointments increase long-term firm growth by an estimated 0.59% per 10% increase in network centrality (, model [5]). This finding is consistent with the results of Ljungqvist et al., which suggest that despite the lower fees and prestige associated with co-management appointments, they are a viable way of developing relationships with new clients and increasing probability of obtaining more lucrative lead-management appointments in future. In contrast, lead-management appointments lead to an estimated 0.33% reduction in firm growth per 10% increase in network centrality. This is consistent with the established knowledge that lead-management appointments are typically assigned to firms that already have a well-established relationship with the client and are, therefore, unlikely to expand one’s client portfolio (Ljungqvist et al., Citation2009). Such a reduction of future growth prospects can be interpreted as an opportunity cost of higher current revenue associated with lead-management appointments.
Hypothesis 3
We now consider the distinction between intra- and inter-cluster network ties. The results shown in (model [4]) indicate that the value of network centrality with respect to firm growth is primarily due to inter-cluster network ties, which are estimated to increase firm growth by 0.28% per 10% increase in their frequency. This value is very close to the 0.24% estimated for degree centrality, which counts both inter- and intra-cluster ties. Combined with the insignificant coefficient estimate on intra-cluster ties, this evidence suggests that localized ties carry little value for firm growth, while inter-cluster ties are the drivers of firm growth. We also consider a different specification of this variable and use weights based on the size of FC to which inter-cluster ties connect the focal firm. The coefficient estimate on this specification of the inter-cluster ties implies a 0.51% increase in firm growth for every 10% increase in inter-cluster network ties (Table 2, model [5]).
Hypothesis 4
We now shift attention to the indirect effects of network centrality on firm growth. This means that instead of focusing on the focal firm, we consider the effect of changes in the network centrality of the focal firm on the growth rate of other co-located firms. The point estimates presented in (model [3]) suggest that there is an estimated 0.25% decrease in the average annual growth rate of each firm within the proximity of a connected firm for a 10% decrease in its network constraint. Note that this is not the cumulative effect across all neighbours as customarily presented in studies using row-standardized W, but the average effect on each neighbouring firm. Therefore, particularly in big FCs with many well-connected firms and even more small and lesser connected firms, such as London, the resulting competitive pressures could become a substantial impediment to the growth of lesser connected and locally embedded firms.
Robustness checks
To verify the robustness of the results, we rerun the analysis for three additional time periods.Footnote13 We do this because the beginning of the sample period is at the eve of the global financial crisis, which was a very turbulent period for the financial sector. Financial services firms have employed a variety of responses, including deleveraging, moving into new markets and laying off a part of their workforce (Wójcik & MacDonald-Korth, Citation2015). For this reason, it is plausible that some of the factors not controlled for could be affecting the results and leading to omitted variable bias. Provided that these factors are specific to the global financial crisis period, we should see material changes in the results for different time periods. The results show a great degree of persistence and the partial effect of network constraint based on the coefficient estimate for the period 2007–15 is a 1.99% increase in firm growth per 10% decrease in network constraint. This increases to 2.01% for the period 2007–13, 2.13% for the period 2008–15 and decreases to 1.98% for the period 2009–15 (see Table C1 in Appendix C in the supplemental data online).
Spatial econometrics has been criticized, although the jury is still out on whether rightfully, for the dependence of coefficient estimates on the structure of spatial weighting matrices (Anselin, Citation2013). In order to make sure that the results are not driven by our specification of great circle distance, we consider other plausible values ranging from 30 to 70 km to construct spatial weighting matrices. The results presented in Table C2 in Appendix C in the supplemental data online show only minimal variation in the estimated direct partial effects on the network constraint variable. Estimated partial effects of network constraint range between 1.82% (40 km) and 2.05% (70 km) increase in firm growth rate for a 10% decrease in network constraint. As expected, the variation in the indirect effects of network constraint is slightly higher and they range between a 0.23% (70 km) and a 0.45% (40 km) reduction in the average annual growth rate of every co-located firm as a result of a 10% decrease in network constraint of the focal firm.
CONCLUSIONS
The objective of this paper has been to study the effect of network centrality of financial services firms within syndication networks on their long-term growth rate and the indirect effects on other co-located firms. The study is not the first to consider the effect of network centrality on firm growth or that of clustering (Frenken et al., Citation2015; Shipilov, Citation2006). Instead, its main contribution is in bridging the gap between these related, yet separately evolving, strands of literature and developing a research design that allows for modelling the relationship between network centrality and firm growth, while accounting for clustering and localized interactions among firms. The results speak to both groups of literature and explicitly consider financial services firms, which have been under-researched in studies of firm growth (Frenken et al., Citation2015; Macpherson & Holt, Citation2007).
The findings are consistent with the hypothesis that network centrality increases firm growth; however, we also find substantial differences in the contribution of different types of network ties. We find that accounting for both the frequency of ties and the brokerage opportunities presented by a firm’s positioning in syndication networks better accounts for the effect of network centrality than either specification separately. In contrast to Shipilov (Citation2006), we explicitly consider financial services firms as being part of FCs and account for potential localization and urbanization economies to isolate the effect of network centrality at the firm level and to consider its wider significance for FCs. This part of the present analysis extends related studies of localized inter-firm interactions within FCs (Clark, Citation2002; Cook et al., Citation2007). This study also fills gaps in the research on the world-city network (Taylor & Derudder, Citation2016) and GFNs (Coe et al., Citation2014; Wójcik, Citation2018) by providing empirical evidence linking the positioning of financial services firms within syndication networks to their long-term growth and studying the indirect effects of network centrality diffusing to other firms within their FCs.
We also consider the distinction between different types of network ties. Bathelt et al. (Citation2004) predict that network ties connecting clusters should enhance the competitiveness and growth of clusters, an effect enhanced by network connectivity within clusters and limited by the absorptive capacity of firms. We find that the connected firms generally benefit from forming inter-cluster network ties and this effect varies with the size of the FCs to which they are connected. On the other hand, the observed indirect effects are overwhelmingly negative and can be interpreted as a growth of connected firms at the expense of others in their proximity, as the result of localized competition.
The next distinction is made between network ties formed through lead-management and co-management appointments. This part of the analysis draws on the work of Ljungqvist et al. (Citation2009), who argue that co-management appointments can serve as stepping stones for financial services firms to develop relationships with new clients. This may ultimately lead to more lucrative lead-management appointments in future. We uncover the fact that it is co-management appointments that drive future growth, while lead-management appointments restrict future growth opportunities in exchange for immediate revenue. This evidence is consistent with the proposition of Ljungqvist et al. (Citation2009) that co-management appointments serve to expand the portfolios of clients of investment banks, while lead-management appointments are typically assigned to banks with whom the client already has an established relationship.
With regard to methodology, we extend the work of studies of financial services firms and clustering by controlling for firm heterogeneity and by allowing for econometric modelling of indirect effects of explanatory variables on co-located firms, which allows one to identify different sources of inter-firm indirect effects (Beaudry & Swann, Citation2009; Pandit et al., Citation2001). Although the methods used here are not new, their unique combination and application in this context breaks new ground and will hopefully inspire future research on FCs based on a micro-economic level of analysis. The results underline the value of researching economic–geographical phenomena at the firm level, given that simply looking at clusters or regions can often overlook important heterogeneity observable only at the firm level.
There are several implications of our findings for public policy and corporate strategy. The results on the divergence of growth rates between well-connected and lesser connected firms imply that financial services will become more concentrated at the firm level over time, in the absence of any countervailing forces. Consequently, this mechanism has the potential to exacerbate the too-big-to-fail problem, particularly if larger firms are more likely to develop central positioning within GFNs to begin with.
The inherent uncertainties regarding the terms of the UK’s future relationship with the European Union following Brexit raise the following question. What is the likely impact of Brexit on the UK’s financial sector? London, as a global FC, not only derives nearly 30% of its revenueFootnote14 from clients based in other European Union member states, but also it serves as a gateway FC for foreign banks wishing to access European financial markets. Consequently, ties with the rest of the European Union are relevant both to London’s ability to serve a significant share of its clientele as well as to attract subsidiaries of foreign banks, which contributed 45% of fees earned by London-based firms in 2015 (Wójcik et al., Citation2018b). Therefore, we expect that depending on the severity of barriers posed by the final Brexit agreement, at least part of the revenue earned from both European Union clients and subsidiaries of foreign banks located in the UK may be in jeopardy.
European FCs are presently, of course, not the only places that London-based firms are connected to within GFNs. The New York–London axis is quoted as the most significant tie in GFNs, and London is also connected to all other major FCs in the world, including Tokyo, Hong Kong, Singapore, Sydney, Toronto, Chicago and many others (Wójcik et al., Citation2018b). The question, therefore, remains whether London could refocus its activities and networks towards the rest of the world following Brexit. Alternatively, London’s ties to other FCs could suffer as a result of Brexit if it compromises its function as a gateway to European capital markets. In such an event, it is plausible that the damage caused by Brexit could in fact spread through London’s financial networks, rather than be absorbed by them. As a worst-case scenario, London could end up being circumvented within GFNs and a new gateway city for foreign banks wishing to access European financial markets could emerge.
This paper is restricted to England, Scotland and Wales, and although the focus is on long-term firm growth, we use at most eight years of data. With better data availability in future, this research can hopefully be extended to cover longer periods and more countries. More work needs to be done to identify the specific mechanism behind what is identified as the effect of localized competition between firms with high network centrality and their lesser connected counterparts. We hope that future research will build on this contribution.
Supplemental Material
Download MS Excel (34.8 KB)ACKNOWLEDGEMENTS
All errors and omissions are the sole responsibility of the authors.
DISCLOSURE STATEMENT
No potential conflict of interest was reported by the authors.
ORCID
Vladimír Pažitka http://orcid.org/0000-0001-9097-4375
Dariusz Wójcik http://orcid.org/0000-0003-2158-284X
Additional information
Funding
Notes
1. Wójcik and MacDonald-Korth (Citation2015) show a decline of 8% (88,000 jobs) in UK financial services employment between 2008 and 2012 using ONS BRES data.
2. The average and median total assets growth rates of the sampled companies between 2007 and 2015 are both negative.
3. Findings of Wójcik, Knight, and Pažitka (Citation2018) indicate that the global investment banking fees in 2015 were 60.52% of their 2007 value.
4. Syndication networks are formed by co-membership of financial services firms in equity and debt securities underwriting syndicates, syndicated loans or M&As.
5. Equity capital market (ECM), debt capital market (DCM), syndicated loans (LOANS) and M&As.
6. North American Industry Classification System (NAICS) 2012 – 522110.
7. NAICS 523110.
8. The FAME database covers both publicly listed and private firms located in the UK and Northern Ireland.
9. ECM, DCM, LOANS and M&As.
10. ECM – bookrunner; DCM – bookrunner; LOANS – mandated lead arranger; M&As – acquirer/target advisor.
11. Non-lead-managers, co-managers and underwriters.
12. A decrease in network constraint means that either the number of network ties has increased or the brokerage opportunities offered by a firm’s positioning within a network have improved.
13. The periods 2007–13, 2008–14 and 2009–15.
14. This relates to revenue from securities underwriting, syndicates loans and M&As advisory services.
Related Research Data
REFERENCES
- Alderson, A. S., & Beckfield, J. (2004). Power and position in the world city system. American Journal of Sociology, 109, 811–851. doi: 10.1086/378930
- Anselin, L. (2013). Spatial econometrics: Methods and models. Berlin: Springer Science & Business Media.
- Arjaliès, D.-L., Grant, P., Hardie, I., MacKenzie, D., & Svetlova, E. (2017). Chains of finance: How investment management is shaped. Oxford: Oxford University Press.
- Bajo, E., Chemmanur, T. J., Simonyan, K., & Tehranian, H. (2016). Underwriter networks, investor attention, and initial public offerings. Journal of Financial Economics, 122, 376–408. doi: 10.1016/j.jfineco.2015.12.001
- Bathelt, H., Malmberg, A., & Maskell, P. (2004). Clusters and knowledge: Local buzz, global pipelines and the process of knowledge creation. Progress in Human Geography, 28, 31–56. doi: 10.1191/0309132504ph469oa
- Beaudry, C., & Swann, G. P. (2009). Firm growth in industrial clusters of the United Kingdom. Small Business Economics, 32, 409–424. doi: 10.1007/s11187-007-9083-9
- Burt, R. S. (2004). Structural holes and good ideas. American Journal of Sociology, 110, 349–399. doi: 10.1086/421787
- Clark, G. L. (2002). London in the European financial services industry: Locational advantage and product complementarities. Journal of Economic Geography, 2, 433–453. doi: 10.1093/jeg/2.4.433
- Clark, G. L. (2016). The components of talent: Company size and financial centres in the European investment management industry. Regional Studies, 50, 168–181. doi: 10.1080/00343404.2015.1068932
- Clark, G. L., & Monk, A. H. B. (2017). Institutional investors in global capital markets. Oxford: Oxford University Press.
- Coe, N. M., Lai, K. P., & Wójcik, D. (2014). Integrating finance into global production networks. Regional Studies, 48, 761–777. doi: 10.1080/00343404.2014.886772
- Cook, G. A., Pandit, N. R., Beaverstock, J. V., Taylor, P. J., & Pain, K. (2007). The role of location in knowledge creation and diffusion: Evidence of centripetal and centrifugal forces in the city of London financial services agglomeration. Environment and Planning A, 39, 1325–1345. doi: 10.1068/a37380
- Dunbar, C. G. (2000). Factors affecting investment bank initial public offering market share. Journal of Financial Economics, 55, 3–41. doi: 10.1016/S0304-405X(99)00043-4
- Evans, D. S. (1987). Tests of alternative theories of firm growth. Journal of Political Economy, 95, 657–674. doi: 10.1086/261480
- Frenken, K., Cefis, E., & Stam, E. (2015). Industrial dynamics and clusters: A survey. Regional Studies, 49, 10–27. doi: 10.1080/00343404.2014.904505
- Heckman, J. (1979). Sample selection bias as a specification error. Econometrica, 47, 153–161. doi: 10.2307/1912352
- Jeon, J. Q., & Ligon, J. A. (2011). The role of co-managers in reducing flotation costs: Evidence from seasoned equity offerings. Journal of Banking and Finance, 35, 1041–1056. doi: 10.1016/j.jbankfin.2010.09.023
- Ljungqvist, A., Marston, F., & Wilhelm, W. J. (2009). Scaling the hierarchy: How and why investment banks compete for syndicate co-management appointments. Review of Financial Studies, 22, 3977–4007. doi: 10.1093/rfs/hhn106
- Macpherson, A., & Holt, R. (2007). Knowledge, learning and small firm growth: A systematic review of the evidence. Research Policy, 36, 172–192. doi: 10.1016/j.respol.2006.10.001
- Marshall, A. (1920). Principles of economics. London: Macmillan.
- Pandit, N. R., Cook, G. A., & Swann, P. G. M. (2001). The dynamics of industrial clustering in British financial services. Service Industries Journal, 21, 33–61. doi: 10.1080/714005045
- Parr, J. B., & Budd, L. (2000). Financial services and the urban system: An exploration. Urban Studies, 37, 593–610. doi: 10.1080/0042098002131
- Pažitka, V., Wójcik, D., & Knight, E. (2018). Construct validity in world city network research: From office location networks to inter-organisational projects in the analysis of intercity business flows (submitted).
- Pichler, P., & Wilhelm, W. (2001). A theory of the syndicate: Form follows function. Journal of Finance, 56, 2237–2264. doi: 10.1111/0022-1082.00404
- Pollock, T. G., Porac, J. F., & Wade, J. B. (2004). Constructing deal networks: Brokers as network ‘architects’ in the U.S. IPO market and other examples. Academy of Management Review, 29, 50–72.
- Porter, M. E. (2000). Location, competition, and economic development: Local clusters in a global economy. Economic Development Quarterly, 14, 15–34. doi: 10.1177/089124240001400105
- Shipilov, A. V. (2006). Network strategies and performance of Canadian investment banks. Academy of Management Journal, 49, 590–604. doi: 10.5465/amj.2006.21794676
- Taylor, P. J., & Derudder, B. (2016). World city network: A global urban analysis. New York: Routledge.
- Vithanage, K., Neupane, S., & Chung, R. (2016). Multiple lead underwriting syndicate and IPO pricing. International Review of Financial Analysis, 48, 193–208. doi: 10.1016/j.irfa.2016.10.001
- Wójcik, D. (2018). The global financial networks. In G. L. Clark, M. Feldman, M. Gertler, & D. Wójcik (Eds.), The New Oxford handbook of economic geography (pp. 557–574). Oxford: Oxford University Press.
- Wójcik, D., Knight, E., O’Neill, P., & Pažitka, V. (2018a). Investment banking since 2008: Geography of shrinkage and shift. Economic Geography, 94, 376–399. doi: 10.1080/00130095.2018.1448264
- Wójcik, D., Knight, E., O’Neill, P., & Pažitka, V. (2018b). Investment banking centres since the global financial crisis: New typology, ranking and trends. Environment and Planning A: Economy and Society. doi: 10.1177/0308518X18797702
- Wójcik, D., Knight, E., & Pažitka, V. (2018). What turns cities into international financial centres? Journal of Economic Geography, 18, 1–33. doi: 10.1093/jeg/lbx008
- Wójcik, D., & MacDonald-Korth, D. (2015). The British and the German financial sectors in the wake of the crisis: Size, structure and spatial concentration. Journal of Economic Geography, 15, 1033–1054. doi: 10.1093/jeg/lbu056