
ABSTRACT
The concept of regional resilience is explored by understanding the resilience of individual firms within both the region (and their capabilities to cope, adapt and reconfigure) and a constantly evolving economic environment. This study examines the utility of the QuiScore credit indicator (from the Financial Analysis Made Easy (FAME) database) to measure both firm and regional economic resilience. Using the Cardiff Capital Region in Wales, UK (for the period 2006–16) as a case study, the results indicate that the QuiScore is an effective indicator of the economic resilience of firms as well as an early warning indicator of economic stresses for a region.
INTRODUCTION
The concept of resilience has, in recent years, emerged as an important and desirable characteristic for manufacturing firms, where resilience can be defined as the vulnerability/capacity of a company to survive and adapt, resist, decline, and respond to opportunities (Valikangas, Citation2010).
There is a growing awareness of the importance of understanding firm resilience and capacity to adapt to shocks as a means of understanding the resilience of the regions in which they are based – but to date, there has been limited analysis of this. There is interest within the regional studies community in regional resilience, in particular when examining how regions have fared during the recent economic crisis (Bristow & Healy, Citation2014; Sensier, Bristow, & Healy, Citation2016). As such the understanding that resilience is a multidimensional property of regional economies has grown over recent years, with the identification that it encompasses factors such as resistance, recovery, reorientation and renewal (Martin & Sunley, Citation2015). In such a form, it becomes a difficult concept to operationalize and measure to the extent that some consider it to be ‘self-evidently common sense and yet conceptually and programmatically elusive’ (Pain & Levine, Citation2012, p. 3). Markman and Venzin (Citation2014) state that whilst there is an abundance of theory and empirical evidence on firm performance measurements, there has been surprisingly little work on the creation of a robust measure of firm resilience. Furthermore, where measures of economic resilience have been developed, they have tended to focus on the ex-post measurement of how resilient regions were to a particular shock or crisis such as the post-2008 global financial crisis (e.g., Sensier et al., Citation2016). Interest has been growing in finding early warning indicators that could help economies in advance of shocks occurring (Hermansen & Röhn, Citation2017), although to date there has been little investigation of this beyond the national level.
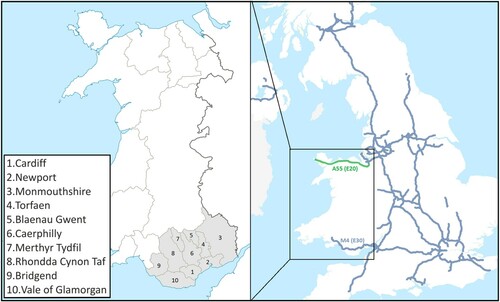
To fill in these gaps, the present study investigates the utility of the QuiScore as a measure of firm resilience in regions and, specifically, its capacity to provide insights into potential firm and sectoral vulnerabilities and thus threats to regional economic resilience. Focusing on a case study based around the manufacturing sector within the Cardiff Capital Region (CCR) in the UK, a sector that accounted for 11.6% of jobs in Wales in June 2016, within a region that accounts for about 50% of Welsh gross value added (GVA). This is despite the CCR geographically making up only 14% of the 20,779 km2 area of Wales. The location of the CCR within Wales and the UK as a whole is illustrated in .
Figure 1. Location of the Cardiff Capital Region (CCR) within both Wales and the UK.
This study seeks to address two main questions:
Is the QuiScore a meaningful and robust measure of a firm’s resilience to economic shocks?
What is the utility of this measure in enabling an enhanced understanding of regional economic resilience, specifically through its capacity to highlight key firm and sectoral vulnerabilities for a region?
The paper is structured as follows. It next reviews the literature, which examines the challenges in understanding the relationship between firm resilience and regional resilience. This establishes the potential value for regional economies in a measure of firm and sectoral vulnerabilities. The data set and sampling method are then described, including details of the QuiScore metric. This is then followed by an investigation of the manufacturing sector in the CCR, resilience to shocks, regional embeddedness and, finally, the conclusions.
RELATED LITERATURE
Recent economic crises have fostered interest in the concept of resilience in an effort to analyse and comprehend differences between regions and their vulnerability to economic shocks (Bristow & Healy, Citation2014, Citation2018; Doran & Fingleton, Citation2016; Martin & Sunley, Citation2015; Sensier et al., Citation2016). A consensus is emerging in the evolutionary economic geography literature that economic resilience of regions can be defined as the capacity of a regional or a local economy to withstand, recover from and reorganize in the face of market, competitive and environmental shocks to its developmental growth path (Boschma, Citation2015; Bristow & Healy, Citation2014, Citation2018; Martin & Sunley, Citation2015). There is growing appreciation that resilience is an intricate, multifaceted property of regional economic systems embracing resistance (the ability to resist disruptive shocks in the first place), recovery (the speed of return to some pre-shock performance level), reorientation (the extent to which the region adapts its economic structure) and renewal (the degree to which the region resumes its pre-shock growth path) (Bristow & Healy, Citation2018; Martin, 2011; Martin & Sunley, Citation2015).
In this multidimensional and evolutionary form, resilience is a difficult concept to operationalize and measure (Pain & Levine, Citation2012, p. 3). Fundamentally, there is a tendency to conflate and confuse resilience as a performance outcome, an adaptive capacity or process, and a discursive policy agenda (Bristow & Healy, Citation2014). Notwithstanding this, it remains the subject to much conceptual and empirical debate (Boschma, Citation2015).
Much of the focus in the studies of regional economic resilience to date has focused on the macro- or regional scale and, specifically, upon the structures of regional economic systems. This has been valuable in understanding the role of inherited production structures in shaping both the sensitivity of regions to recessionary shocks and the importance of the capacity to diversify production structures in securing resilience as reorientation and renewal (Boschma, Citation2015; Simmie & Martin, Citation2010). As such, it has been helpful in illuminating the path-dependent and evolutionary nature of regional economies. However, this system and structure emphasis has resulted in much less attention being paid to understanding the role of human agency in the adaptation at the heart of this conceptualization of resilience (Bristow & Healy, Citation2014). Thus, whilst it is acknowledged that larger systems are driven by the interactions between the diverse range of agents and their environment, there has been relatively little analysis of regional resilience with a microlevel focus (Billington, Karlsen, Mathisen, & Pettersen, Citation2017).
There is good reason to argue that understanding regional resilience, and thus any measure of it, implies an understanding of the resilience of individual firms and their specific capacities to cope with, adapt to and reconfigure their technological, network and organizational structures within a constantly evolving economic environment (Boschma, Citation2015; Swanstrom, Citation2008). The global economic crisis of 2008 highlighted the significant, often instrumental, role played by the strategic decisions and behaviours of businesses (Hill et al., Citation2012). When faced with a shock and falling demand, firms commonly respond in the short term by cutting back on employment, helping them realize savings through reduced personnel costs. However, evidence suggests that labour hoarding is becoming the preferred strategy for certain firms (Holm & Østergaard, Citation2015; Möller, Citation2010), whereas solidarity and altruistic actions are an important coping strategy that in the long run provides resilience for enterprises operating in clusters (Wrobel, Citation2015). Evidence from Wales has suggested that the Welsh government’s ProAct scheme launched in 2009, which offered subsidized training places to companies facing redundancies, encouraged labour retention and helped mitigate the impact of the economic crisis by saving some 10,000 jobs (Sensier & Artis, Citation2016).
There is much to be uncovered about the relationship between firm resilience and regional resilience, however, particularly in relation to whether and how indicators of changes in firm resilience may act as early warning signals for regional economies. In a recent contribution to this debate, Billington et al. (Citation2017) drew on the work of Lengnick-Hall, Beck, and Lengnick-Hall (Citation2011) who see organizational resilience as having three components: behavioural, cognitive and contextual. ‘Behavioural resilience’ is the ability of a company to pursue differing and potentially counter-intuitive courses of action, characterized by internal routines of collaboration, flexibility and habits of continuous dialogue. ‘Cognitive resilience’ is a mindset that allows a firm to respond to events in a nuanced and creative manner, going beyond survival to find opportunities in adversity. ‘Contextual resilience’ provides the setting for integrating and using both cognitive and behavioural resilience and embraces the building of social capital by forming and strengthening trusting relationships between people both within and without the organization. Internally, it is typified by a culture supportive of risk-taking, experimentation and admitting mistakes, whilst externally a broad resource network provides an operational platform for the enterprise (Billington et al., Citation2017). Billington et al. observe that contextual resilience, and specifically the importance of the firm’s connections to the region through ownership structures, localized supply chains and the labour supply, needs further research. This is a gap that the present study aims to address.
A critical gap also lies in the development of effective measures of firm resilience. Markman and Venzin (Citation2014) assert that whilst theory and empirical evidence on firm performance measurements abound, there has been surprisingly little work to date on the development of a robust measure of firm resilience, which they define as persistent superior performance over a long (10-year) period. In an exploratory study, they develop a measure of resilience that combines financial performance measures with volatility data for financial services firms. Their results suggest the resilience of these firms is driven by a combination of resource-capability mix, firm actions, historical events, market contexts and industry conditions.
However, the volatility and return on equity (VOLARE) measure has some limitations in that it has been applied to only one specific part of the banking sector, in particular larger banks. This raises potential questions regarding the generalizability and scalability of the measure. In addition, another potential cause for concern is the use of the return on equity (RoE) measure of corporate financial performance. The flaw with RoE, which is considered the most obvious, is that earnings can be manipulated via changes in accounting policy. Additionally RoE is calculated after the cost of debt but before accounting the cost of own capital so it increases with more financial gearing if the returns exceed the cost of the borrowings (De Wet & Du Toit, Citation2007). As such there is clearly scope for further investigation of potential measures of business resilience and their capacity to help provide early indications of the strengths and vulnerabilities in the regional economy associated with firm and sectoral performance. This is another gap that the present study aims to address.
One such measure is QuiScore, a proprietary indicator (from the Financial Analysis Made Easy (FAME) database, which contains financial and other data from about 4 million active UK registered companies and from about 7 million inactive or dissolved companies) of the financial health of a company (the likelihood of failure within the next year), which can also be used to determine a company’s credit worthiness. It has been previously applied to the study of both individual firms and groupings (Greenaway, Guariglia, & Kneller, Citation2007; Guariglia & Mateut, Citation2010; Linsley & Shrives, Citation2006; Mulhall, Citation2013), suggesting that there is value in investigating whether it could serve as an early warning indicator for economic resilience.
QuiScore provides an indicator of the probability of a company failing within the year following the date of calculation, originally created by Qui Credit Assessment Ltd (Pendlebury, Groves, & Groves, Citation2004): it is currently produced by CRIF Decision Solutions (Jeffrey, Citation2007). Bureau van Dijk, which compiles the FAME database, states that QuiScore is calculated using statistical and modelling techniques to select and apply a weight to data elements (variables and coefficients) that are most predictive of business failure (FAME, Citation2015).
The data elements include account information such as profitability, solvency and leverage, plus director history; registry trust information (county court judgements – CCJs); shareholder funds; and lateness in filing accounts (FAME, Citation2015). However, as a proprietary commercial method (much like financial metrics produced by Moody or Standard & Poor), the method used for its calculation is not publicly available. Researchers (Doumpos & Pasiouras, Citation2005) have used a multi-criteria approach (the UTilites Additives DIScriminantes (UTADIS) method) to replicate the five-band classification shown in . However, the accuracy was about 70%, suggesting that factors such as CCJs and tardy filing of accounts (which were not used) may indicate underlying problems that are not revealed by balance sheet data alone.
Table 1. QuiScore bands (adapted from FAME QuiScore description).
Within academic research the QuiScore has been applied in a multitude of ways. As a metric of credit risk, common applications have been in investigating the strength of specific companies (Jeffrey, Citation2007) and the rating of credit risks (Baourakis, Conisescu, Van Dijk, Pardalos, & Zopounidis, Citation2009).
QuiScores have also been used to investigate a variety of enterprise-related (individual or groupings) factors. Applications have included investigating whether a relationship exists between the volume of risk disclosures by an enterprise and its performance measured via a variety of risk measures (Linsley & Shrives, Citation2006), the relationship between financial health and exporting (Greenaway et al., Citation2007), how the level of global engagement of a company is reflected in its financial health (Guariglia & Mateut, Citation2010), and how private equity impacts upon innovation activities (Amess, Stiebale, & Wright, Citation2015). It has also been used as a means to identify (for study and evaluation) firms operating in the UK West Midlands’ forging sector (Mulhall, Citation2013). This use of QuiScore to investigate both individual firms and groupings strongly suggests that its application for the examination of the resilience of individual enterprises and sectors is an appropriate exploratory technique.
According to Bureau van Dijk, QuiScore is provided as a number between 0 and 100, with 0 representing those companies with the highest likelihood of failure. As shown in , the scores are divided into five separate categories, with an associated likelihood of failure in the next 12 months.
As such, in light of the main aim of the present study (exploring the concept of regional resilience through understanding the resilience of individual firms within the region), we seek to answer two main questions:
Is QuiScore a meaningful and robust measure of a firm’s resilience to economic shocks?
What is the utility of this measure in enabling the enhanced understanding of regional economic resilience, specifically through its capacity to highlight key firm and sectoral vulnerabilities for a region?
DATA AND SAMPLE
The FAME data set was interrogated in 2016 for all company trading addresses using the search criteria detailed in the following section. The UK Cardiff (CF) and Newport (NP) postcodes cover the CCR and as such were applied as a geographical filter. However, the NP postcode area also includes small parts of England and some Welsh areas outside the constituent local authorities of the CCR. As such they were excluded from the company search (NP8, NP16 7 and NP25 5QJ–RY).
All manufacturing sectors were selected using the UK 2007 two-digit Standard Industrial Classification (SIC) branch codes 10–32 (Food to Other Manufacturing), resulting in 2228 active companies being identified. Once all companies without a current QuiScore and any non-manufacturing primary SIC codes (a non-manufacturing firm may give a manufacturing secondary SIC) were eliminated, this was reduced to 1785 active companies.
Within FAME, there is a historical record of previous QuiScores covering a period of 10 years, providing a valuable source of longitudinal data covering the period just before the ‘credit crunch’ and subsequent recession in the UK. This is either accessible by year (so therefore the last available year that would cover both active and dissolved companies is 2006) or years away from the most recent QuiScore, which is of particular benefit for the study of companies that are no longer trading. The search for non-active companies, using the geographical and business criteria used above for active companies, resulted in 1008 companies whose final accounts were submitted as far back as 1987. Once these were filtered down to companies that submitted final accounts after 2006 and had a final QuiScore, this was reduced to 311 dissolved and in-liquidation companies.
MANUFACTURING RESILIENCE WITHIN THE CCR
Overview of the CCR
To produce an initial overview of the potential economic strength and resilience of all active manufacturers within the CCR, their current QuiScores are examined. As shown by Jeffrey (Citation2007), QuiScore can be used to provide the predicted stability of companies. As shown in , the present study scrutinized all the active companies extracted (n = 1785). The top and bottom companies were then ordered by FAME based on their turnover (a total of n = 429 companies). Finally the study looked at companies with no recorded turnover (n = 1356), that is, those which by UK company law are not required to report one, and specifically where two of the following were true: turnover ≤ £6.5 million, a balance sheet ≤ £3.26 million and ≤ 50 employees. All these provided a ‘snapshot’ of the average state of manufacturing within the CCR.
Table 2. Average QuiScores for active Cardiff Capital Region (CCR) manufacturing companies.
The results given in are encouraging, from the perspective of economic strength, in that the mean QuiScores are all in the normal, stable or secure bands. It is only the mode of the bottom 50 companies (by turnover) where the companies are considered to be high risk.
When the data from those companies without reported turnover are examined, it can be seen that the standard deviation (SD) is sufficiently large that a significant proportion of them will fall into the unstable band. Of the bottom 50 companies, 11 (22%) are unstable or high risk, and for the 1356 no (recorded) turnover companies, 394 are unstable or high risk (29%).
shows an anomalous result in that the mean for the top 50 companies is perceptibly lower (86.28) than that for the top 51–100 or 101–250 companies (90.39 and 91.07 respectively). Analysis of the source data shows that the cause appears to be that one company had a very low QuiScore (QS = 24), which distorted the mean. The CCR manufacturing facilities of the company underwent significant restructuring within the past 15 years (originally it planned to cease all CCR-based manufacturing), its other UK operations underwent job loses within that past two years, and also its registered office (RO) is outside the CCR, suggesting that its regional embeddedness might be low.
MANUFACTURING SECTORIAL RESILIENCE WITHIN THE CCR
As different industrial sectors can exhibit different economic characteristics (cf. Disney, Haskel, & Heden, Citation2003; Wakelin, Citation2001), there is merit in examining the manufacturing sector based on the UK SIC codes, specifically at the two-digit branch code level. In order to examine the resilience within individual industrial sectors, the average, minimum and maximum QS and SD of the average to ±SD for each two-digit manufacturing SIC were calculated ().
Figure 2. Average QuiScores for active manufacturing companies in the Cardiff Capital Region (CCR) (n = 1785) using Standard Industrial Classification (SIC) manufacturing sectors (two-digit SIC).
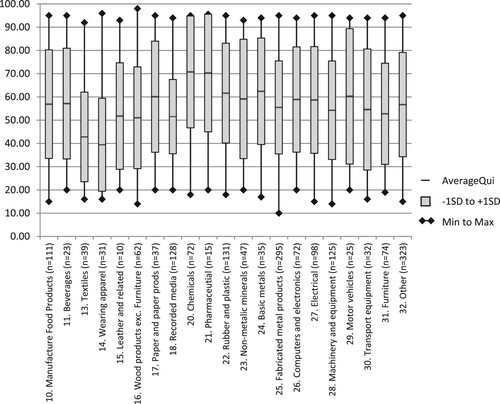
Broadly, many of the sectors have similar characteristics, with average QuiScores in the normal or stable bands. However, two sectors are of interest in that they represent two differing extremes of QuiScore. First, Chemicals (two-digit SIC code 20) has the highest average QS = 70.78, highest QS – SD = 46.7 and second highest QS + SD = 94.84 – so much so that all within the range are > 40 and, hence, are in the normal band or better. Second, Wearing apparel (two-digit SIC code 14) has the lowest average QS = 39.45, lowest QS – SD = 19.44 and lowest QS + SD = 59.46.
Examining the data for CCR located but non-CCR RO companies (see Table A1 in Appendix A in the supplemental data online) and CCR RO companies (see Table A2 online) shows that those companies not based in the CCR have a tendency to have higher average QuiScores, but a lower number of companies. This results in CCR RO companies having a discernible impact on the overall sector. Additionally, the results for non-CCR RO Electrical (SIC 27) and Transport equipment (SIC 30) sectors suggest there may be a negative skewed distribution (although this could be an artefact of the relatively small data set and the size of the companies).
RESILIENCE TO SHOCKS (WITHIN THE CCR)
In order to obtain a historical perspective on how companies respond to shocks and therefore obtain an indication of their resilience, data on companies that are active, dissolved, in liquidation, in administration or in default are examined in the following sections.
Change in QuiScore
As well as shocks caused by recessions and downturns, there can be unknown shocks to a company that could be reflected through a sharp fall in QuiScore (the metric is based on multiple factors). Where QuiScore data are available for the last available year and the preceding year, the percentage change in QuiScore is calculated for both active (n = 1679) and non-active (n = 311) companies. shows the proportion of dissolved (including in-liquidation) and active companies that have undergone a particular change in QuiScore. The results are indicative of a relationship between the rate of fall and subsequent liquidation and dissolution of a company, and that a small percentage fall in QuiScore (< 10%) is experienced by approximately one-quarter of (26.50%) active companies. Once the percentage fall increases, the number of active companies experiencing such a fall decreases exponentially. The average fall for dissolved companies was 43.2%; in total 67% of dissolved companies experienced such a fall or greater compared with < 2% of active companies. Of the dissolved companies that experienced such a fall, 92.3% had a final QuiScore < 20 (high risk). The average QuiScore change for active companies is a growth of 13.83%, where a significant proportion (43.66%) showed no change, which drops to 7.4% for dissolved companies.
Table 3. Change in QuiScore.
The distribution of active and dissolved companies with respect to the percentage change in QuiScore (from the previous to the most recent QuiScore) and the most recent QuiScore are shown in . There is a cluster of non-active companies whose percentage decrease in QuiScore is > 25%, and whose final QuiScore is < 25. The area bounded by the black box shows the companies whose percentage decrease in QuiScore is greater than the average for dissolved companies (a change of < −43%) and whose final QuiScore is below the average for dissolved company (< 20%). Other than seven active companies that fall within the range (0.5% of active companies), the companies are dissolved.
Figure 3. Distribution of companies based on percentage change and QuiScore.
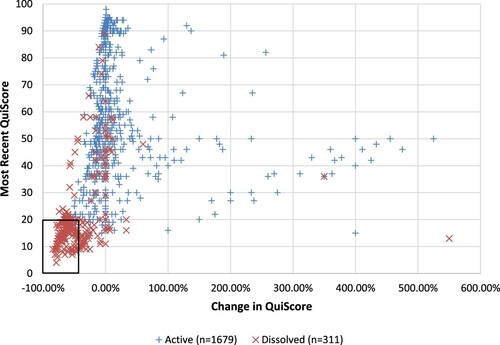
Two outliers in show that a significant increase percentage-wise in QuiScore has taken place for a dissolved company. The actual QuiScores are below normal risk, and for QuiScore to have grown several hundred per cent the previous score would have been very low.
When taking into account the previous results, this suggests that a QuiScore when coupled with the annual percentage change is a good indicator of potential failure, with a ‘steady state’ exhibited through a small fall or rise in QuiScore being an indicator of resilience, thus providing companies and other organizations, such as governmental bodies, with a means with which to sense potential problems and take remedial action.
Credit crunch and economic downturns
During the past decade there have been several shocks to the UK economy: the credit crunch and subsequent 2008–09 recession and the 2011–12 economic downturn. As indicated previously, the change in QuiScore has utility in the analysis of company resilience. Therefore, the average percentage annual change in QuiScore for 994 active companies (with QuiScores for all the years in the period 2006–13) is plotted against the change period, together with a similar plot for 132 dissolved (where data are available), in . For active companies, the average change in QuiScore between 2006 and 2007 was 7.05%; between 2007 and 2008 it had reduced to 1.77%. There is a slight recovery followed by another dip and then another recovery – a similar pattern to that of UK economic growth. Within the context of the UK, the start of the ‘credit crunch’ can be considered to be the bank run on Northern Rock in September 2007, the first in the UK for over a century (Brunnermeier, Citation2009). Despite the reduced growth in QuiScore following the credit crunch, there was no year-on-year fall in average QuiScore (though this did occur with some individual companies), suggesting that on average the active companies within the region exhibited resilience to economic shocks.
Figure 4. Average annual change in QuiScore for active (n = 994) and dissolved (including in liquidation) companies (n = 132).
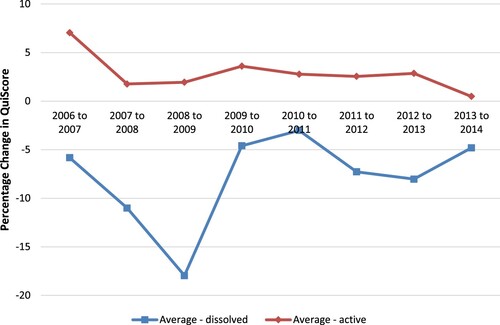
The graph for inactive (dissolved or in liquidation) companies shows a similar pattern that reflects changes in UK gross domestic product (GDP) growth. However, the significant difference is that the change in average QuiScore is always negative.
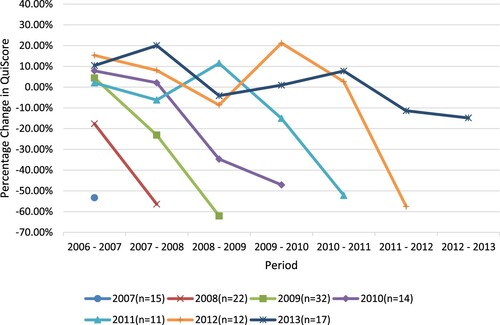
To examine this further, dissolved companies were grouped by the final year of trading, as shown in . There is a pattern of particular interest: the groupings of companies that fail tend to show two periods of falling QuiScores and negative QuiScore growth; this trend is shown for all but two years: specifically 2007 where there are insufficient historical data; and 2012 where the penultimate gradient of the fall is particularly steep (in 2012 the UK had two quarters of negative GDP growth). This suggests that falling QuiScores for several consecutive years could indicate a lack of resilience in that there was a shock that had a negative impact on the company and it was unable to recover from it. In addition, a very steep fall could be an indicator of a lack of resilience. shows that some healthy companies have had a big fall in QuiScore and could potentially be at risk, especially if they fail to stabilize or recover. Such a fall should be an indicator that remedial actions should be undertaken to address the root cause of the problems.
Figure 5. Average annual change in QuiScore for dissolved (including in liquidation) companies based on the final known year of active trading.
REGIONAL EMBEDDEDNESS OF COMPANIES
As observed by Billington et al. (Citation2017), connections to a region through ownership, supply chains and labour requires investigation. The following sections analyse the stability of companies based on their RO location and patterns of behaviour when healthy companies are closed.
Examination based on registered office location
Whilst the previous data and analyses provides an overall impression of the state of the CCR, it makes no differentiation between companies whose RO, and therefore in most cases their head offices, are located outside of the CCR and those whose ROs are within the CCR.
breaks down the results by all companies, non-CCR RO and CCR RO, and then disaggregates the data to examine the Cardiff (CF) and Newport (NP) postcode areas. As previously noted, not all companies have data for both for the last available year and the preceding year to calculate the change in QuiScore; therefore, the population size is given in the corresponding column.
Table 4. Analysis of QuiScore based on RO location.
The most significant result in is that of those manufacturers that have trading addresses in the CCR, but whose RO is not within the CCR. The average QuiScore is noticeably higher than that of the CCR companies. Linked to that is the large difference in change in QuiScore between CCR and non-CCR firms, although this may seem significant the average starting point is higher, therefore any change is smaller. In addition, there is also a great deal of stability in the non-CCR companies in that their high QuiScore tends not to change from year to year.
Also of note is how similar the average and median QuiScores are for All and CCR, CF and NP.
More in-depth analysis of these data was conducted where average turnover and the mean and median trading addresses were examined (for companies large enough to report turnover). Upon analysis of the data, it was noticed that there were five outlier companies (which are manufacturing in the CCR) with over 400 trading addresses; these companies were therefore excluded. This is shown in .
Table 5. Turnover and trading address analysis.
The results presented in provide compelling evidence that national or multinational firms are the top companies in the CCR (with respect to turnover) due to the number of registered trading addresses. Despite the removal of firms with a high number of trading addresses, the average number of addresses for non-CCR firms is greater than 10. The median number of addresses is three, showing that a substantial number of firms have more than one or two trading addresses. There are two broad categories of multi-address firms: manufacturers that retail and large corporations.
Examination of FAME data shows that only 18% of the top 50 companies by turnover have their RO in the CCR, a third (three) of these are part of the same corporate group. Of the 123 companies in the high-risk grouping (QS ≤ 20), only five have their RO outside the CCR. Therefore, the question arises of whether weaker companies have more durable links with their local areas, which could be both beneficial and detrimental when considering the sustainability and resilience of a local economy and community.
Even though the QuiScores for companies not headquartered in the CCR are in general high (therefore these top companies could be deemed to be secure), the number of trading locations could be a cause for concern, especially if the RO is not in the region and/or the company is a multinational – location decisions could become a divestment type choice, where non-financial and non-strategic factors, such as organizational and personal factors, are considered as definitely affecting the divestment decision-making process (Boddewyn, Citation1979).
Regional embeddedness of companies
In order to gain an insight into the embeddedness of companies, firms whose last available QS, before ceasing to trade, was > 51 (0–1% probability of failing) were examined. This analysis was conducted through the use of secondary data sources such as Companies House, The Gazette and corporate websites.
The analysis of the data on dissolved companies, shown in , indicates a pattern where a disproportionate number of non-CCR-based companies had become dissolved, but parent companies or other branches of the company were still active elsewhere in the UK or globally. Currently 14% of manufacturers trading within the CCR have their RO outside the CCR, yet 33% of the healthy companies dissolved had their RO outside the CCR. Of note is that the one CCR-registered company that has re-established itself was subject to a management buyout, suggesting local management had confidence in the business (reflected in a healthy QuiScore).
Table 6. Analysis of companies considered healthy before ceasing to trade.
This adds weight to the argument that companies whose RO is not in the CCR may not have the same attachment to the CCR, thus they are less locally embedded. The closure of the Bosch factory in the CCR, with the loss of 900 jobs, with manufacturing shifting to ‘Eastern’ Europe, is cited within the foreign divestment literature (cf. McDermott, Citation2010). Within the CCR there are several high-profile manufacturing facilities that are parts of multinational enterprises (MNEs) that were saved from total closure by the actions of the local management teams creating viable business plans. This suggests that the embeddedness of the companies comes from the employees, who by their very nature are embedded within the community rather than the corporate entity. This seems to concur with suggestions that even though an MNE may have linkages with the community, there is little evidence of embeddedness (Phelps, Mackinnon, Stone, & Braidford, Citation2003), and that local firms show greater adaptability and willingness to exploit local knowledge (Huh & Park, Citation2018). Following these restructurings, the companies seem to be taking a more active role in their local community, such as being involved in the activities of UK local enterprise zones (whose remit includes the development of technology clusters).
DISCUSSION AND CONCLUSIONS
The findings of the present study illustrate how QuiScore can be used to examine and monitor the resilience of companies. This addresses a significant gap in the literature regarding the lack of measures of firm resilience, which previous authors such as Markman and Venzin (Citation2014) have also highlighted. Though previous work, such as Markman and Venzin’s VOLARE measure, has begun to address this gap, it only focused on a specific segment of the banking sector. We go beyond a specific sector by examining manufacturers in all their diversity. Additionally, the present work has value by highlighting how QuiScore can also be used as an early warning signal for regional economies regarding potential firm vulnerabilities, though, as with any measure, we caution that there is always value in triangulation with other measures.
Our findings further indicate that the monitoring of the rate of change in QuiScore and the resulting QuiScore provides an indicator of the resilience of a company. Steep falls in QuiScore could indicate potential vulnerability, especially if firms fail to stabilize into a ‘steady state’ or, as per Valikangas (Citation2010), adapt, resist and respond. The analysis showed that failing firms also tended to have several consecutive falls in QuiScore, further highlighting the failure to enter a ‘steady state’.
The study also usefully highlights the potential source of vulnerabilities for regions, notably where firms are embedded. This reinforces the importance for regional resilience of understanding the wider supply chains and networks within which firms (and thus regions) are connected. When the headquarters locations are examined, further weight is added to the argument that companies not registered locally may not have the same attachment to a particular region. This reinforces findings of previous studies, such as by Billington et al. (Citation2017) and their observations on the importance of contextual resilience. The present study highlights the fact that when companies were in distress, those with strong local management and links were saved from closure. It further suggests that it would be beneficial for local and regional governments to monitor regionally important companies.
To sum up, the present work has shown that credit scores, such as QuiScore, have the potential to provide an indication of the resilience of companies and regions. However, QuiScore in isolation provides only a limited view of the situation for the financial reporting period. The results of this work strongly suggest that when combined with an analysis of the rate of change of QuiScore, a better measure is obtained. The application of this measure to data covering the 2008–09 UK recession has shown that it may also be used to evaluate resilience to economic shocks through the monitoring of change in QuiScores. Additionally, the analysis of failed companies showed a trend where there would be a fall in QuiScore for several consecutive years before the company ceasing trading. Therefore, it can be concluded that if a company has both a poor QuiScore and a significant fall in QuiScore, they are at risk of failing, especially if QuiScore has fallen for several consecutive years. Further studies in other similar UK regions would be beneficial in order to confirm this pattern of behaviour. The managerial implications of this are twofold. First, it provides managers the opportunity to take measures to improve the performance of their company. Second, it can forewarn supply chain managers that part of their supply chain may have issues and allow risk mitigation (such as secondary sourcing) to be applied.
The results also suggest that there is utility for this measure in enhancing the understanding of the role of company resilience within the context of regional resilience. This could have implications for those working in local, regional and national government as it could provide the potential to serve as an early warning indicator of economic stresses for a region. As stated by Bailey and Berkeley (Citation2014), appropriate interventions could be seen as critical in enabling recovery. Examples include the ProAct scheme in Wales (Sensier & Artis, Citation2016) and fiscal stimulus packages (Davies, Citation2011). The exploratory study on the CCR has helped illuminate aspects of this relationship, namely, the differing vulnerabilities of industrial sectors and subsectors, thus enabling policy-makers to identify better the companies and/or industrial sectors that may be at risk, as different business sectors benefited differently to responses to the 2008–09 economic crisis (Davies, Citation2011). It has also been suggested that the resilience of different firms is associated with the location of the headquarters in that high QuiScore companies (operating in ‘steady state’) tend to be registered outside the region.
Use of QuiScore data can provide an indicator of vulnerabilities associated with the variable embeddedness of resilient firms in the region’s economy. The data suggest that non-CCR-registered companies tend to have higher QuiScores and are considered healthier. It also shows that they seem to be more likely to cease their operations within the CCR whilst maintaining operations elsewhere (nationally or internationally). Two cases were presented to illustrate this behaviour: MNEs that wished to close operations in the CCR, and only through the efforts of local management were they able to maintain a manufacturing presence. The embeddedness of MNEs will be further tested by Brexit; as the literature suggests, it may have a negative long-term impact on foreign direct investment (Dhingra, Ottaviano, Sampson, & Van Reenen, Citation2016; Kierzenkowski, Pain, Rusticelli, & Zwart, Citation2016; Sampson, Citation2017).
LIMITATIONS AND FURTHER WORK
This work has focused on the study of the CCR. As such, there are limitations regarding the generalizability of the findings. Therefore, it is proposed that there needs to be an evaluation and comparison with other regions, particularly within the UK. Although it is unlikely that the CCR will be wholly unique, the analysis of other regions is necessary. Of particular interest would be the analysis of QuiScore for dissolved companies, which could further determine the utility of this approach.
The focus of this study has also been limited to the manufacturing sector. Further insights could be gained by expanding the analysis to include sectors such as agriculture and the service sector, not only to encompass a larger portion of the economy but also to examine if there are differences in how different sectors respond to shocks and stresses.
Furthermore, as the study excluded smaller, and other, manufacturing enterprises that did not have a QuiScore, studies could examine the utility of other potential resilience measures such as Altman’s Z-score (Pal, Torstensson, & Mattila, Citation2011).
There is also a need to conduct more detailed longitudinal studies on individual companies to see how they responded to shocks and falls in their resilience scores, as well as examining territorial (contextual) factors that may have an impact on the interpretation of the results.
Supplemental Material
Download PDF (192.2 KB)ACKNOWLEDGEMENT
The authors thank the reviewers and editors for their valuable comments.
DISCLOSURE STATEMENT
No potential conflict of interest was reported by the authors.
Additional information
Funding
Related Research Data
REFERENCES
- Amess, K., Stiebale, J., & Wright, M. (2015). The impact of private equity on firms' patenting activity. European Economic Review, 86, 147–160. doi:https://doi.org/10.1016/j.euroecorev.2015.08.013.
- Bailey, D., & Berkeley, N. (2014). Regional responses to recession: The role of the West Midlands Regional Taskforce. Regional Studies, 48, 1797–1812. doi: https://doi.org/10.1080/00343404.2014.893056
- Baourakis, G., Conisescu, M., Van Dijk, G., Pardalos, P. M., & Zopounidis, C. (2009). A multicriteria approach for rating the credit risk of financial institutions. Computational Management Science, 6, 347–356. doi: https://doi.org/10.1007/s10287-007-0050-3
- Billington, M. G., Karlsen, J., Mathisen, L., & Pettersen, I. B. (2017). Unfolding the relationship between resilient firms and the region. European Planning Studies, 25, 425–442. doi: https://doi.org/10.1080/09654313.2016.1276886
- Boddewyn, J. J. (1979). Foreign divestment: Magnitude and factors. Journal of International Business Studies, 10, 21–26. doi: https://doi.org/10.1057/palgrave.jibs.8490786
- Boschma, R. (2015). Towards an evolutionary perspective on regional resilience. Regional Studies, 49, 733–751. doi: https://doi.org/10.1080/00343404.2014.959481
- Bristow, G., & Healy, A. (2014). Regional resilience: An agency perspective. Regional Studies, 48, 923–935. doi: https://doi.org/10.1080/00343404.2013.854879
- Bristow, G., & Healy, A. (2018). Innovation and regional economic resilience: An exploratory analysis. Annals of Regional Science, 60, 265–284. doi: https://doi.org/10.1007/s00168-017-0841-6
- Brunnermeier, M. K. (2009). Deciphering the liquidity and credit crunch 2007–2008. Journal of Economic Perspectives, 23, 77–100. doi: https://doi.org/10.1257/jep.23.1.77
- Davies, S. (2011). Regional resilience in the 2008–2010 downturn: Comparative evidence from European countries. Cambridge Journal of Regions, Economy and Society, 4, 369–382. doi: https://doi.org/10.1093/cjres/rsr019
- De Wet, J., & Du Toit, E. (2007). Return on equity: A popular, but flawed measure of corporate financial performance. South African Journal of Business Management, 38, 59–69. doi: https://doi.org/10.4102/sajbm.v38i1.578
- Dhingra, S., Ottaviano, G., Sampson, T., & Van Reenen, J. (2016). The impact of Brexit on foreign investment in the UK. In BREXIT 2016. Policy analysis from the Centre for Economic Performance (pp. 24–33). Centre for Economic Performance.
- Disney, R., Haskel, J., & Heden, Y. (2003). Entry, exit and establishment survival in UK manufacturing. Journal of Industrial Economics, 51, 91–112. doi: https://doi.org/10.1111/1467-6451.00193
- Doran, J., & Fingleton, B. (2016). Employment resilience in Europe and the 2008 economic crisis: Insights from micro-level data. Regional Studies, 50, 644–656. doi: https://doi.org/10.1080/00343404.2015.1088642
- Doumpos, M., & Pasiouras, F. (2005). Developing and testing models for replicating credit ratings: A multicriteria approach. Computational Economics, 25, 327–341. doi: https://doi.org/10.1007/s10614-005-6412-4
- FAME. (2015). FAME – Financial Analysis Made Easy. Retrieved from https://www.bvdinfo.com/en-gb/our-products/data/national/fame
- Greenaway, D., Guariglia, A., & Kneller, R. (2007). Financial factors and exporting decisions. Journal of International Economics, 73, 377–395. doi: https://doi.org/10.1016/j.jinteco.2007.04.002
- Guariglia, A., & Mateut, S. (2010). Inventory investment, global engagement, and financial constraints in the UK: Evidence from micro data. Journal of Macroeconomics, 32, 239–250. doi: https://doi.org/10.1016/j.jmacro.2009.03.001
- Hermansen, M., & Röhn, O. (2017). Economic resilience: The usefulness of early warning indicators in OECD countries. OECD Journal: Economic Studies, 2016, 9–35. doi: https://doi.org/10.1787/eco_studies-2016-5jg2ppjrd6r3
- Hill, E., St Clair, T., Wial, H., Wolman, H., Atkins, P., Blumenthal, P., … Friedhoff, A. (2012). Economic shocks and regional economic resilience. Building Resilient Regions: Urban and Regional Policy and Its Effects, 4, 193–274.
- Holm, J. R., & Østergaard, C. R. (2015). Regional employment growth, shocks and regional industrial resilience: A quantitative analysis of the Danish ICT sector. Regional Studies, 49, 95–112. doi: https://doi.org/10.1080/00343404.2013.787159
- Huh, D., & Park, S. O. (2018). Organizational routines and regional industrial paths: The IT service industry in the US national capital region. Regional Studies, 52, 793–803. doi: https://doi.org/10.1080/00343404.2017.1301661
- Jeffrey, M. (2007). A decade of alternative investment market (AIM) – But little impact on the UK apparel sector. Journal of Fashion Marketing and Management, 11, 441–444. doi: https://doi.org/10.1108/13612020710763164
- Kierzenkowski, R., Pain, N., Rusticelli, E., & Zwart, S. (2016). The Economic Consequences of Brexit (OECD Economic Policy Papers No. 16). doi:https://doi.org/10.1787/2226583X.
- Lengnick-Hall, C. A., Beck, T. E., & Lengnick-Hall, M. L. (2011). Developing a capacity for organizational resilience through strategic human resource management. Human Resource Management Review, 21, 243–255. doi: https://doi.org/10.1016/j.hrmr.2010.07.001
- Linsley, P. M., & Shrives, P. J. (2006). Risk reporting: A study of risk disclosures in the annual reports of UK companies. British Accounting Review, 38, 387–404. doi: https://doi.org/10.1016/j.bar.2006.05.002
- Markman, G. M., & Venzin, M. (2014). Resilience: Lessons from banks that have braved the economic crisis – And from those that have not. International Business Review, 23, 1096–1107. doi: https://doi.org/10.1016/j.ibusrev.2014.06.013
- Martin, R. (2012). Regional economic resilience, hysteresis and recessionary shocks. Journal of Economic Geography, 12, 1–32. doi: https://doi.org/10.1093/jeg/lbr019
- Martin, R., & Sunley, P. (2015). On the notion of regional economic resilience: Conceptualization and explanation. Journal of Economic Geography, 15, 1–42. doi: https://doi.org/10.1093/jeg/lbu015
- McDermott, M. C. (2010). Foreign divestment. International Studies of Management & Organization, 40, 37–53. doi: https://doi.org/10.2753/IMO0020-8825400404
- Möller, J. (2010). Germany’s job miracle in the world recession – Shock-absorbing institutions in the manufacturing sector. Applied Economics Quarterly (formerly Konjunkturpolitik), 61, 9–28.
- Mulhall, R. A. (2013). Manufacturing change: Competitiveness and adjustment through evolving production relationships. Birmingham: University of Birmingham.
- Pain, A., & Levine, S. (2012). A conceptual analysis of livelihoods and resilience: Addressing the insecurity of agency. London: Overseas Development Institute (ODI).
- Pal, R., Torstensson, H., & Mattila, H. (2011). Organisational resilience and health of business systems. International Journal of Business Continuity and Risk Management, 2, 372–398. doi: https://doi.org/10.1504/IJBCRM.2011.044410
- Pendlebury, M., Groves, R. E. V., & Groves, R. (2004). Company accounts: Analysis, interpretation and understanding. London: Cengage Learning EMEA.
- Phelps, N. A., Mackinnon, D., Stone, I., & Braidford, P. (2003). Embedding the multinationals? Institutions and the development of overseas manufacturing affiliates in Wales and North East England. Regional Studies, 37, 27–40. doi: https://doi.org/10.1080/0034340022000033385
- Sampson, T. (2017). Brexit: The economics of international disintegration. Journal of Economic Perspectives, 31, 163–184. doi: https://doi.org/10.1257/jep.31.4.163
- Sensier, M., & Artis, M. (2016). The resilience of employment in Wales: Through recession and into recovery. Regional Studies, 50, 586–599. doi: https://doi.org/10.1080/00343404.2014.920083
- Sensier, M., Bristow, G., & Healy, A. (2016). Measuring regional economic resilience across Europe: Operationalizing a complex concept. Spatial Economic Analysis, 11, 128–151. doi: https://doi.org/10.1080/17421772.2016.1129435
- Simmie, J., & Martin, R. (2010). The economic resilience of regions: Towards an evolutionary approach. Cambridge Journal of Regions, Economy and Society, 3, 27–43. doi: https://doi.org/10.1093/cjres/rsp029
- Swanstrom, T. (2008). Regional resilience: A critical examination of the ecological framework (Working Paper). Berkeley: Institute of Urban and Regional Development.
- Valikangas, L. (2010). The resilient organization: How adaptive cultures thrive even when strategy fails. New York: McGraw-Hill.
- Wakelin, K. (2001). Productivity growth and R&D expenditure in UK manufacturing firms. Research Policy, 30, 1079–1090. doi: https://doi.org/10.1016/S0048-7333(00)00136-0
- Wrobel, M. (2015). ‘One for all and all for one’: Cluster, employment, and the global economic crisis. Evidence from the German mechanical engineering industry. Papers in Regional Science, 94, 273–294.
